1679
Cardiac Characteristics in Pulmonary Hypertension Patients with Varying Cardiac Index: A Preliminary Study1Radiology, the First Affiliated Hospital of Guangxi Medical University, China, China, 2MR Research Collaboration, Siemens Healthineers, Guangzhou, China, China, China
Synopsis
Keywords: Vascular, Blood vessels
Motivation: The prognosis of advanced pulmonary hypertension (PH) is poor, and incorrect treatment methods may accelerate this process.
Goal(s): To comprehensively investigate the characteristics of PH by employing various imaging sequences, including 4D Flow, cardiac cine, T1/T2mapping.
Approach: CMR imaging was performed on different cardiac index (CI) of PH patients and healthy volunteers to calculate various parameters of the heart and pulmonary arteries. Wilcoxon rank test was used to evaluate inter group differences.
Results: A multi-sequence MRI approach effectively detects and characterizes abnormal heart and pulmonary artery features in PH of different CI, offering insights for early diagnosis and clinical management.
Impact: The research has provided initial insights into the cardiac characteristics of high-CI and low-CI PH patients using magnetic resonance imaging (MRI) technology. It offers new data and perspectives to better understand the physiological and pathological changes in these patients.
Introduction
Early identification and management of high CI induced PH are crucial for improving patient prognosis, incorrect treatment of high-CI PH may lead to clinical deterioration1. In previous studies, we have seen that CMR imaging can effectively evaluate cardiac morphology, maximum flow, wall shear stress (WSS), and myocardial tissue characterization, demonstrating the potential value of CMR in elucidating the complex interactions between pulmonary artery and the right ventricle in patients with PH. However, currently, research on CMR in high-CI PH hasn’t been explored by researchers2–9. study aims to provide a comprehensive assessment of the cardiac characteristics of PH patients with varying CI levels. To achieve this goal, we utilize advanced MRI techniques, including 4D Flow, cine imaging, and T1/T2 mapping, to gain a thorough understanding of PH and its impact on the heart. This comprehensive evaluation will facilitate a more accurate diagnosis and guide effective treatment strategies for PH patients.Methods
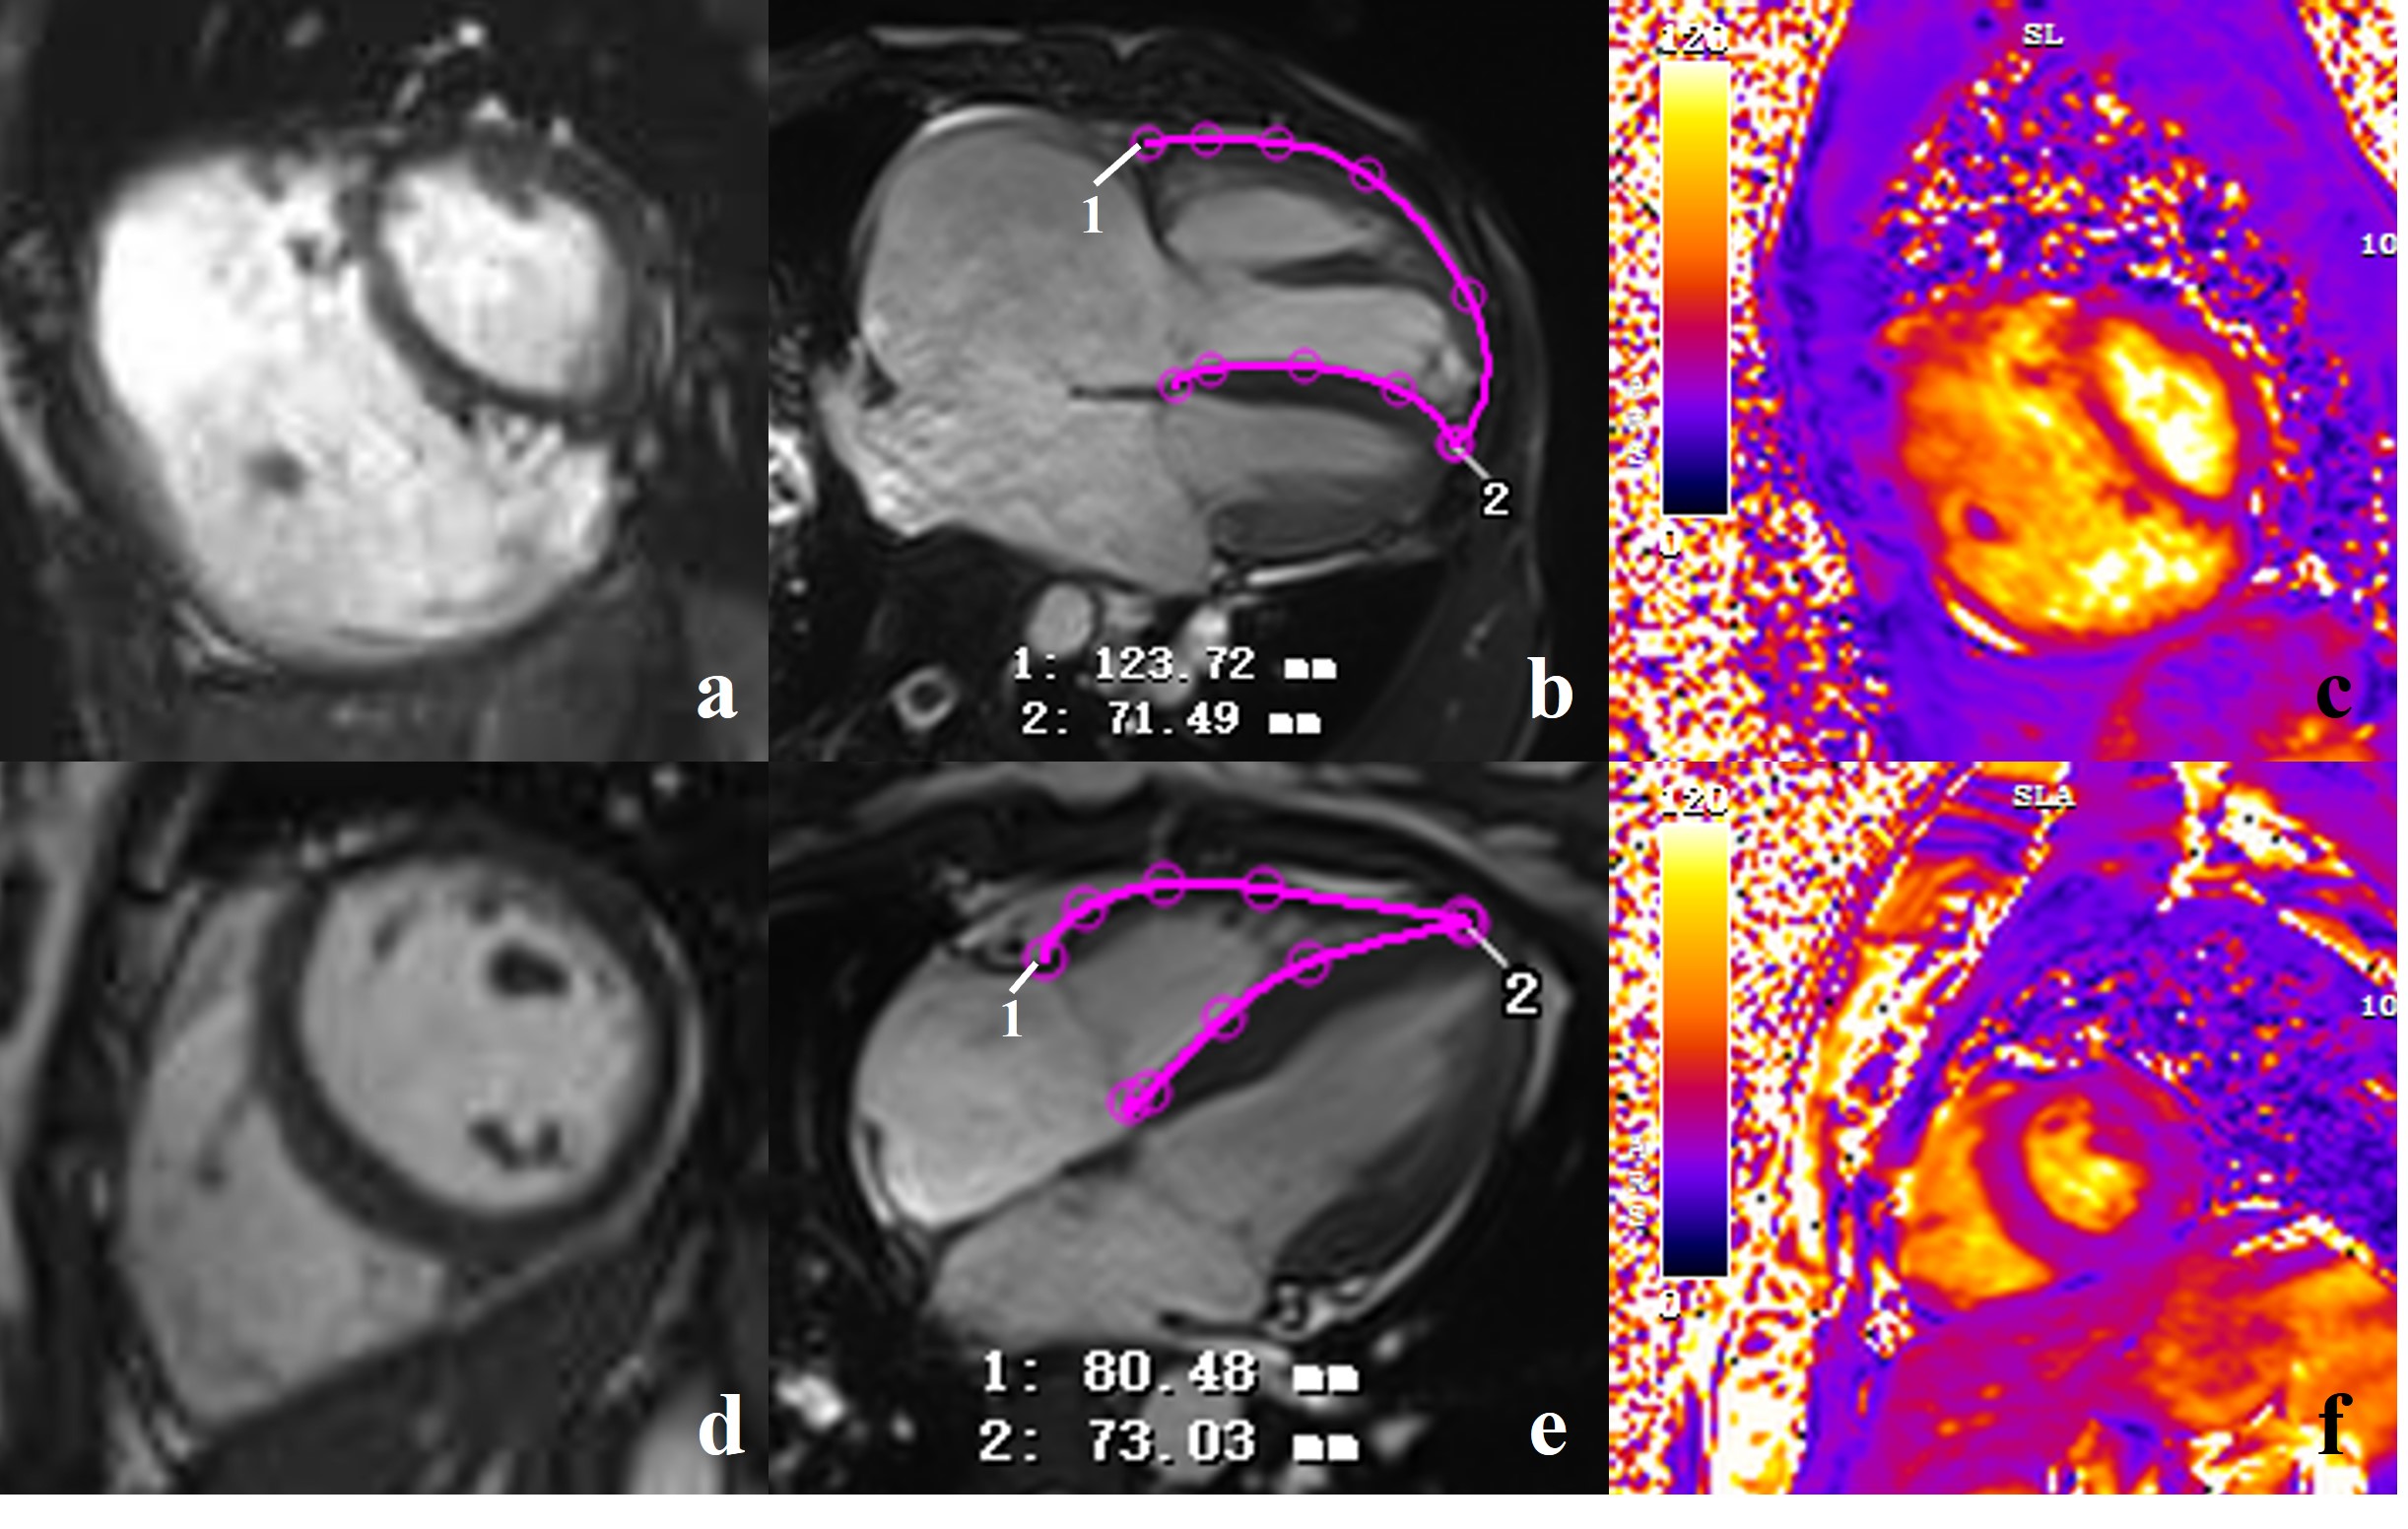
12 patients with PH, defined as mean PAP >20 mmHg by right heart catheterization, and 6 healthy volunteers, underwent CMR imaging. According to the results of right heart catheterization, 8 PH patients with CI ≥ 4 L/min/m² were defined as high-CI group, while the remaining 4 PH patients were classified as low-CI group. To better assess the impact of high CI on PH, a group of healthy volunteers and individuals with lower CI were combined to form the "non-high-CI" group, for comparison with the "high-CI" group due to the limited sample size. All patients and healthy volunteers underwent MRI using a 3T system (MAGNETOM Prisma, Siemens Healthineerscare, Erlangen, Germany) with scanning parameters shown in figure 1. Various parameters, including maximum flow, WSS, right ventricular end-systolic remodeling index (RVESRI = end-systolic lateral free wall length / septal height)10 and T1/T2 mapping, were measured and calculated using CVI-42 software. Wilcoxon rank sum test was used to evaluate the differences among groups, with p-value < 0.05 considered statistically significant. All analyses were performed using SPSS 26.0 statistical software.Results
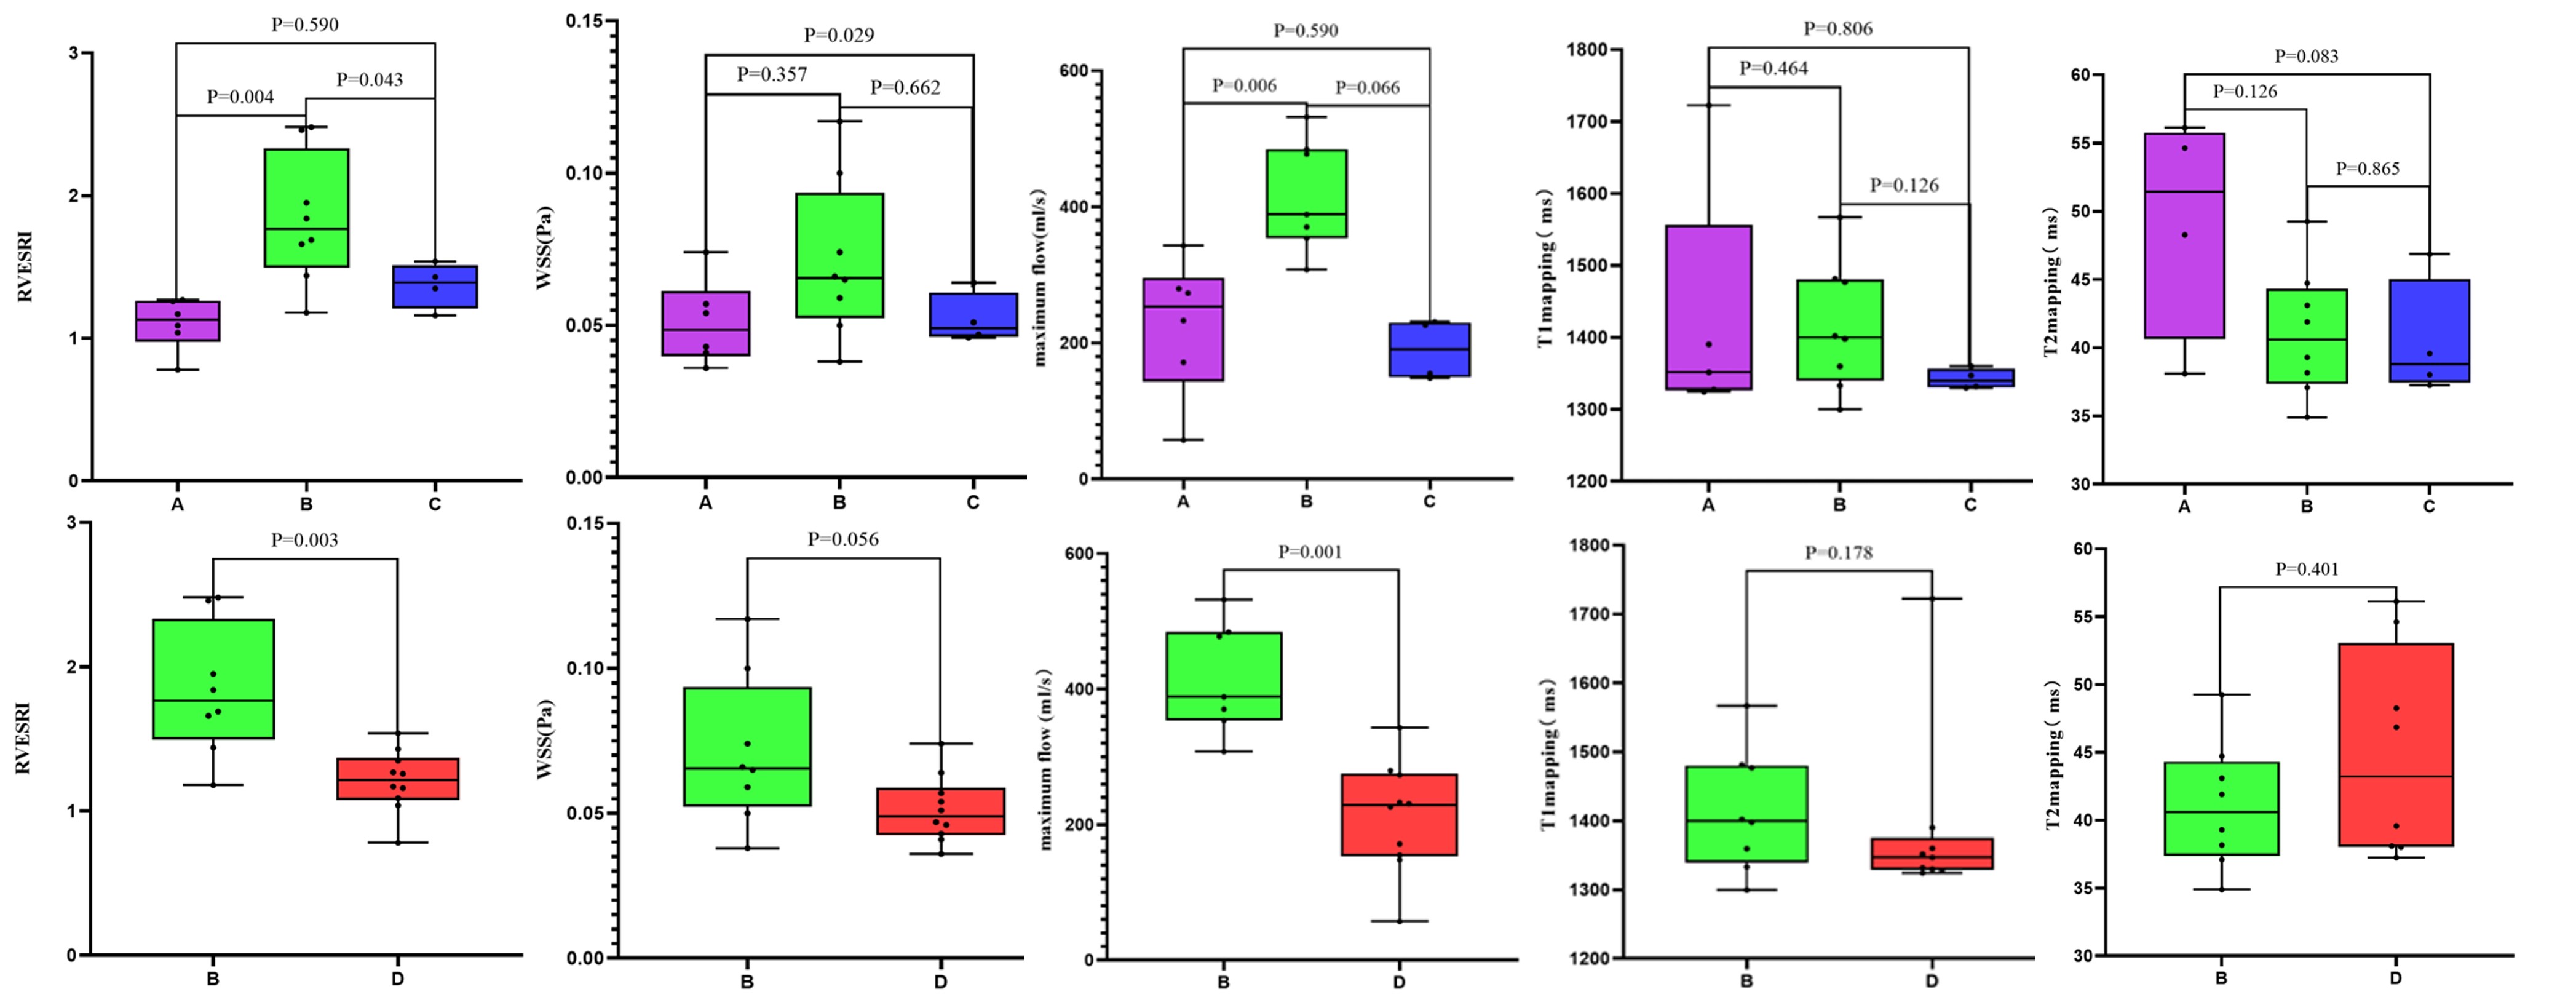
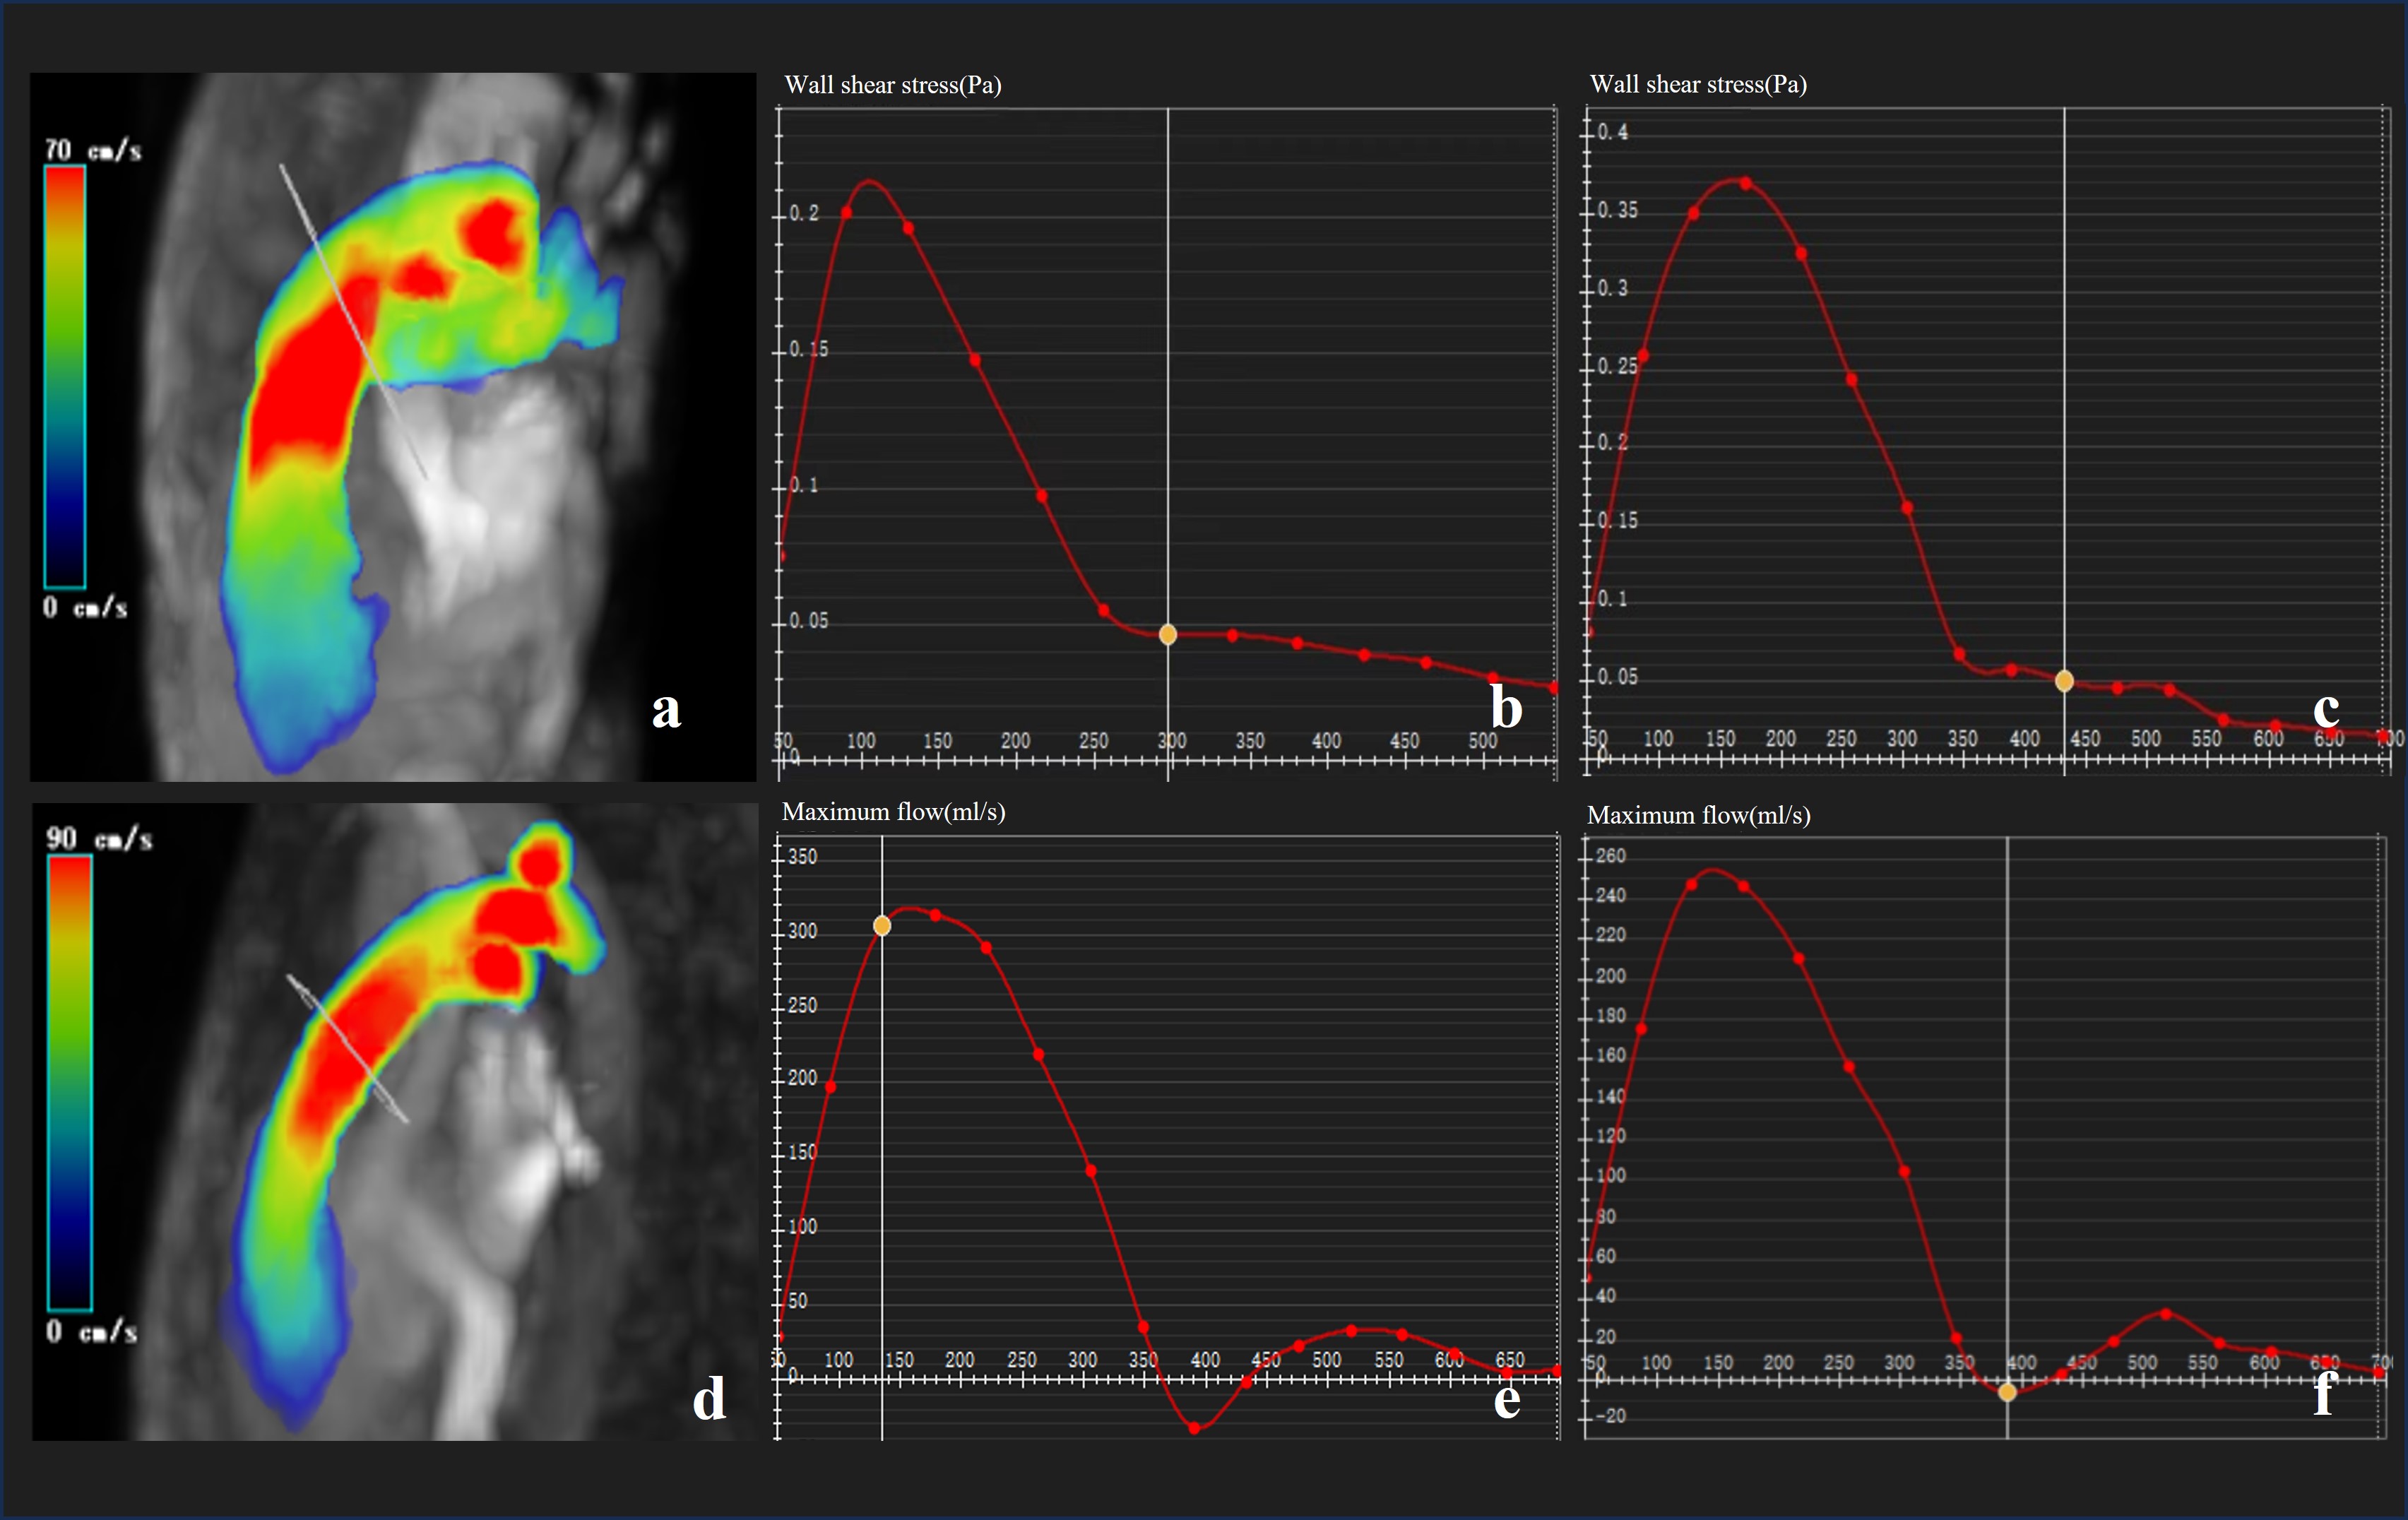
The RVESRI values were significantly higher in the high-CI group compared with healthy volunteers and the low-CI group (P = 0.004, P = 0.043), but there was no statistically significant difference in RVESRI value between the low-CI group and healthy volunteers (P = 0.590). The maximum flow was greater in the high-CI group than in healthy volunteers (P = 0.006), and there were no significant differences in maximum flow between the low-CI group and either healthy volunteers or the high-CI group (P = 0.590, P = 0.066). Furthermore, WSS values were lower in the low-CI group than in healthy volunteers (P = 0.029); however, there were no significant differences in WSS values between the high-CI group and either healthy volunteers or the low-CI group (P = 0.357, P = 0.662). Comparing the high-CI group to the non-high-CI group showed significant differences in maximum flow and RVESRI, with the high-CI group significantly higher, with respective P-values of (P = 0.001 , P = 0.003); however, the differences in WSS value remained not statistically significant (P = 0.056). There were no statistically significant differences in T1 or T2 mapping values among the high-CI group, low-CI group, and healthy volunteers, and the detailed results are shown in Figure 2. Figures 3 and 4 show image examples from one patient and one healthy volunteer.Discussion
In this study, patients with higher CI in the high-CI group displayed markedly RVESRI, indicating pronounced right ventricular remodeling. Furthermore, the high-CI group exhibited significantly higher maximum flow, emphasizing the hemodynamic shifts associated with PH, especially in cases with increased CI. Merging the low-CI group with healthy volunteers to form a non-high-CI group resulted in decreased P-values for RVESRI and maximum flow parameters in the high-CI group. This strengthens the idea that patients with higher CIs undergo more significant right ventricular remodeling and hemodynamic changes.However, T1 and T2 mapping values did not show statistically significant differences among the groups, suggesting they may be less sensitive markers for right ventricular structural changes. This could be due to the superior sensitivity of RVESRI and maximum flow or the limited sample size. Additionally, the stability of T1/T2 mapping as an index may be a consideration11,12. The decrease in WSS in the low-CI group may be due to the sample size limitations. In conclusion, these findings are preliminary, and larger sample sizes are needed for a more comprehensive understanding of PH patient characteristics and to provide precise treatment strategies for improved prognosis.
Acknowledgements
not applicableReferences
1. Qaiser, K. N., Sahay, S. & Tonelli, A. R. Pulmonary hypertension due to high cardiac output. Respir Med 206, 107034 (2023).
2. Helderman, F., Mauritz, G.-J., Andringa, K. E., Vonk-Noordegraaf, A. & Marcus, J. T. Early onset of retrograde flow in the main pulmonary artery is a characteristic of pulmonary arterial hypertension. J Magn Reson Imaging 33, 1362–1368 (2011).
3. Aj, B. et al. Four-dimensional flow assessment of pulmonary artery flow and wall shear stress in adult pulmonary arterial hypertension: results from two institutions. Magnetic resonance in medicine 73, (2015).
4. Ota, H., Sugimura, K., Miura, M. & Shimokawa, H. Four-dimensional flow magnetic resonance imaging visualizes drastic change in vortex flow in the main pulmonary artery after percutaneous transluminal pulmonary angioplasty in a patient with chronic thromboembolic pulmonary hypertension. Eur Heart J 36, 1630 (2015).
5. Reiter, G. et al. Magnetic resonance-derived 3-dimensional blood flow patterns in the main pulmonary artery as a marker of pulmonary hypertension and a measure of elevated mean pulmonary arterial pressure. Circ Cardiovasc Imaging 1, 23–30 (2008).
6. Truong, U. et al. Wall shear stress measured by phase contrast cardiovascular magnetic resonance in children and adolescents with pulmonary arterial hypertension. J Cardiovasc Magn Reson 15, 81 (2013).
7. Tang, B. T. et al. Wall shear stress is decreased in the pulmonary arteries of patients with pulmonary arterial hypertension: An image-based, computational fluid dynamics study. Pulm Circ 2, 470–476 (2012).
8. Bogaert, J. et al. Magnetic resonance relaxometry of the liver - a new imaging biomarker to assess right heart failure in pulmonary hypertension. J Heart Lung Transplant 41, 86–94 (2022).
9. Alabed, S. et al. Myocardial T1-mapping and extracellular volume in pulmonary arterial hypertension: A systematic review and meta-analysis. Magn Reson Imaging 79, 66–75 (2021).
10. Zhang, L. et al. Right ventricular end-systolic remodeling index on cardiac magnetic resonance imaging: comparison with other functional markers in patients with chronic thromboembolic pulmonary hypertension. Quant Imaging Med Surg 12, 894–905 (2022).
11. Ferreira, V. M., Piechnik, S. K., Robson, M. D., Neubauer, S. & Karamitsos, T. D. Myocardial tissue characterization by magnetic resonance imaging: novel applications of T1 and T2 mapping. J Thorac Imaging 29, 147–154 (2014).
12. Messroghli, D. R. et al. Clinical recommendations for cardiovascular magnetic resonance mapping of T1, T2, T2* and extracellular volume: A consensus statement by the Society for Cardiovascular Magnetic Resonance (SCMR) endorsed by the European Association for Cardiovascular Imaging (EACVI). J Cardiovasc Magn Reson 19, 75 (2017).
Figures