1666
Optimization of variable-density undersampling for accelerated myocardial delayed enhancement imaging with deep learning reconstruction1GE HealthCare, Jersey City, NJ, United States, 2GE HealthCare, Fairfax, VA, United States, 3GE HealthCare, Menlo Park, CA, United States, 4GE HealthCare, San Diego, CA, United States, 5GE Research, Herzliya, Israel, 6GE HealthCare, Munich, Germany, 7Inova Fairfax Hospital, Fairfax, VA, United States
Synopsis
Keywords: Myocardium, Myocardium, myocardial delayed enhancement, deep learning reconstruction
Motivation: Myocardial delayed enhanced (MDE) imaging is the gold standard for assessing myocardial viability in various cardiac pathologies. However, long breath-hold is needed for MDE to achieve reasonable spatial resolution, hampering its utility for patients with insufficient breath-hold capability.
Goal(s): The goal for this study is to optimize a variable-density undersampling pattern to achieve highly accelerated MDE imaging combined with deep learning reconstruction.
Approach: The optimization was conducted with phantom and post-contrast in vivo studies.
Results: The optimized undersampling pattern and deep learning reconstruction enable 4-time acceleration for phase-sensitive MDE imaging with comparable image quality to the reference image.
Impact: The optimized variable-density undersampling pattern combined with deep learning reconstruction can potentially expand the clinical utility of MDE imaging to especially patient with insufficient breath-hold capability, and improve the patient comfort.
Introduction
Myocardial delayed enhanced (MDE) imaging has become the gold standard for assessing myocardial viability in various cardiac pathologies1,2, and is widely adopted in clinical practice. With the phase-sensitive (PS) inversion-recovery sequence, MDE becomes less sensitive to the effects of suboptimal inversion time selection3. However, PS MDE acquisition still requires relatively long breath-holds to achieve reasonable spatial resolution, even with parallel imaging techniques, which limits its utility for patients with insufficient breath-hold capability. In this study, a variable-density undersampling pattern was optimized with phantom and in vivo studies, and 4-time acceleration for PS MDE imaging can be achieved combined with a deep learning algorithm.Methods
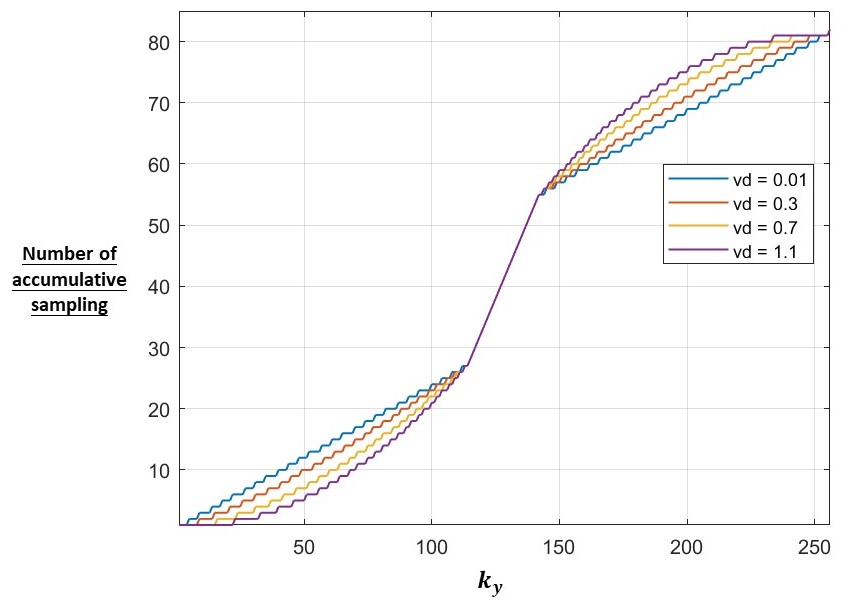
The variable-density undersampling pattern was designed based on a parametrized probability density function (PDF)4: PDF(ky) = [(1 - |1 - ky|) / (nkfull / 2)]vd, where nkfull is the number of fully acquired ky lines without acceleration, and vd is a parameter adjusting the shape of PDF. Higher vd indicates denser sampling in the center of k-space and less sampling in the k-space edge. Besides, similar to ARC, the k-space center is fully sampled with 24 calibration lines (Fig. 1). All MR data was acquired on 1.5 T MR scanners (450w/Artist, GE HealthCare, Waukesha, WI). Phantom data was acquired with an ACR phantom using segmented PS MDE sequence (FOV = 36 x 36 cm2, matrix size = 256 x 256, slice thickness = 8 mm, flip angle = 20˚, view per segment (vps) = 24, acceleration = 1). For in vivo data, post-contrast PS MDE data were acquired from 5 subjects in short-axis plane (FOV = 40 x 40 cm2, matrix size = 200 x 200, slice thickness = 8 mm, flip angle = 25˚, vps = 24, acceleration = 1). For both the fully-sampled phantom and in vivo data, retrospective undersampling was conducted with variable-density undersampling pattern (vd = 0.01, 0.1, 0.3, 0.5, 0.7, 0.9, and 1.1), and the undersampled data was reconstructed using a deep learning algorithm as previously described4,5. The fully-sampled data was reconstructed with routine ARC reconstruction.Results and Discussion
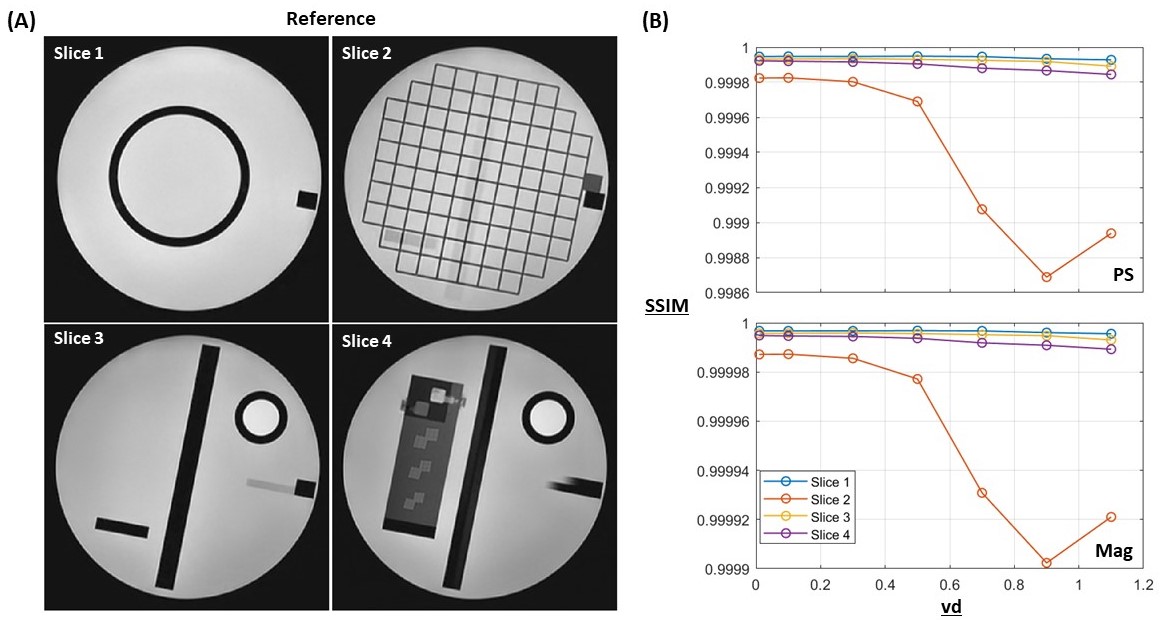
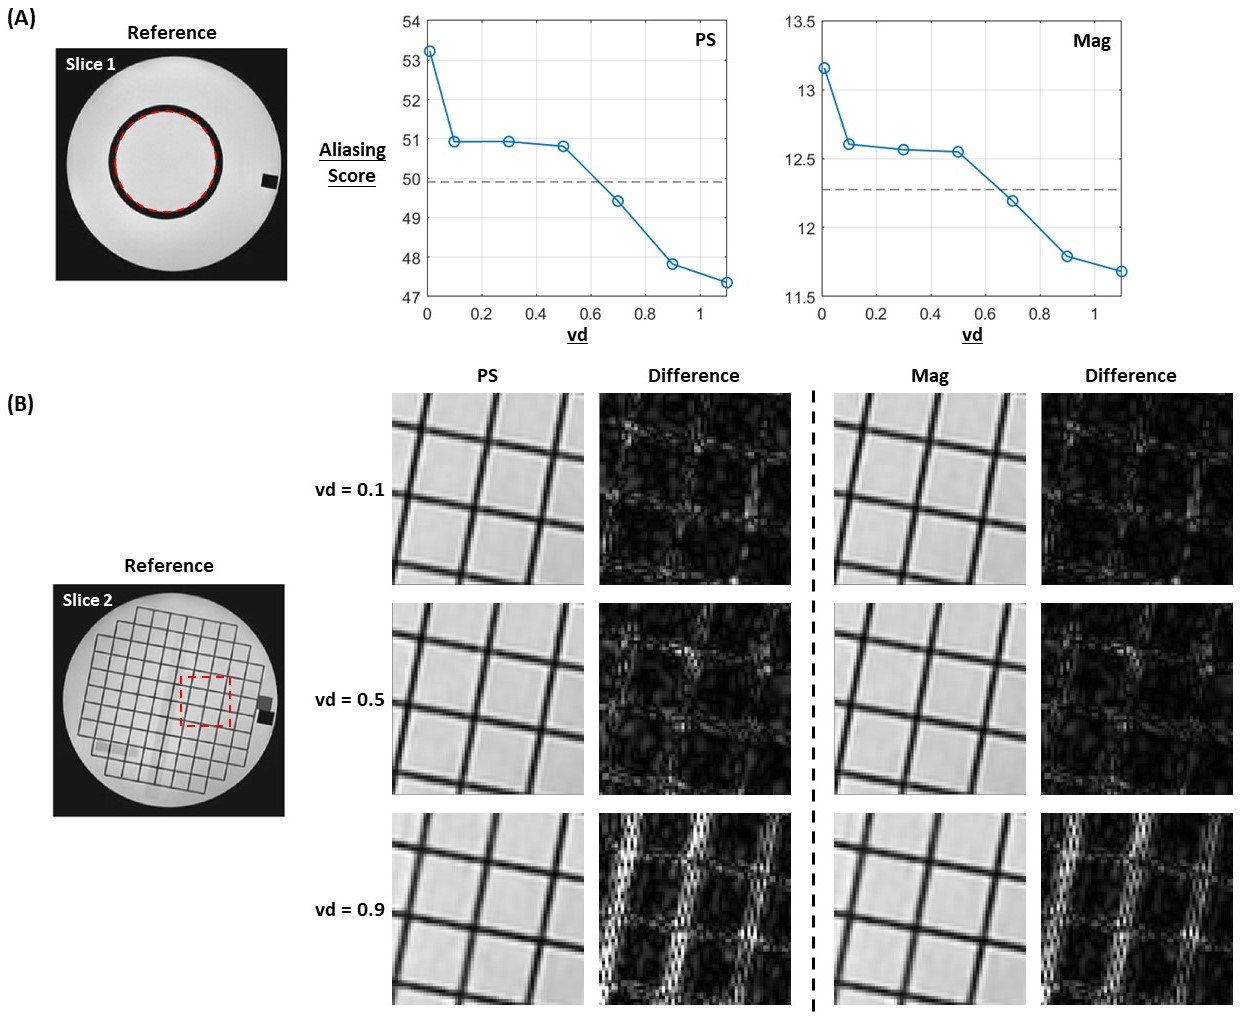
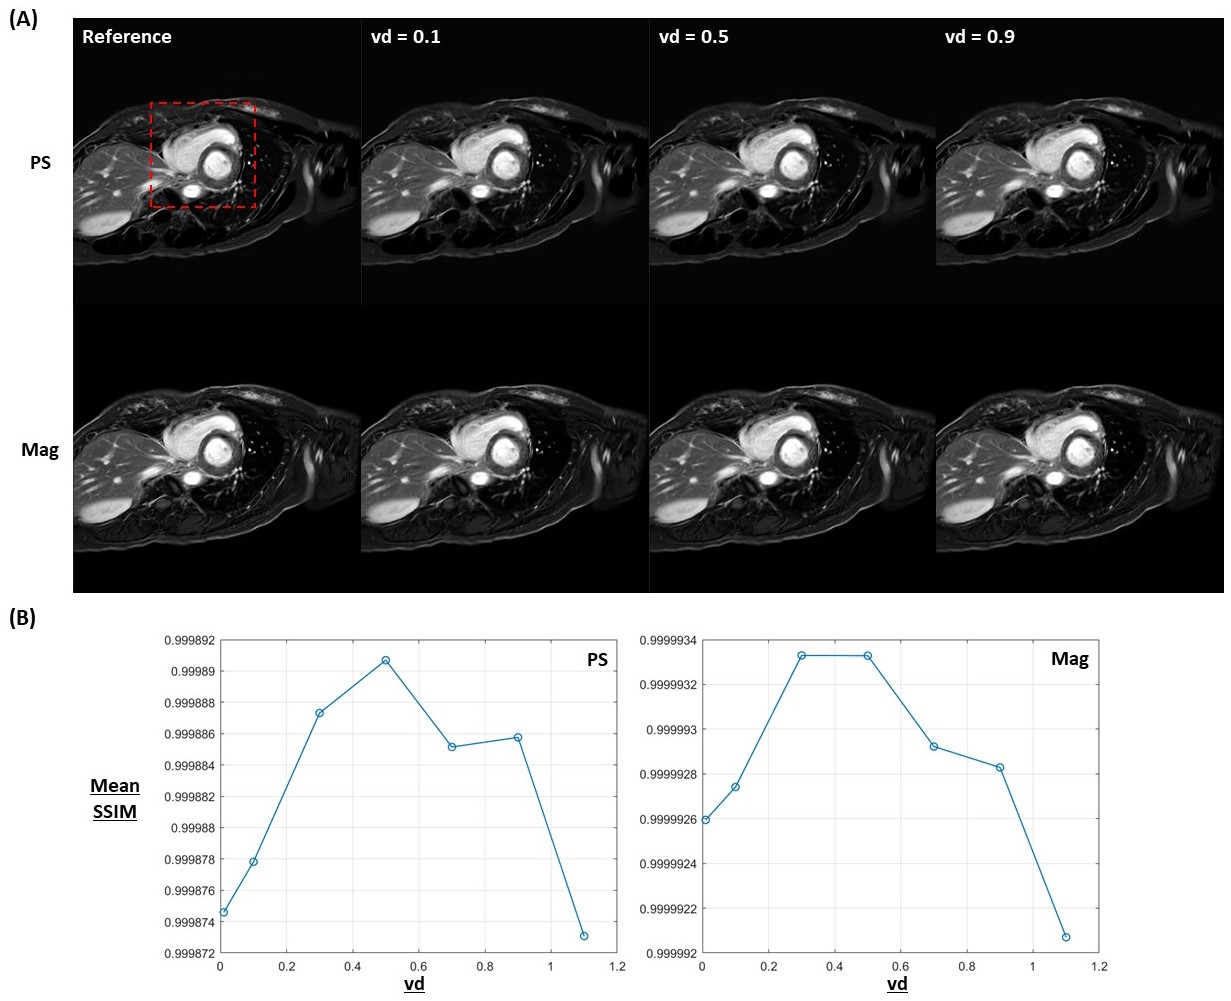
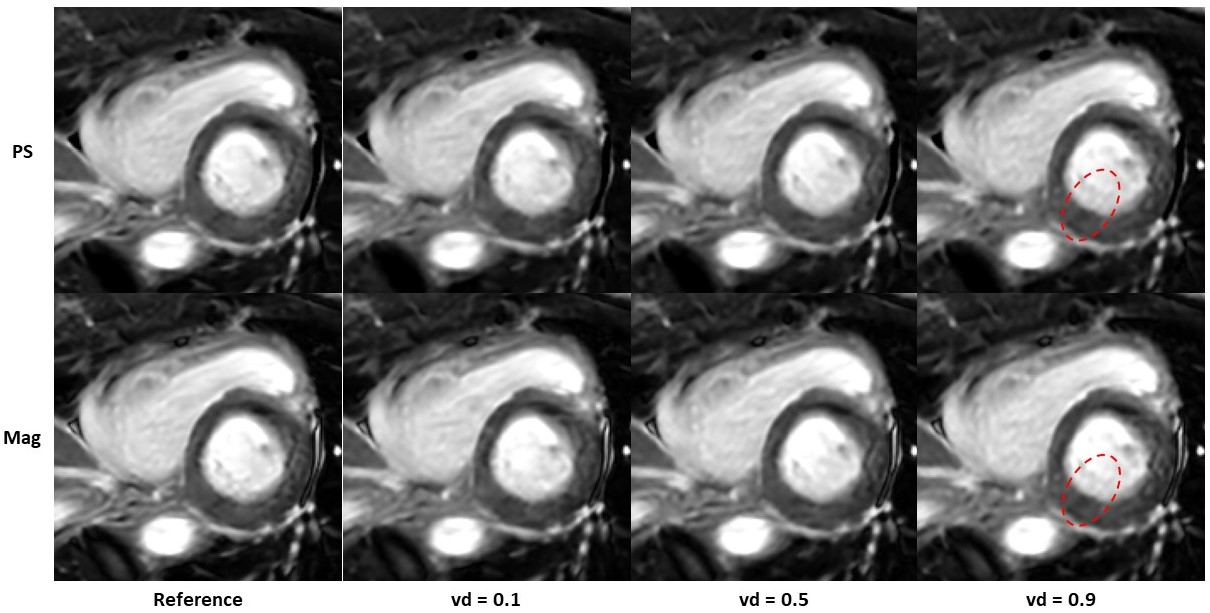
Fig. 2(A) shows the fully-sampled PS images from phantom. Structure similarity index (SSIM) was calculated for the retro-undersampled PS and magnitude (Mag) images using fully-sampled images as reference. For both PS and Mag images, SSIM shows a declining trend when vd increases, while the change is relatively minor. Aliasing in the undersampled images were evaluated by aliasing score, which is defined as the standard deviation within center compartment in slice 1 (red dashed circle in Fig. 3(A)). Higher vds show smaller aliasing scores, indicating less aliasing within the ROI. This is likely due to more center k-space lines acquired with higher vds. Compared to aliasing scores calculated from the fully-sampled images (gray dashed lines in Fig. 3(A)), vd should be larger than 0.5 to achieve comparable aliasing performance in the undersampled images. Image sharpness was evaluated visually from the ROI within slice 3 (red dashed square in Fig. 3(B)). The zoomed-in view, as well as difference maps between retro-undersampled and fully sampled refence images, are shown in Fig. 3(B) for vd = 0.1, 0.5 and 0.9. Reduced image sharpness was observed in higher vd (especially when vd = 0.9). This is related to the fact that with higher vds, less edge k-space lines were acquired, thus compromising the image sharpness. Overall, according to the phantom data, optimized image quality appears when vd is around 0.5.Post-contrast PS and Mag MDE images from a representative subject are shown in Fig. 4(A), which consists of the fully-sampled reference and retro-undersampled images with vd = 0.1, 0.5 and 0.9. The zoomed-in view of the heart (red dashed square in Fig. 4(A)) are shown in Fig. 5. No visual difference was observed in image sharpness between fully-sampled and retro-undersampled images. Minor artifacts were seen from retro-undersampled images with vd = 0.9. SSIMs were calculated for all retro-undersampled PS and Mag images from all 5 subjects (Fig. 4(B)). Highest mean SSIM appears when vd = 0.5 for PS images, and appears when vd = 0.3 and 0.5 for Mag images. Besides, compared to reference acquisition, the breath-hold duration can be reduced from 26 s to 12 s with 4-time acceleration for subject with heart rate of 60 BPM.
Conclusion
Optimized variable-density undersampling combined with deep learning reconstruction has been evaluated retrospectively on phantom and in vivo data for the PS MDE sequence. With the optimized undersampling pattern, comparable image quality can be achieved as fully-sampled reference with 4-time acceleration. For next step, prospective in vivo study will be conducted to further confirm the findings.Acknowledgements
No acknowledgement found.References
1. Kim RJ, Fieno DS, Parrish TB, et al. Relationship of MRI delayed contrast enhancement to irreversible injury, infarct age, and contractile function. Circulation. 1999;100:1992-2002.
2. Friedrich MG, Strohm O, Schulz-Menger J, et al. Contrast media-enhanced magnetic resonance imaging visualizes myocardial changes in the course of viral myocarditis. Circulation. 1998;97:1802–9.
3. Kellman P, Arai AE, McVeigh ER, et al. Phase-sensitive inversion recovery for detecting myocardial infarction using gadolinium-delayed hyperenhancement. Magn Reson Med. 2002;47:372–83.
4. Michael C, Rafi B, Nir M, et al. Deep learning reconstruction for 4-fold accelerated 2DFSE imaging: optimization of variable density undersampling. ISMRM 2023. #4043.
5. Sangtae A, Uri W, Graeme M, et al. Deep learning-based reconstruction of highly accelerated 3D MRI. arXiv:2203.04674 [eess.IV].
Figures