1661
Utilization of Strain Parameters Assessed by CMR Feature Tracking Analysis for Persistent Cardiac Symptoms Following the Exertional Heat Stroke1Department of Radiology, Jinling Hospital, Nanjing, China, Nanjing, China, 2MR Research, GE Healthcare, Beijing , China, Beijing, China
Synopsis
Keywords: Heart Failure, Myocardium, cardiac MRI; exertional heat illness; myocardial strain; return-to-play
Motivation: More attention has been paid to the diagnosis and treatment of patients with heatstroke, while little research has been done on its prognosis.
Goal(s): The main hypothesis is that left ventricle strain parameters assessed by CMR feature tracking can predict long-term heart symptoms in exertional heatstroke patients.
Approach: Patients with exertional heatstroke underwent serologic cardiac enzyme levels and CMR at baseline and follow-up to assess the relationship between left ventricular strain parameters and recovery training.
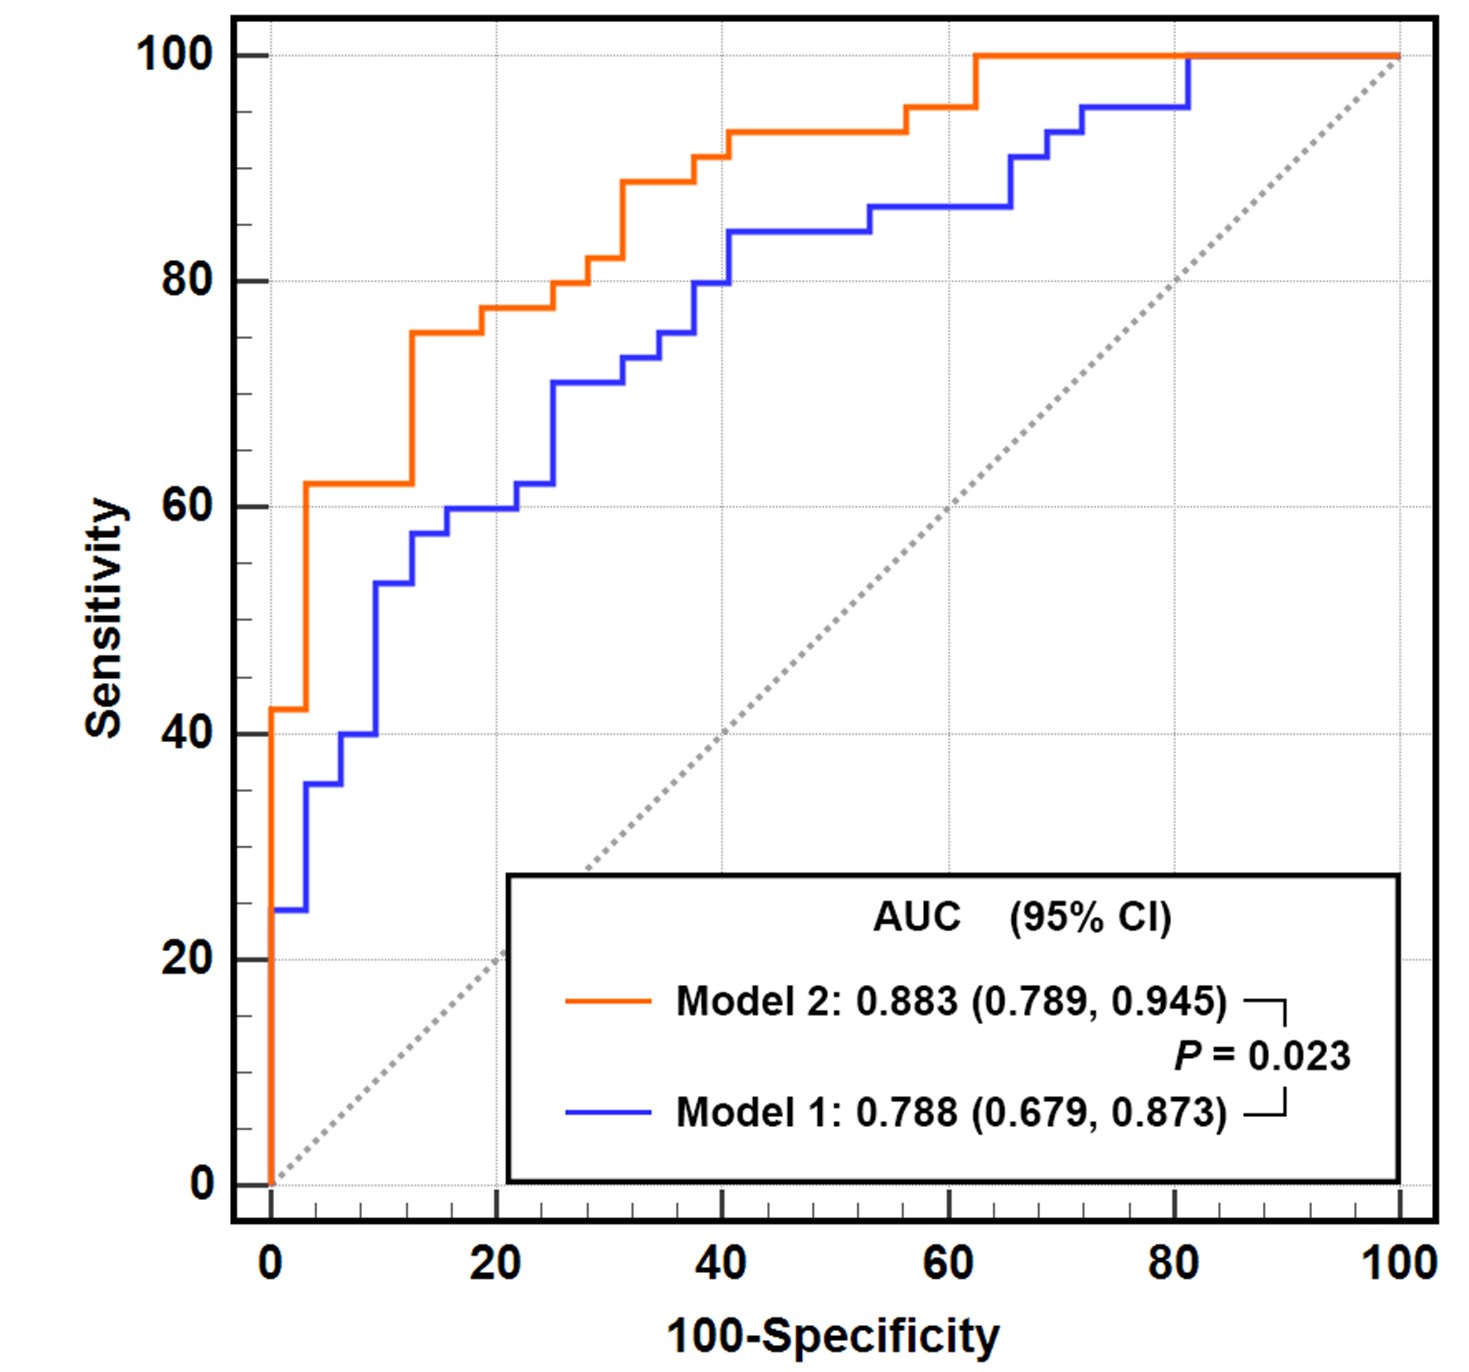
Results: The 2D-global longitudinal strain provided incremental prognostic value over traditional outcome predictors (areas under the receiver operating characteristic curve comparing models, 0.788 vs 0.883; P = 0.023).
Impact: Our findings suggest that ongoing reduction in left ventricle strain may explain the lingering cardiac symptoms in patients with previous heat illness. It will help identify individuals at risk, improve follow-up, and provide assistance for return-to-play and reducing future risks.
Background
Many individuals experience persistent cardiac symptoms after exertional Heatstroke (EHS). However, to the author's knowledge, the relationship between left ventricular strain function and long-term prognosis in exertional Heat stroke patients is still unknown.Objectives
This study aimed to evaluate left ventricle (LV) strain parameters assessed by cardiac magnetic resonance feature tracking (CMR-FT) analysis as persistent cardiac symptom predictors in heatstroke patients in a prospective CMRI cohort.Materials and Methods
Participants with EHS who underwent serologic cardiac enzyme levels and cardiac MRI cine sequence were included. The study took place between June 2020 and August 2023. Two-dimensional (2D) LV strain parameters assessed by CMR-FT analysis were derived from cine cardiac MRI by using CVI 42 software. Cardiac symptoms were evaluated at a 3-month follow-up time point. The follow-up major cardiac symptoms events were defined as chest pain, dyspnea, palpitations, syncope, and recurrent heat-related illness. The association between LV strain parameters and return-to-play (RTP) was evaluated by univariate and multivariate logistic regression analysis.Results
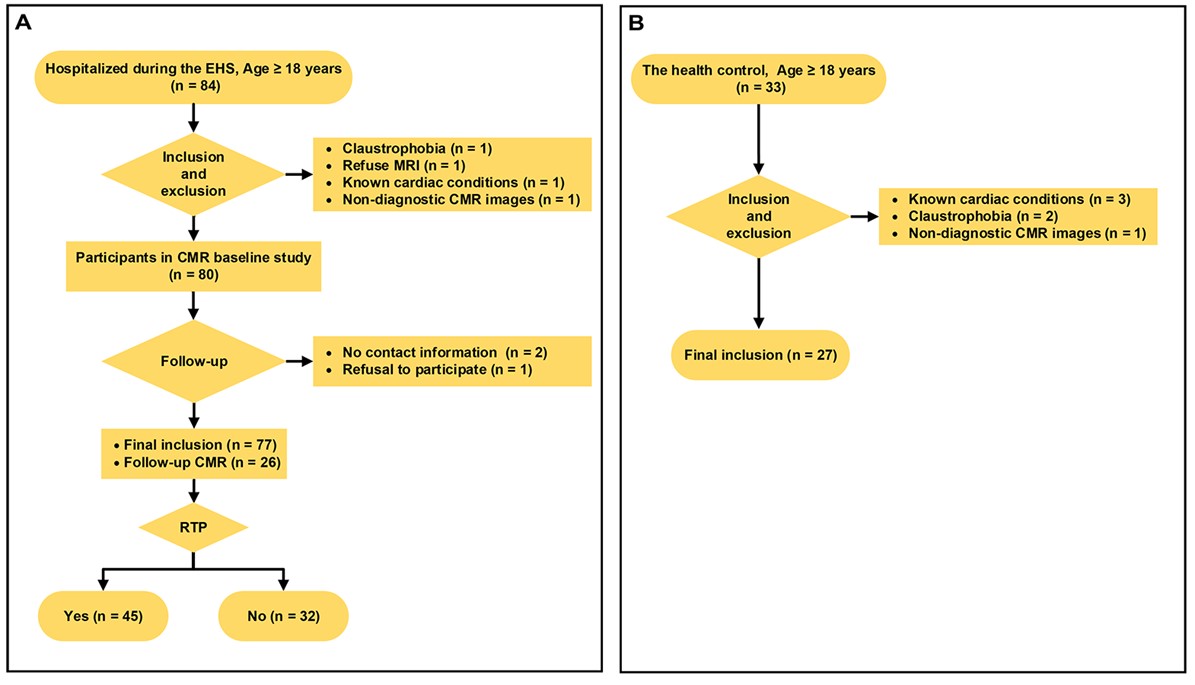
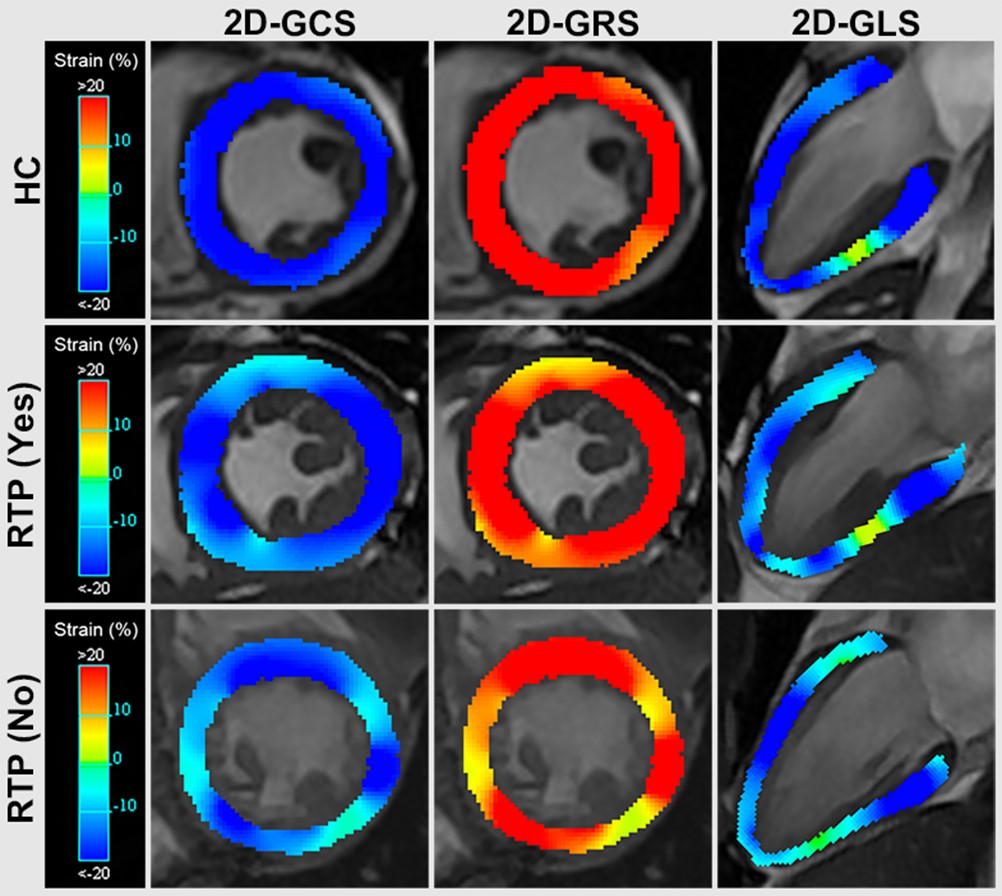
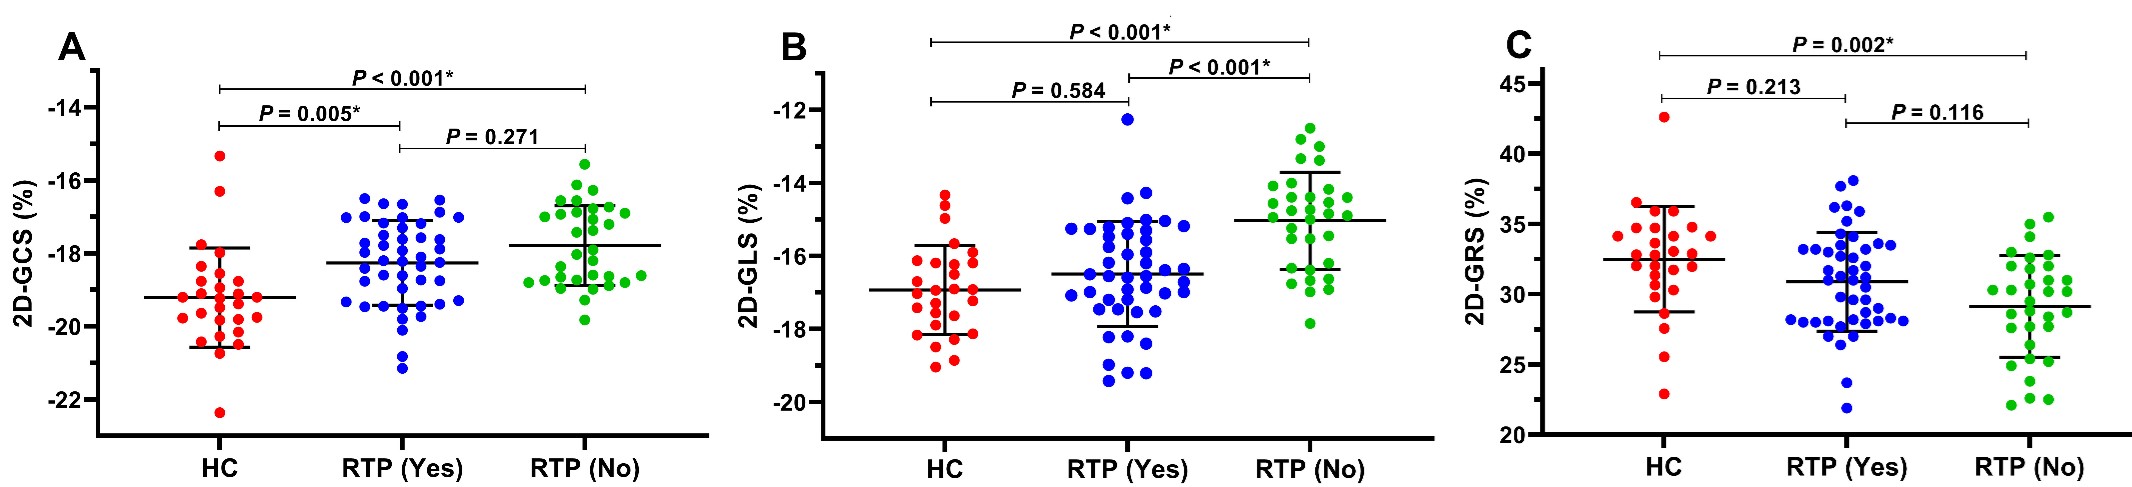
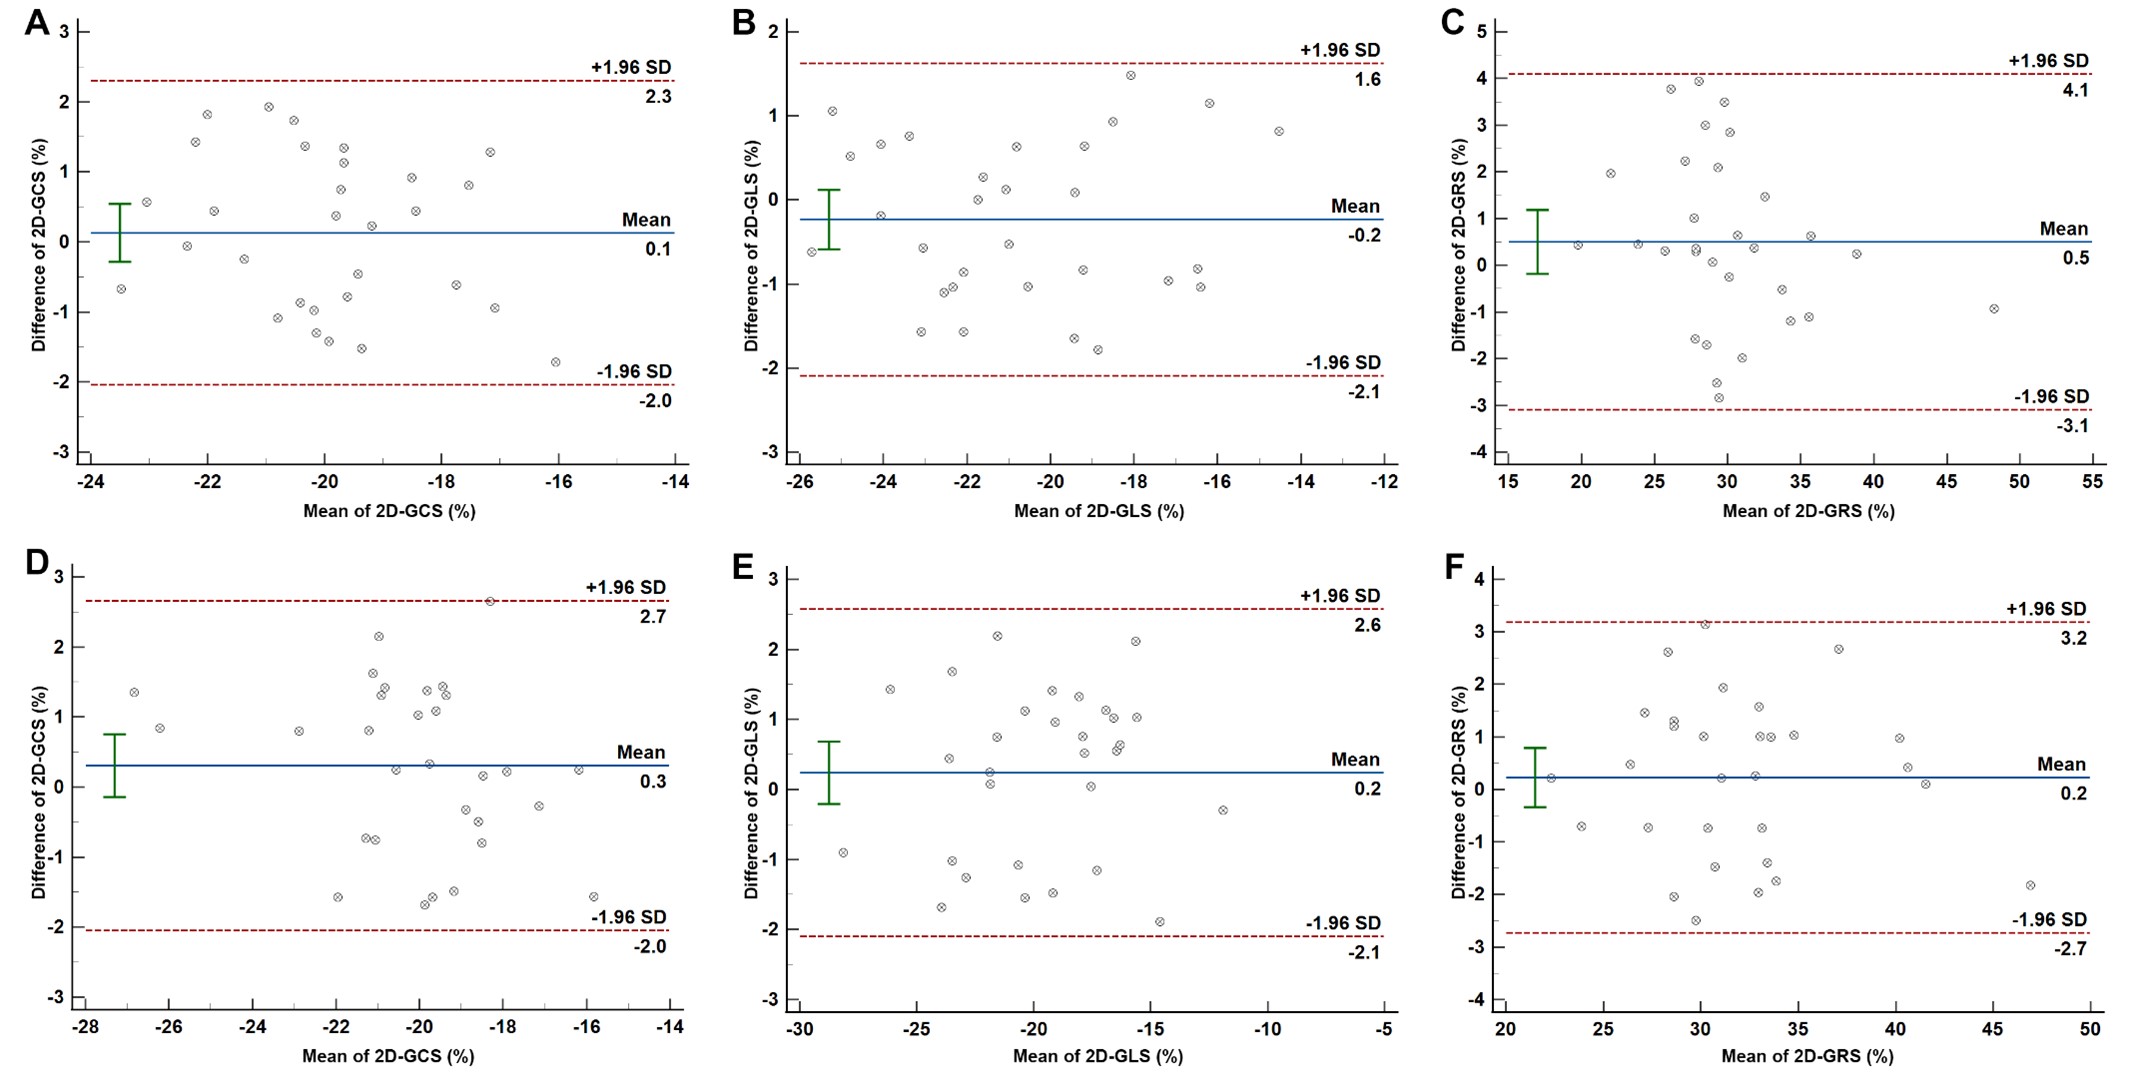
A total of 77 participants (median age, 21 years; interquartile range (IQR), 20-23 years) and 27 health controls (median age, 21 years; IQR, 20-22 years) were included in this study (Fig. 1). During a 3-month follow-up, 32 participants (41.6%) showed no cardiac symptoms and were able to return to play. The 2D global longitudinal strain (GLS) was significantly impaired in the participants compared to the health control group (-15.81 ± 1.67% vs -16.93 ± 1.22%, P = 0.001) (Fig. 2, Fig. 3). There were also significant differences between subgroups (-14.99 ± 3.54% vs -16.53 ± 1.43%, P < 0.001) (Fig. 2, Fig. 3). 2D-GLS (odds ratio (OR), 2.193; 95% confidence interval (CI): 1.300, 3.695; P = 0.003) were was independent predictors for RTP after adjustment for known risk factors. Finally, the 2D-GLS provided incremental prognostic value over traditional outcome predictors (areas under the receiver operating characteristic curve comparing models, 0.788 vs 0.883; P = 0.023) (Fig. 4).Conclusions
The evaluation of left ventricle strain, as a measure of left ventricle function, provided incremental prognostic information to established predictors for return-to-play in exertional heatstroke.Acknowledgements
None.References
- Epstein Y, Longo D L, Yanovich R. Heatstroke. N Engl J Med, 2019; 380(25): 2449-2459.
- Marchand M, Gin K. The cardiovascular system in heat stroke. CJC Open, 2022; 4(2): 158-163.
- Luo S, Xu S T, Zhang J, et al. Multiparametric cardiac magnetic resonance reveals persistent myocardial inflammation in patients with exertional heat illness. Eur Radiol, 2023.
- Fischer K, Obrist S J, Erne S A, et al. Feature tracking myocardial strain incrementally improves prognostication in myocarditis beyond traditional cmr imaging features. JACC: Cardiovascular Imaging, 2020; 13(9): 1891-1901.
- Degroot D W, O'connor F G, Roberts W O. Exertional heat stroke: An evidence based approach to clinical assessment and management. Experimental Physiology, 2022; 107(10): 1172-1183.
Figures