1659
Incremental value of left atrial conduit strain in predicting LVr in patients with STEMI: A Cardiovascular Magnetic Resonance Study1Radiology, First Hospital of China Medical University, Shenyang, China
Synopsis
Keywords: Myocardium, Cardiomyopathy
Motivation: Early prediction of LVr is significant for the selection of clinical treatment to improve the prognosis of STEMI patients.
Goal(s): To explore whether strain markers, as derived by CMR feature tracking (CMR-FT) at the early onset of STEMI may improve the predictive certainty of LVr.
Approach: 120 patients with a first reperfused STEMI were investigated prospectively within 7 days after PCI. Both LA and LV strain and strain rate were calculated using CMR-FT.
Results: The reduction of LV-GLS can predict LVr independent of T2* value, and the reduction of LA-ℇe remain an independent predictor of LVr after adjusting LV-GLS and T2* value.
Impact: In the present study, the reduction of LA conduit strain derived by CMR-FT at the early onset of STEMI increases the likelihood of LVr independent of T2* value and LV-GLS.
Introduction
Early coronary intervention effectively reduces the mortality after ST-segment elevation myocardial infarction (STEMI) [1], yet now a large number of patients still have severe left ventricular remodeling (LVr) after ischemia-reperfusion, which eventually leads to complications such as heart failure in approximately 70% of patients and contributes to long-term mortality [2-4]. Early prediction of LVr is of great significance for the selection of clinical treatment to improve the prognosis of patients.Strain markers derived by CMR feature tracking (CMR-FT) have also shown promise in providing prognostic information for the occurrence of LVr post-MI [5]. While the strain data of the left atrium (LA), has some predictive value for the occurrence of heart failure after acute myocardial infarction [6], few CMR studies have focused on LA strain with discrete reservoir, conduit, and booster bump phases in assessing the prognosis of STEMI [7,8]. We hypothesize that exploring CMR imaging markers of LA and LV strain parameters could offer more effective LVr prediction in STEMI patients.
Methods
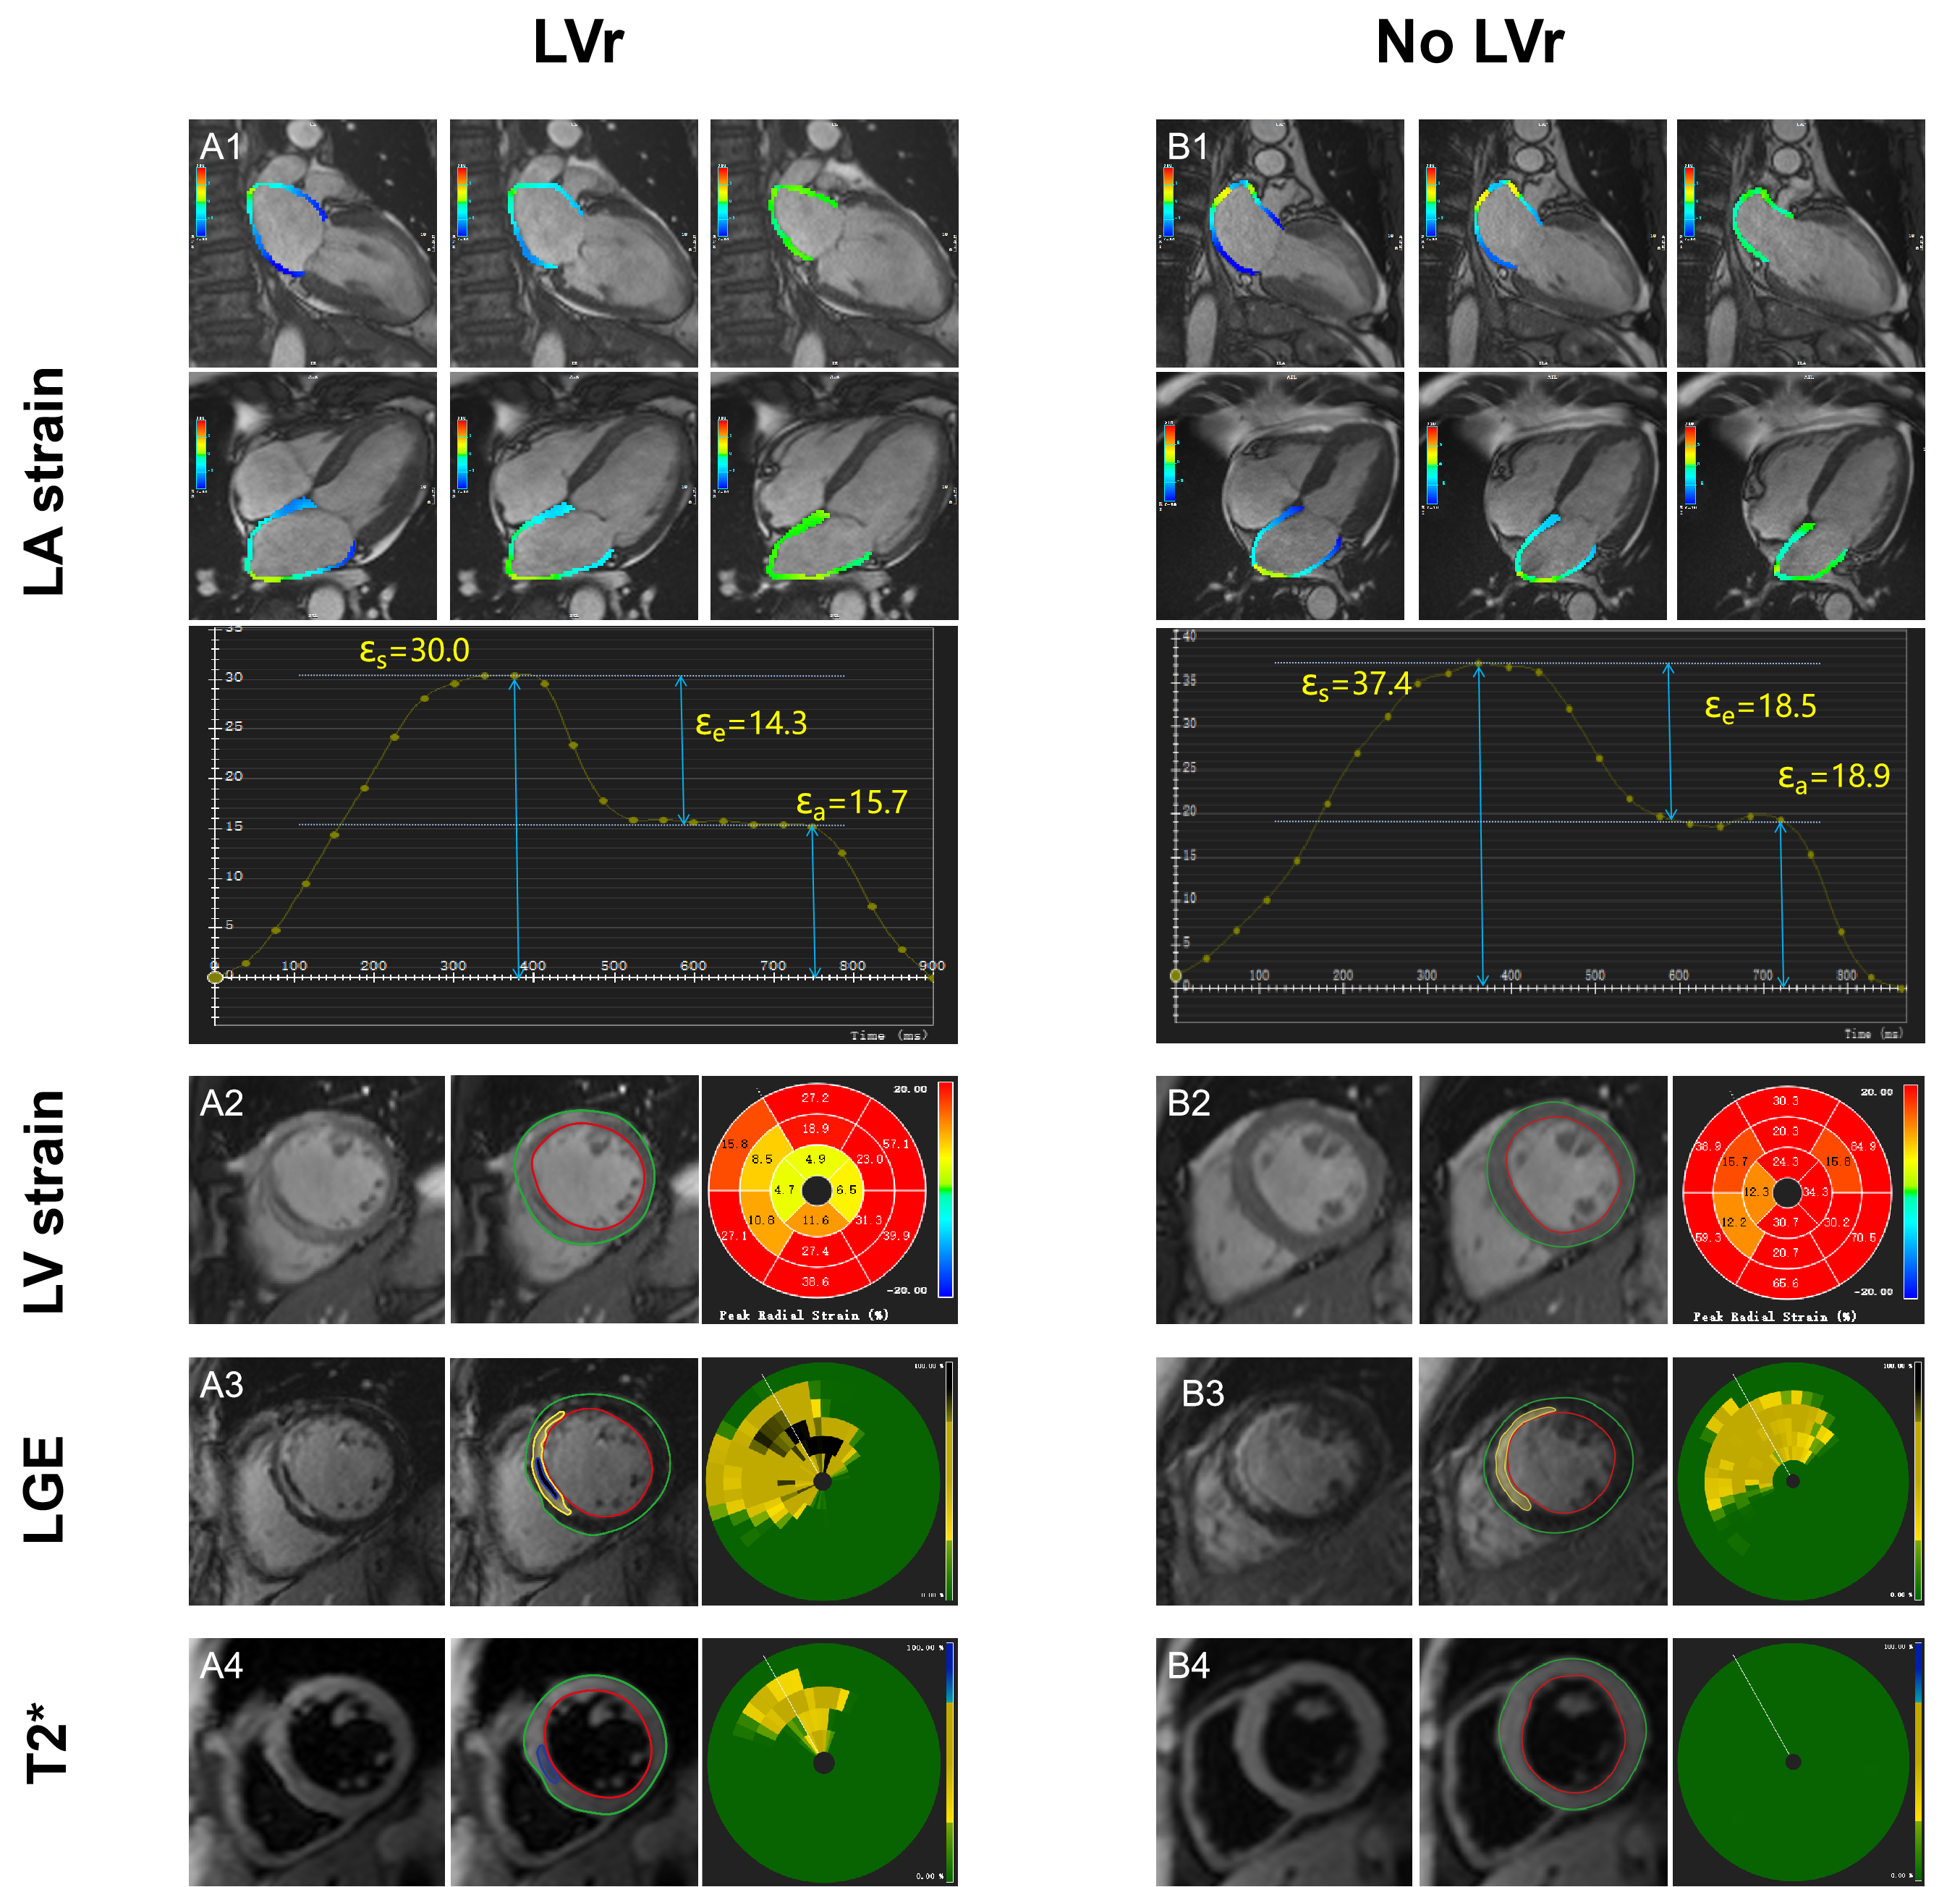
Patients with a first reperfused STEMI were investigated prospectively within 7 days after percutaneous coronary intervention. CMR studies were performed on a 3.0T scanner (MAGNETOM Verio, Siemens Healthcare), where cardiac cine, T2* mapping and LGE covering the entire heart were acquired 7 days and 6 months post PCI (Fig. 1). In short, balanced steady-state free precession (bSSFP) cine images were acquired with ECG gated in the LV long-axis slices (2-,3- and 4-chamber views) and short-axis slices covering the entire left ventricle from base to the apex. Phase sensitive inversion recovery (PSIR) was obtained after 8 to 10 minutes of gadolinium-diethylenetriamine penta-acetic acid (Gd-DTPA [0.2 mmol/kg, Gadovist, Bayer Healthcare]) injection.All statistical analyses were performed using SPSS version 25.0 (IBM). Continuous data were expressed as mean ± SD or median and interquartile range (IQR) as appropriate, and categorical variables were presented as frequencies and percentages. Continuous variables were assessed by independent sample Student t-test and Mann-Whitney U test, as appropriate. To determine whether the strain marker was an independent predictor of LVr, we sequentially constructed three multivariate logistic models. The likelihood ratio test (LRT) was used to compare the model fit of the above models.
Results
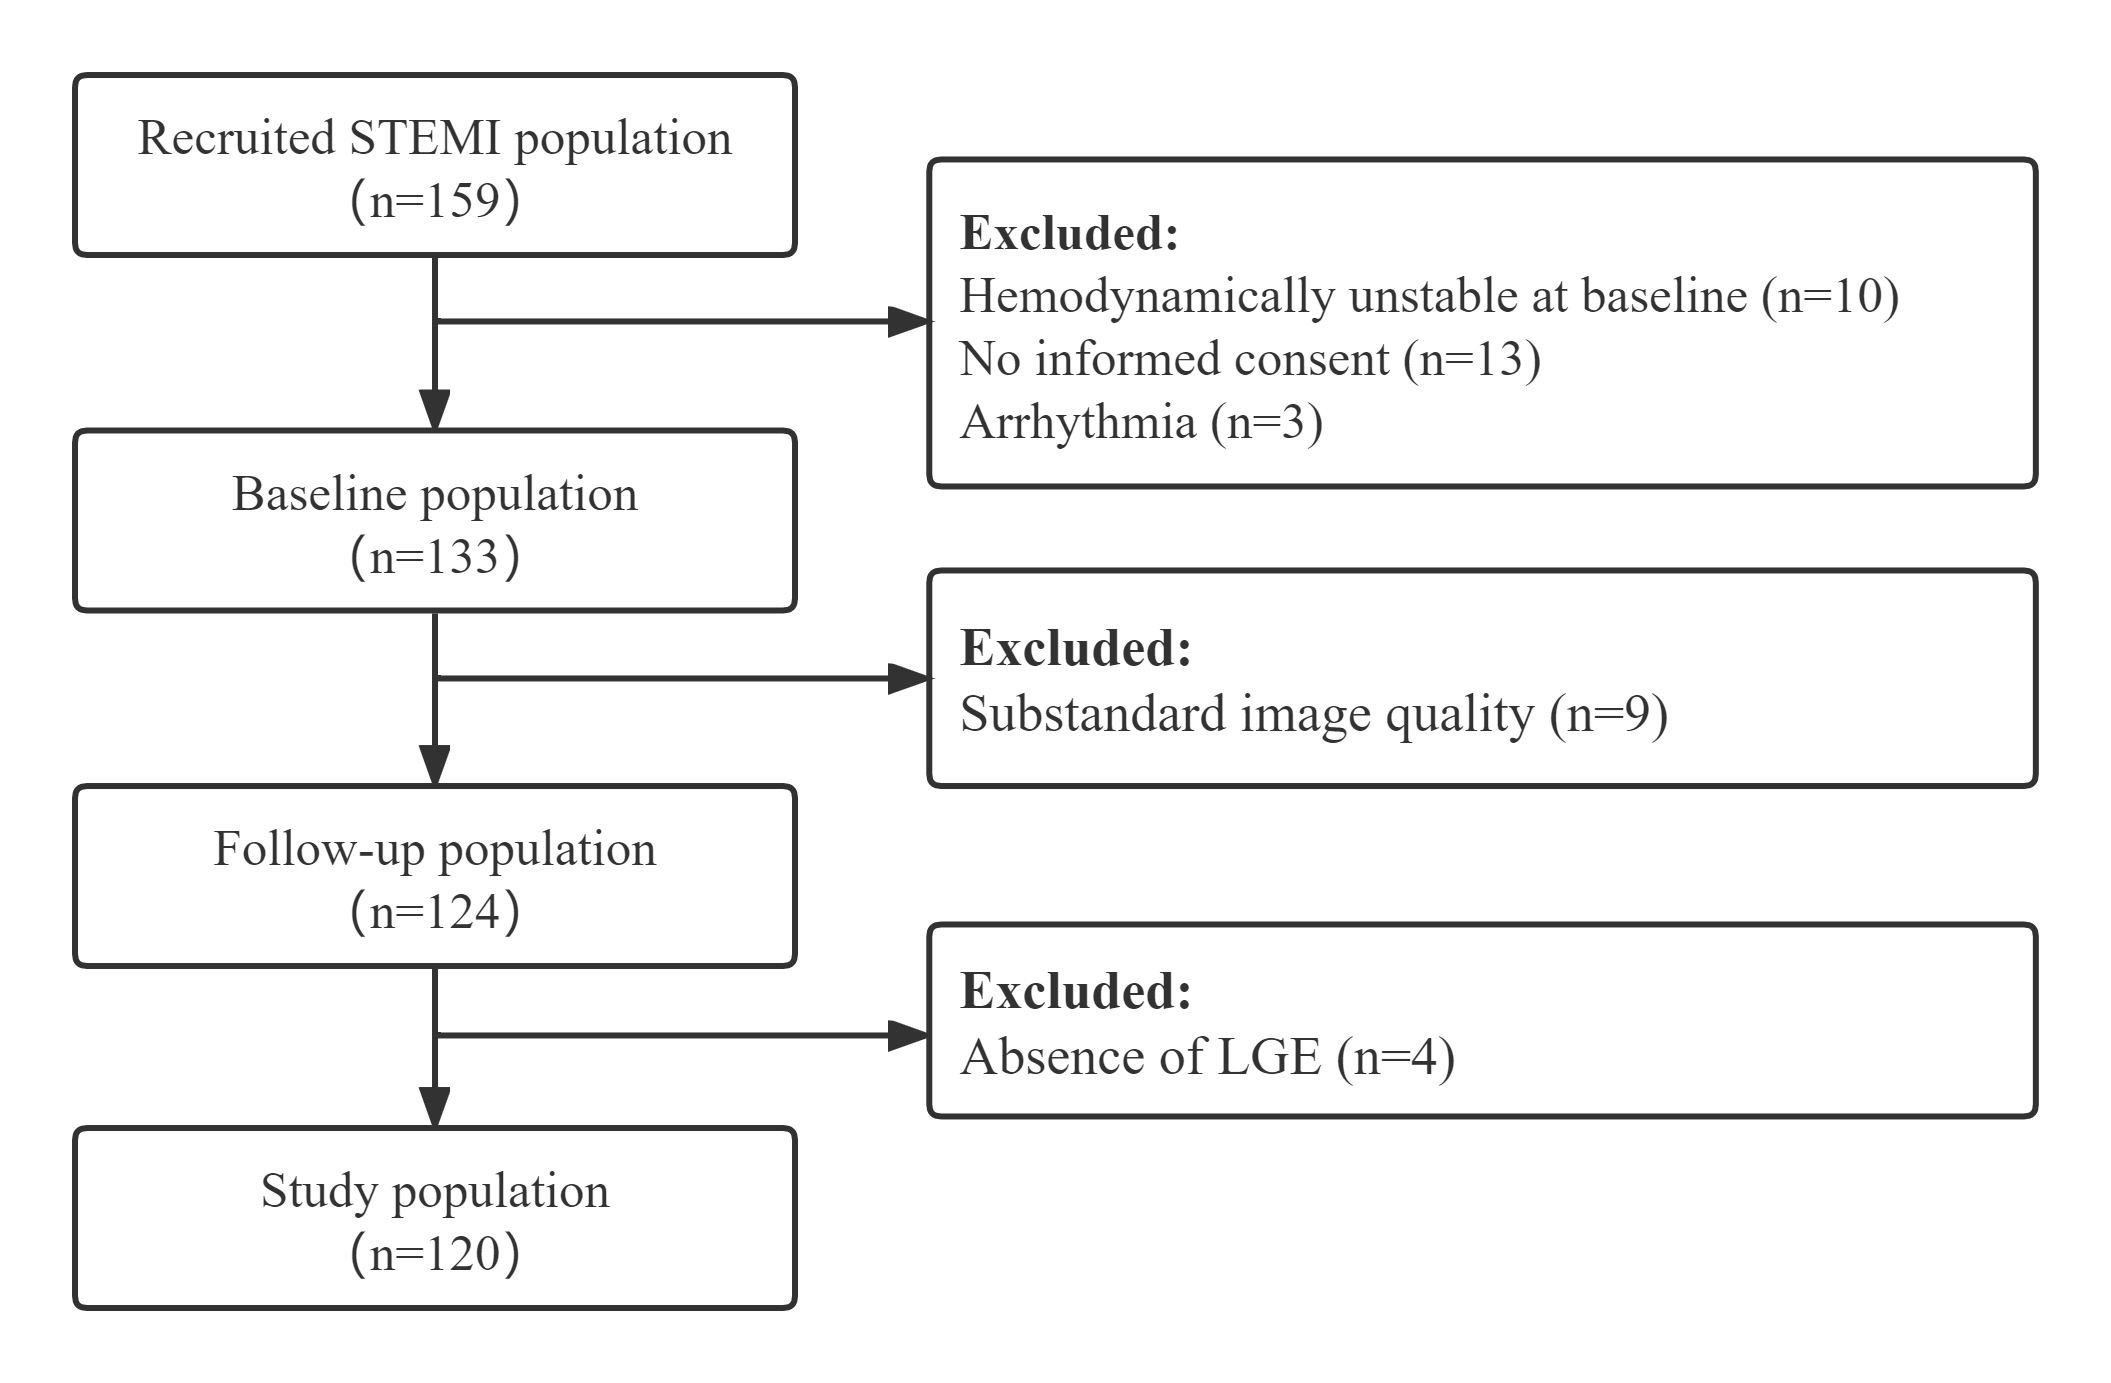
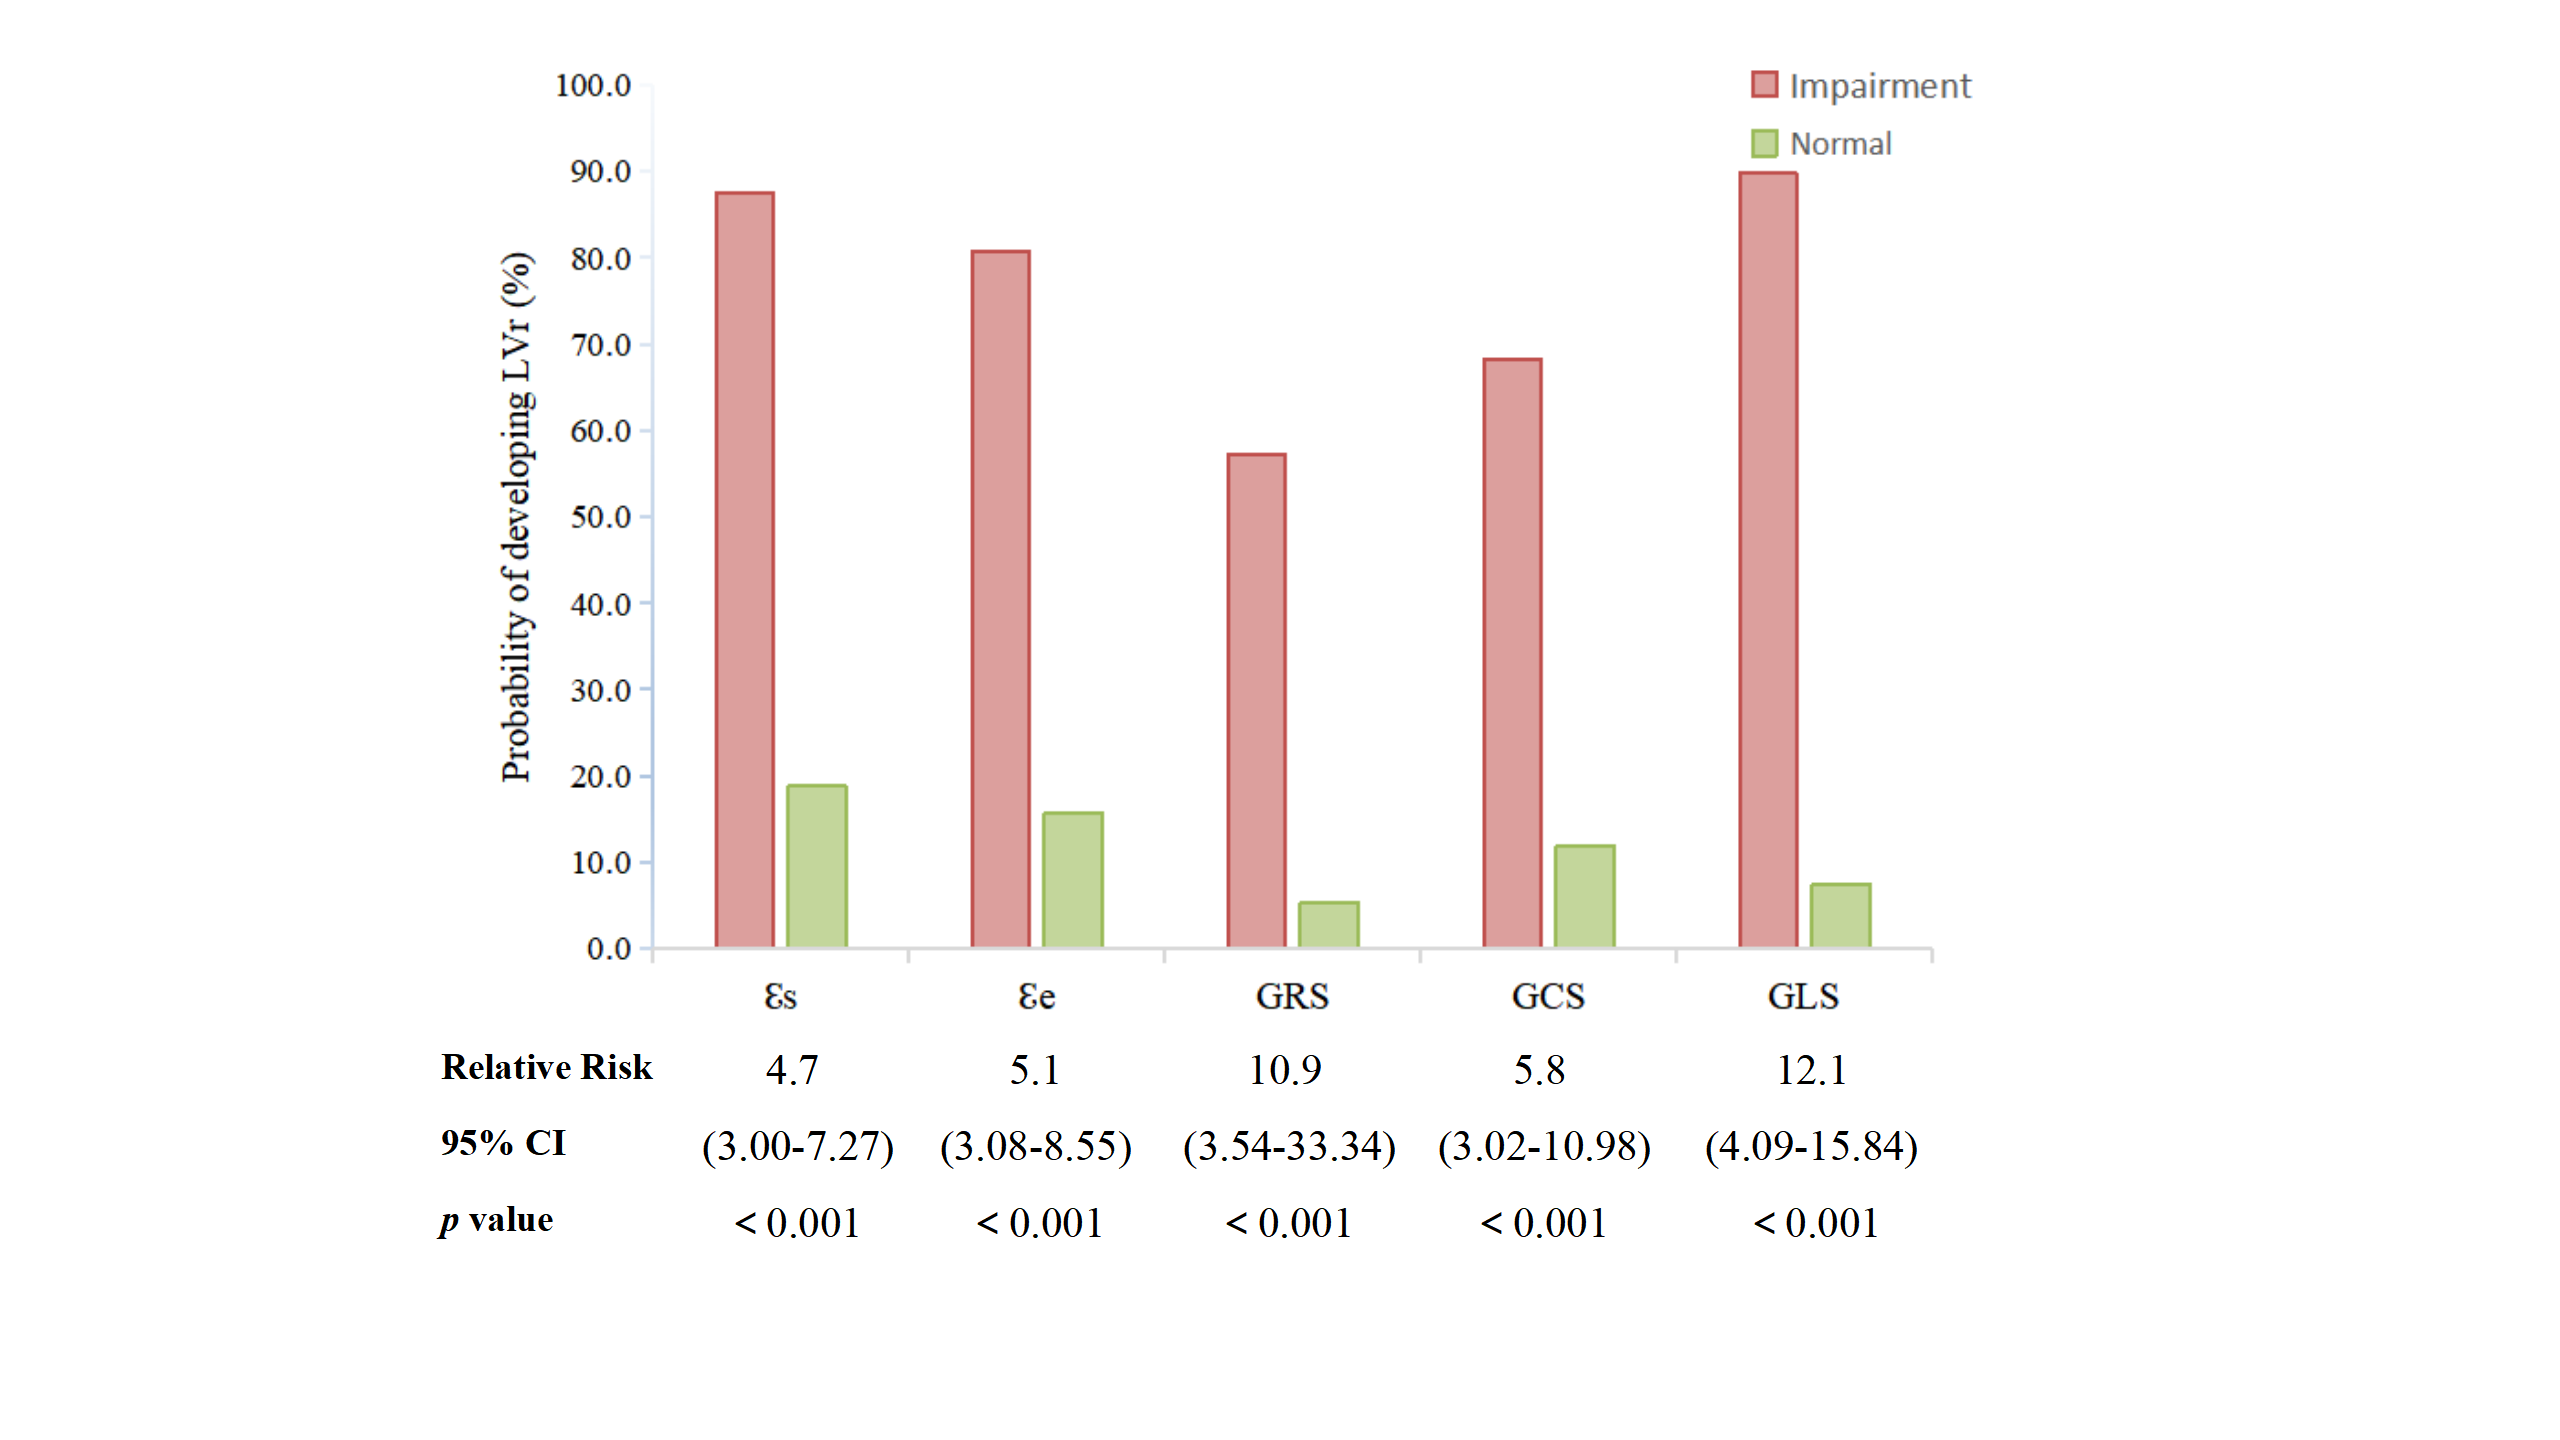
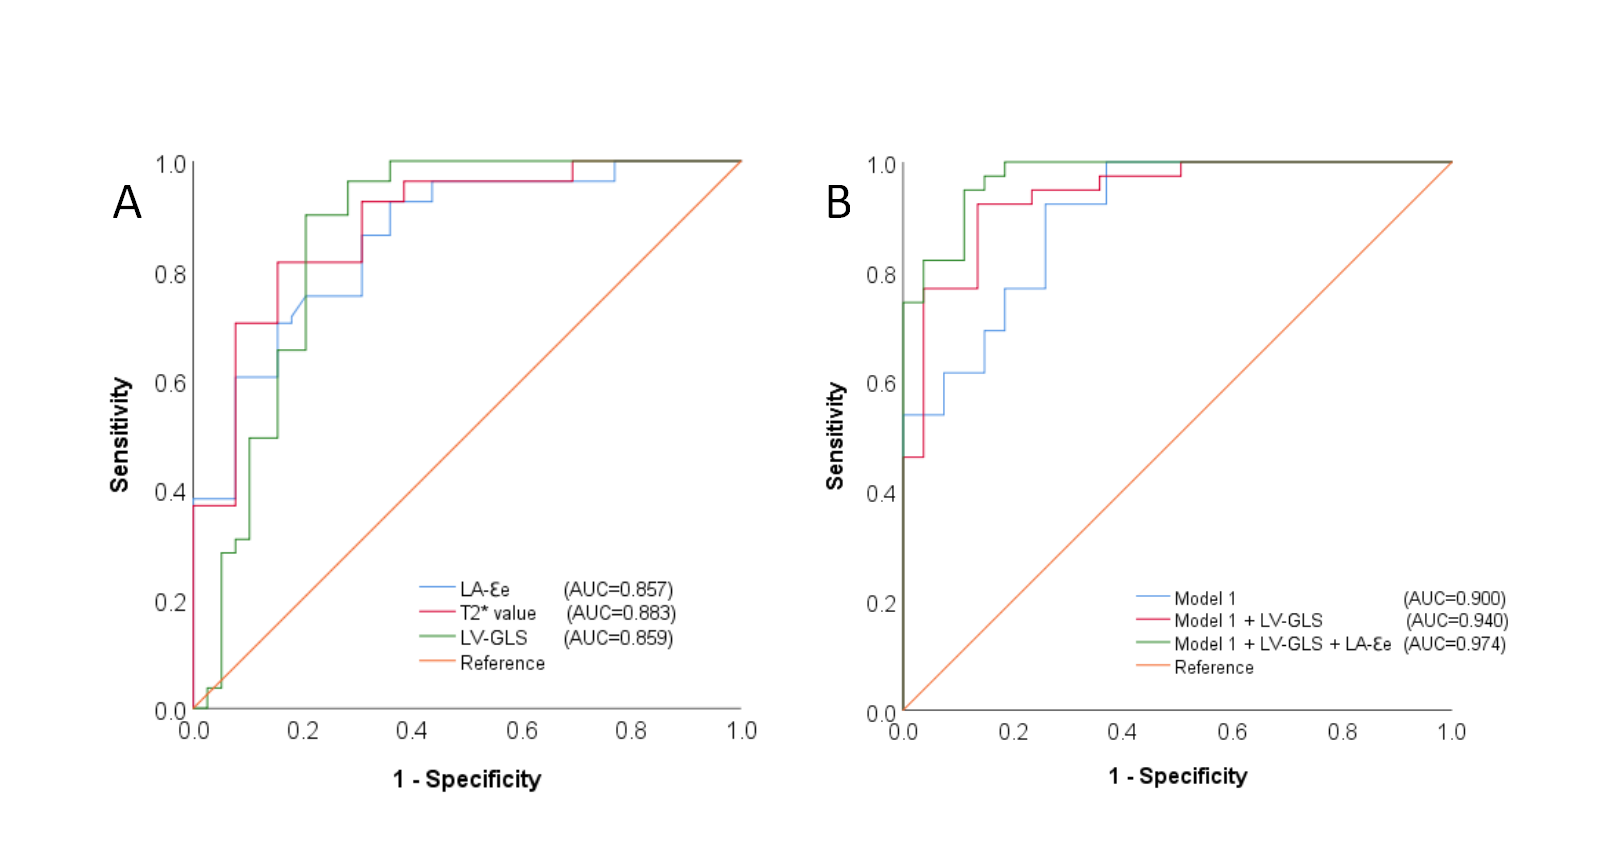
Following the inclusion criteria (Fig. 2), 120 STEMI patients (mean age 55 years, range 35-67 years; 74.2% men) of early enrolled 159 participants comprised the study population. Of all the patients, 39 out of 120 (32.5%) developed adverse LVr at 6 months' follow-up. LA conduit strain (ℇe) <10.5% was more frequent in patients developing LVr and remained a significant predictor of LVr (odds ratio [OR]=0.60, 95% CI 0.41-0.86; p=0.006) after adjustment for LV global longitudinal strain (GLS) > -11.1% (OR=2.43, 95% CI 1.44-4.15; p=0.001), clinical and known CMR predictors (peak cTnT, BMI, T2* value, IMH volume, infarct size and MVO volume) (Fig. 3). The impairment of LA-ℇe and LV-GLS to the model further improved the prediction of LVr (Model 3: areas under the ROC curve (AUC)=0.974, Model 2: AUC=0.940, vs. Model 1: AUC=0.900, p<0.001) (Fig. 4).Discussion
The results of our study provide several new insights: (a) The reduction of absolute global strain parameters of both LV and LA in the acute phase after MI, especially LA-ℇe for conduit function and LV-GLS, and T2* value, IMH volume, infarct size, MVO in the region of infarction is associated with LVr at follow up. (b) LA reservoir and conduit dysfunction except for booster pump function is relevant to longer-term LVr. (c) The reduction of LV-GLS can predict LVr independent of T2* value, and the reduction of LA-ℇe remain an independent predictor of LVr after adjusting LV-GLS and T2* value. (d) The multivariable logistics regression models containing MRI strain markers further improve the prediction of LVr.Conclusion
In patients with STEMI, the reduction of LA conduit strain derived by CMR-FT increased the likelihood of LVr independent of T2* value and LV-GLS.Acknowledgements
No acknowledgement found.References
1. Ibanez B, James S, Agewall S et al (2018) 2017 ESC Guidelines for the management of acute myocardial infarction in patients presenting with ST-segment elevation: The Task Force for the management of acute myocardial infarction in patients presenting with ST-segment elevation of the European Society of Cardiology (ESC). European heart journal 39:119-177.
2. van der Bijl P, Abou R, Goedemans L et al (2020) Left Ventricular Post-Infarct Remodeling: Implications for Systolic Function Improvement and Outcomes in the Modern Era. JACC Heart failure 8:131-140.
3. Genet M, Chuan Lee L, Ge L et al (2015) A Novel Method for Quantifying Smooth Regional Variations in Myocardial Contractility Within an Infarcted Human Left Ventricle Based on Delay-Enhanced Magnetic Resonance Imaging. Journal of biomechanical engineering 137:081009.
4. Huttin O, Lemarié J, Di Meglio M et al (2015) Assessment of right ventricular functional recovery after acute myocardial infarction by 2D speckle-tracking echocardiography. The international journal of cardiovascular imaging 31:537-45.
5. Eitel I, Stiermaier T, Lange T et al (2018) Cardiac Magnetic Resonance Myocardial Feature Tracking for Optimized Prediction of Cardiovascular Events Following Myocardial Infarction. JACC Cardiovascular imaging 11:1433-1444.
6. Kim J, Yum B, Palumbo MC et al (2020) Left Atrial Strain Impairment Precedes Geometric Remodeling as a Marker of Post-Myocardial Infarction Diastolic Dysfunction. JACC Cardiovascular imaging 13:2099-2113.
7. Leng S, Ge H, He J et al (2020) Long-term Prognostic Value of Cardiac MRI Left Atrial Strain in ST-Segment Elevation Myocardial Infarction. Radiology 296:299-309.
8. Backhaus SJ, Kowallick JT, Stiermaier T, et al (2020) Atrioventricular mechanical coupling and major adverse cardiac events in female patients following acute ST elevation myocardial infarction. Int J Cardiol. 299:31-36.
Figures