1653
MRI tagging and feature tracking detect increased myocardial strain in a mouse model of hypertrophic cardiomyopathy1Berlin Ultrahigh Field Facility (B.U.F.F.), Max Delbrueck Center for Molecular Medicine in the Helmholtz Association, Berlin, Germany, 2DZHK (German Centre for Cardiovascular Research), partner site Berlin, Berlin, Germany, 3Department of Experimental Pharmacology and Toxicology, University Medical Center Hamburg-Eppendorf, Hamburg, Germany, 4German Center for Cardiovascular Research, Partner Site Hamburg, Hamburg, Germany, 5Experimental and Clinical Research Center, Charite Medical Faculty and the Max Delbrueck Center for Molecular Medicine in the Helmholtz Association, Berlin, Germany
Synopsis
Keywords: Myocardium, Cardiomyopathy, Myocardial Strain; Hypertrophic cardiomyopathy(HCM); Mechanical function
Motivation: To identify potential imaging markers for early detection of hypertrophic cardiomyopathy (HCM) .
Goal(s): To evaluate mechanical dysfunction in HCM mice with different genotypes representing different disease stages.
Approach: Myocardial circumferential strain, radial strain, longitudinal strain, and torsion were assessed using two distinct strain assessment methods: feature tracking and tagging MRI.
Results: The results showed a significant reduction in myocardial strain in severe HCM, but an intriguing trend of slight elevation was observed before a decline in strain occurred in mild HCM, highlighting the potential value of these markers in the early detection of HCM.
Impact: Myocardial contractile function is significantly reduced in hypertrophic cardiomyopathy (HCM). However, our study suggests the presence of a compensatory phase during disease progression. Early identification of myocardial contraction dysfunction is vital for prompt detection and treatment, ultimately improving patient outcomes.
Introduction
In an effort to address the limitations of ejection fraction assessment in the left ventricles, there is a growing emphasis on measuring cardiac strain parameters [1]. Myocardial strain quantifies the deformation or change in shape of the myocardium throughout the cardiac cycle. Reduced myocardial strain may indicate impaired contractility, while increased strain can suggest improved contractile function [2-3]. This study employed two distinct strain assessment methods, feature tracking (FT) and tagging MRI (t-MRI), to assess mechanical dysfunction in a mouse model of hypertrophic cardiomyopathy (HCM).Methods
We utilized a cardiac myosin-binding protein C (cMyBP-C) knock-in mouse model carrying a point mutation [4]. The level of total cMyBP-C mRNA was reduced by 50% in heterozygotes (HET) representing early-phase HCM and by 80% in homozygotes (KI) representing severe HCM [5]. The wild-type C57BL/6 J (WT) served as a reference for the normal status. 44 mice (23 males and 21 females, age 9-47 weeks) underwent cine-CMR for functional assessment at 9.4 T. Left ventricular (LV) wall thickness was measured in end diastole. A series of retrospective gated cine images covering the heart from apex to base were subjected to analysis using feature-tracking (FT) (Segment Version 4.0). This allowed measurements of LV average circumferential strain, average radial strain and peak torsion. Additionally, a subset of younger mice (6 males and 12 females, age 9-21 weeks) underwent myocardial tagging CMR using spatial modulation of the magnetization (SPAMM) (TE/TR=1.6/15ms, FA=15°, FOV=25mmx25mm, matrix=128x128, thickness=0.2mm, cardiac frames=16). Tagged images were analysed for LV peak longitudinal strain and mean torsion.Results
The functional results revealed that LVEF in WT and HET was higher than in KI. For males, LVEF values were as follows: WT vs. HET vs. KI = 70.74% ± 6.39% vs. 69.15% ± 5.06% vs. 38.30% ± 5.73%. For females: WT vs. HET vs. KI = 69.40% ± 5.50% vs. 71.15% ± 3.45% vs. 40.92% ± 1.19%. Additionally, left ventricular thickness in males and females was greater in KI mice: For males, WT vs. HET vs. KI = 0.90 mm ± 0.11 mm vs. 0.95 mm ± 0.10 mm vs. 1.23 mm ± 0.09 mm, and for females: WT vs. HET vs. KI = 0.88 mm ± 0.06 mm vs. 0.83 mm ± 0.07 mm vs. 1.19 mm ± 0.11 mm. The findings from CMR feature-tracking (FT) and tagging CMR (t-MRI) closely mirrored the functional results. KI mice exhibited significantly lower average circumferential strain, average radial strain, peak longitudinal strain, and torsion compared to WT and HET mice (p < 0.05). Notably, among these parameters, HET mice showed slightly higher average circumferential strain, average radial strain, and torsion than WT mice.Discussion
Tagging CMR revealed a noteworthy trend of significantly elevated myocardial strain, possibly indicating a compensatory response before a decline in strain occurs. In our future research, we plan to broaden the scope by increasing the sample size and including different age groups. Additionally, we aim to further subdivide the strain analysis into various segments of the left ventricle and right ventricle. These efforts will facilitate the identification of potential imaging markers for mechanical dysfunction of the heart.Conclusion
Our study has provided initial insights into left ventricular mechanical dysfunction characteristics associated with hypertrophic cardiomyopathy using both feature tracking and tagging MRI. Notably, tagging CMR may detect subtle changes.Acknowledgements
This work was supported by the German Research Foundation, KU 3722/4-1 (Gefördert durch die Deutsche Forschungsgemeinschaft [DFG], KU 3722/4-1).References
[1]. Vigneault DM, Yang E, Jensen PJ, Tee MW, Farhad H, Chu L, Noble JA, Day SM, Colan SD, Russell MW, Towbin J, Sherrid MV, Canter CE, Shi L, Ho CY, Bluemke DA. Left Ventricular Strain Is Abnormal in Preclinical and Overt Hypertrophic Cardiomyopathy: Cardiac MR Feature Tracking. Radiology. 2019 Mar;290(3):640-648.
[2]. Yang W, Xu J, Zhu L, Zhang Q, Wang Y, Zhao S, Lu M. Myocardial Strain Measurements Derived From MR Feature-Tracking: Influence of Sex, Age, Field Strength, and Vendor. JACC Cardiovasc Imaging. 2023 Jul 7:S1936-878X(23)00276-0.
[3]. Mearini G, Stimpel D, Geertz B, Weinberger F, Krämer E, Schlossarek S, Mourot-Filiatre J, Stoehr A, Dutsch A, Wijnker PJ, Braren I, Katus HA, Müller OJ, Voit T, Eschenhagen T, Carrier L. Mybpc3 gene therapy for neonatal cardiomyopathy enables long-term disease prevention in mice. Nat Commun. 2014 Dec 2;5:5515.
[4]. Rakowski H, Carasso S. Quantifying diastolic function in hypertrophic cardiomyopathy: the ongoing search for the holy grail. Circulation. 2007 Dec 4;116(23):2662-5.
[5]. Vignier N, Schlossarek S, Fraysse B, Mearini G, Krämer E, Pointu H, Mougenot N, Guiard J, Reimer R, Hohenberg H, Schwartz K, Vernet M, Eschenhagen T, Carrier L. Nonsense-mediated mRNA decay and ubiquitin-proteasome system regulate cardiac myosin-binding protein C mutant levels in cardiomyopathic mice. Circ Res. 2009 Jul 31;105(3):239-48.
Figures
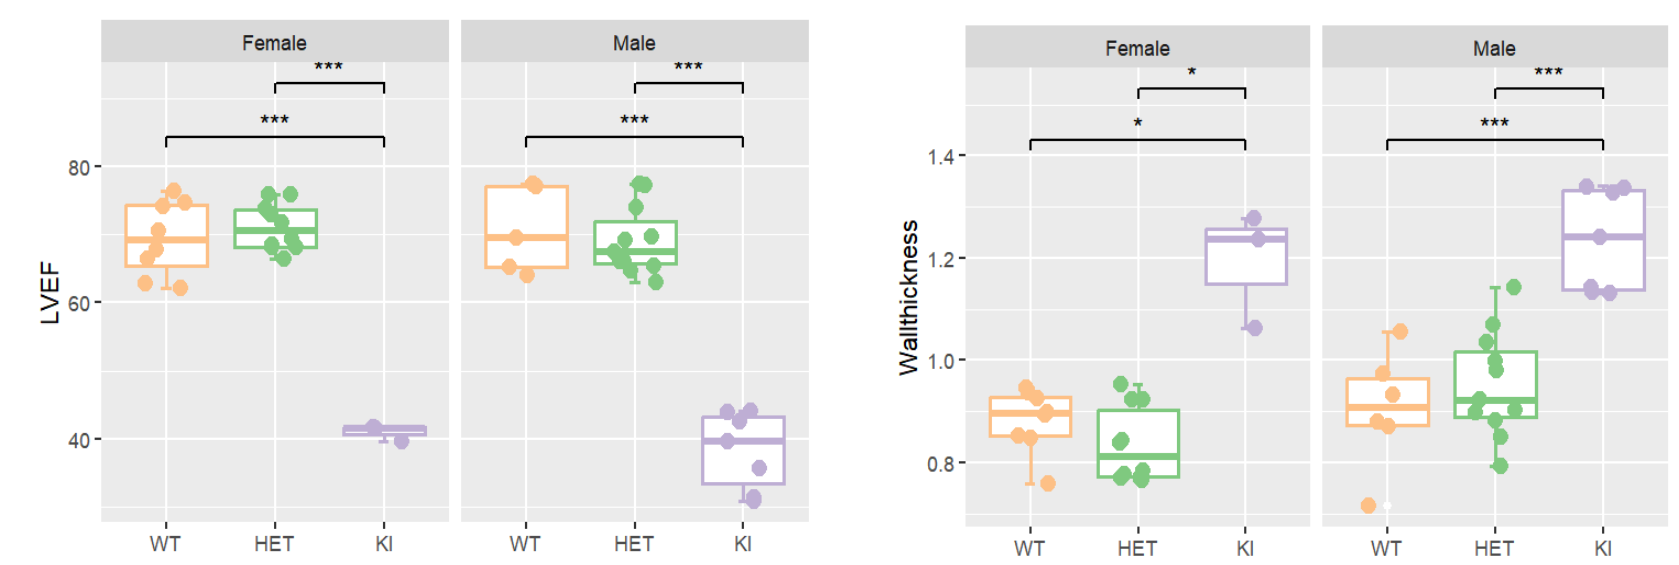
Fig1. Cine-CMR for LV function analysis across mice with different genotypes and genders. The endo- and epicardial borders were manually segmented in both end-systole and end-diastole using a stack of short-axis FLASH cine images in both female (n=21) and male (n=23) mice. Functional assessments, including LVEF and LV thickness (data presented as mean ± SD), were conducted on a slice-by-slice basis. Significance levels are indicated as *p < 0.05 and ***p < 0.01, determined using one-way ANOVA with Tukey’s multiple-comparisons test.
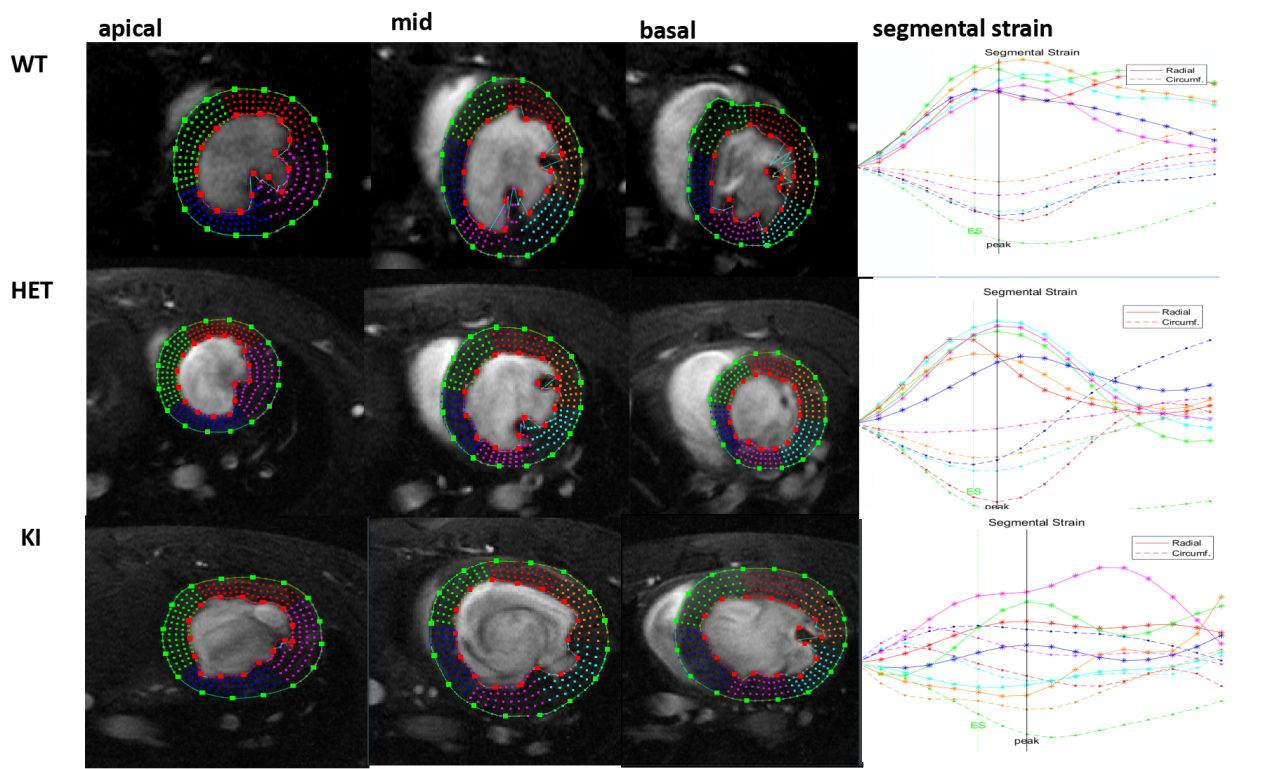
Fig2A. Feature tracking (FT) demonstrated variations in myocardial strain among mice with different genotypes and genders. 2A shows representative apical, mid, basal image and segmental strain of different genotype. The endo- and epicardial borders were manually segmented in end-diastole using apical, mid, and basal FLASH cine images.
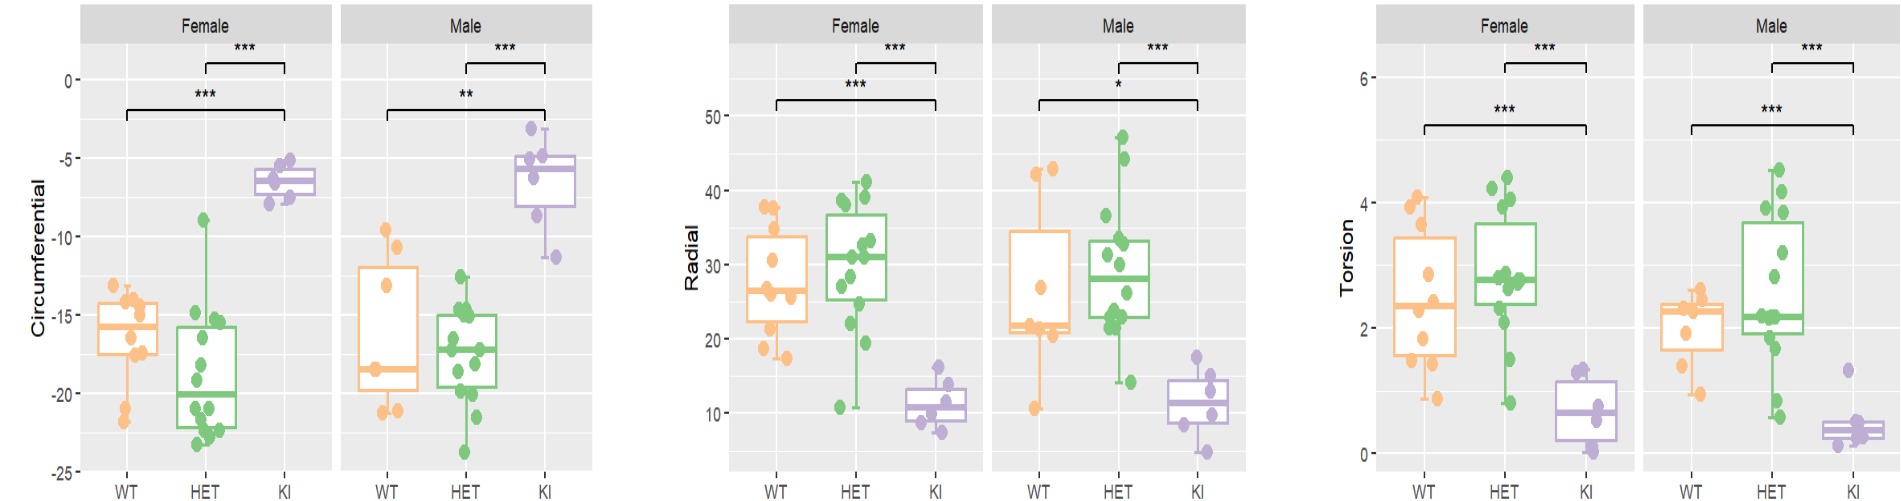
Fig2B. Feature tracking (FT) demonstrated variations in myocardial strain among mice with different genotypes and genders. Strain assessments, including average circumferential strain, average radial strain and peak torsion (data presented as mean ± SD), were conducted on a series of short-axis FLASH cine images covering the heart from apex to base. Significance levels are indicated as *p < 0.05 and ***p < 0.01, determined using one-way ANOVA with Tukey’s multiple-comparisons test.
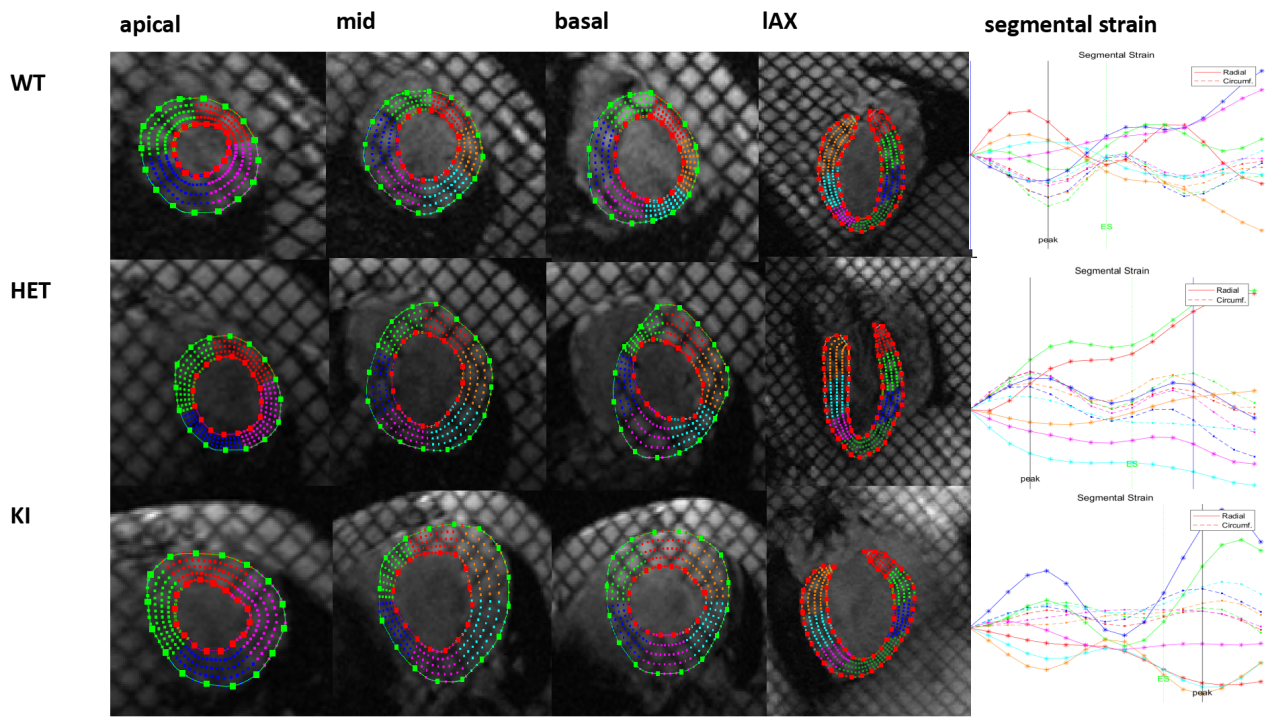
Fig3A. Tagging MRI (t-MRI) uncovered variations in strain among mice with different genotypes and genders. 3A shows representative apical, mid, basal, lax tagging image and segmental strain of different genotype. In end-diastole, endo- and epicardial borders were manually segmented using apical, mid, basal and long-axis FLASH cine images.
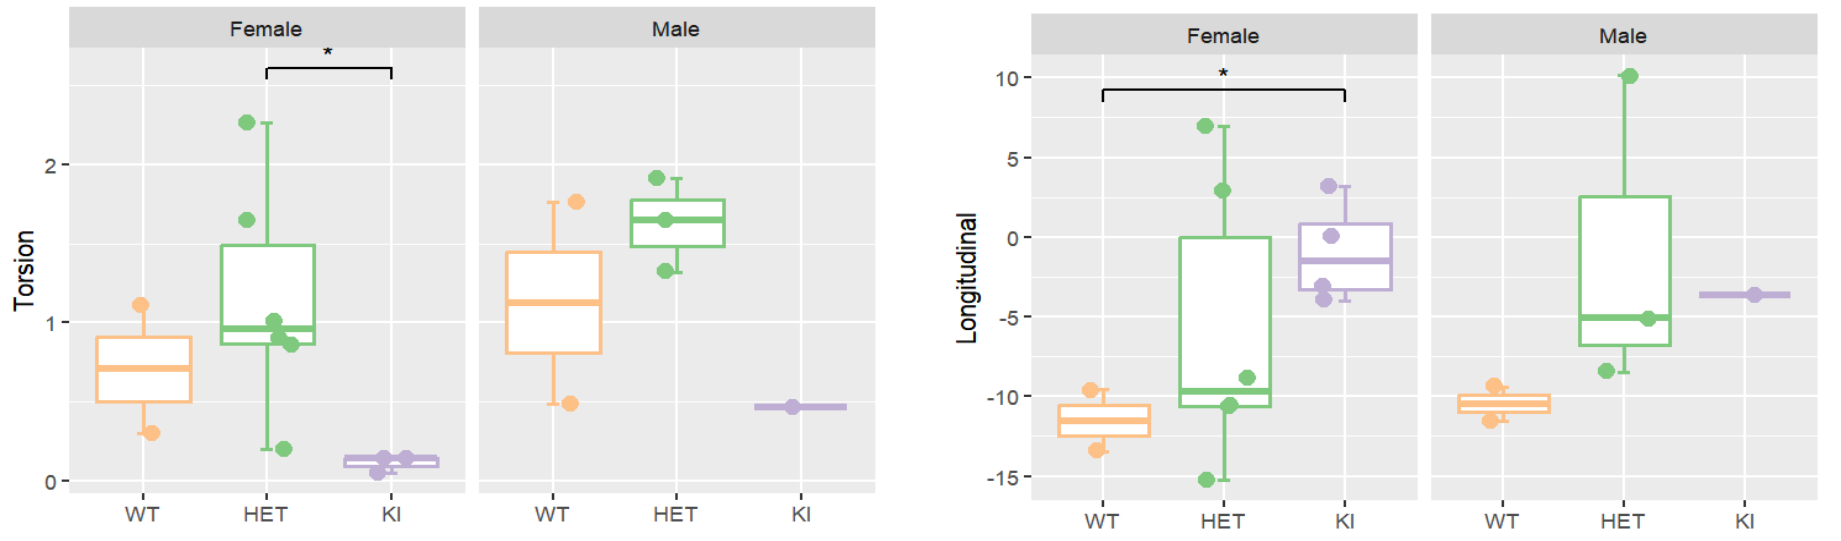
Fig3B. Tagging MRI (t-MRI) uncovered variations in strain among mice with different genotypes and genders. Strain assessments, including mean torsion and peak longitudinal strain (data presented as mean ± SD), were conducted on a series of short-axis FLASH cine images covering the heart from apex to base. Significance levels are indicated as *p < 0.05, determined using one-way ANOVA with Tukey’s multiple-comparisons test.