1645
12-Lead ECG Assessment at 0.55T1Cardiovascular Branch, Division of Intramural Research, National Heart, Lung, and Blood Institute, National Institutes of Health, Bethesda, MD, United States, 2Division of Cardiology, Department of Medicine, Johns Hopkins University School of Medicine, Baltimore, MD, United States, 3Department of Radiology, Case Western Reserve University and University Hospitals Cleveland Medical Center, Cleveland, OH, United States
Synopsis
Keywords: Arrhythmia, MR-Guided Interventions, Arrhythmia, Low-field MRI
Motivation: The 12-lead ECG is the standard diagnostic for monitoring rhythm and ischemia during stress. ECG distortion via magnetohydrodynamic effect is proportional to field strength and limits interpretation at 1.5T and 3T. Lower field (0.55T) offers potential improvement.
Goal(s): Compare variability in ECGs in at 0.55T, 1.5T and 3.0T and examine changes in ECG morphology at 0.55T in response to ischemia and exercise stress.
Approach: ECGs were recorded in: (1) swine at three fields, and at 0.55T during ischemia, and (2) normal human subjects a and during ergometer stress.
Results: At 0.55T ECGs remained interpretable at isocenter though some distortion due to MHD persisted.
Impact: Low field (0.55T) MRI can provide improved clinical interpretation of 12-Lead ECGs at isocenter due to reduction of magnetohydrodynamic distortion and reduced sensitivity to patient motion as demonstrated in swine with cardiac ischemia and humans undergoing exercise induced stress.
Introduction
The 12-lead electrocardiogram (ECG) is a standard diagnostic tool for monitoring cardiac ischemia and heart rhythm during stress testing and cardiac interventional procedures. There is interest in performing these procedures within MRI to incorporate information such as myocardial perfusion, blood flow, and ablation lesion characterization.1-3 However, the strong magnetic field leads to ECG distortion via magnetohydrodynamic effect (MHD), limiting interpretation.4,5 The MHD voltage, induced by blood flowing perpendicular to the static field, is superimposed on the surface ECG and at standard clinical field strengths (1.5T and higher) can obscure the ST segment, limiting critical ECG-based assessment of ischemia.6,7ECG distortion is known to decrease with decreasing field strength. This study characterizes the advantages and limitations of ECG interpretation at 0.55T.
Methods
Animal and human protocols were reviewed and approved by the local IACUC and IRB. 2-minute recordings were acquired using a prototype MR-compatible 12-lead ECG system (PELEX-MAX, PinMed).To assess differences in 12-lead ECG distortion at 0.55T compared to higher field strength, recordings were obtained from N=7 swine at 0.55T, 1.5T, and 3T at 3 positions: isocenter, scanner “Home” position in the fringe field, and outside the scanner room, in a single session without changes to lead positions. ECGs were also recorded at 0.55T in N=5 normal human subjects.
ECG error and variance were assessed for features relevant to clinical interpretation: PR and QRS interval, J point (at the end of the QRS interval), and ST segment, using T-tests with Bonferroni correction.To assess interpretation of ST segment changes during ischemia, recordings were made at 0.55T before and after balloon coronary occlusion in N=7 swine.
To assess interpretation of ST segment ECG changes during stress, recordings were made at 0.55T before and after ergometer-driven exercise stress in N=5 human subjects.
Results
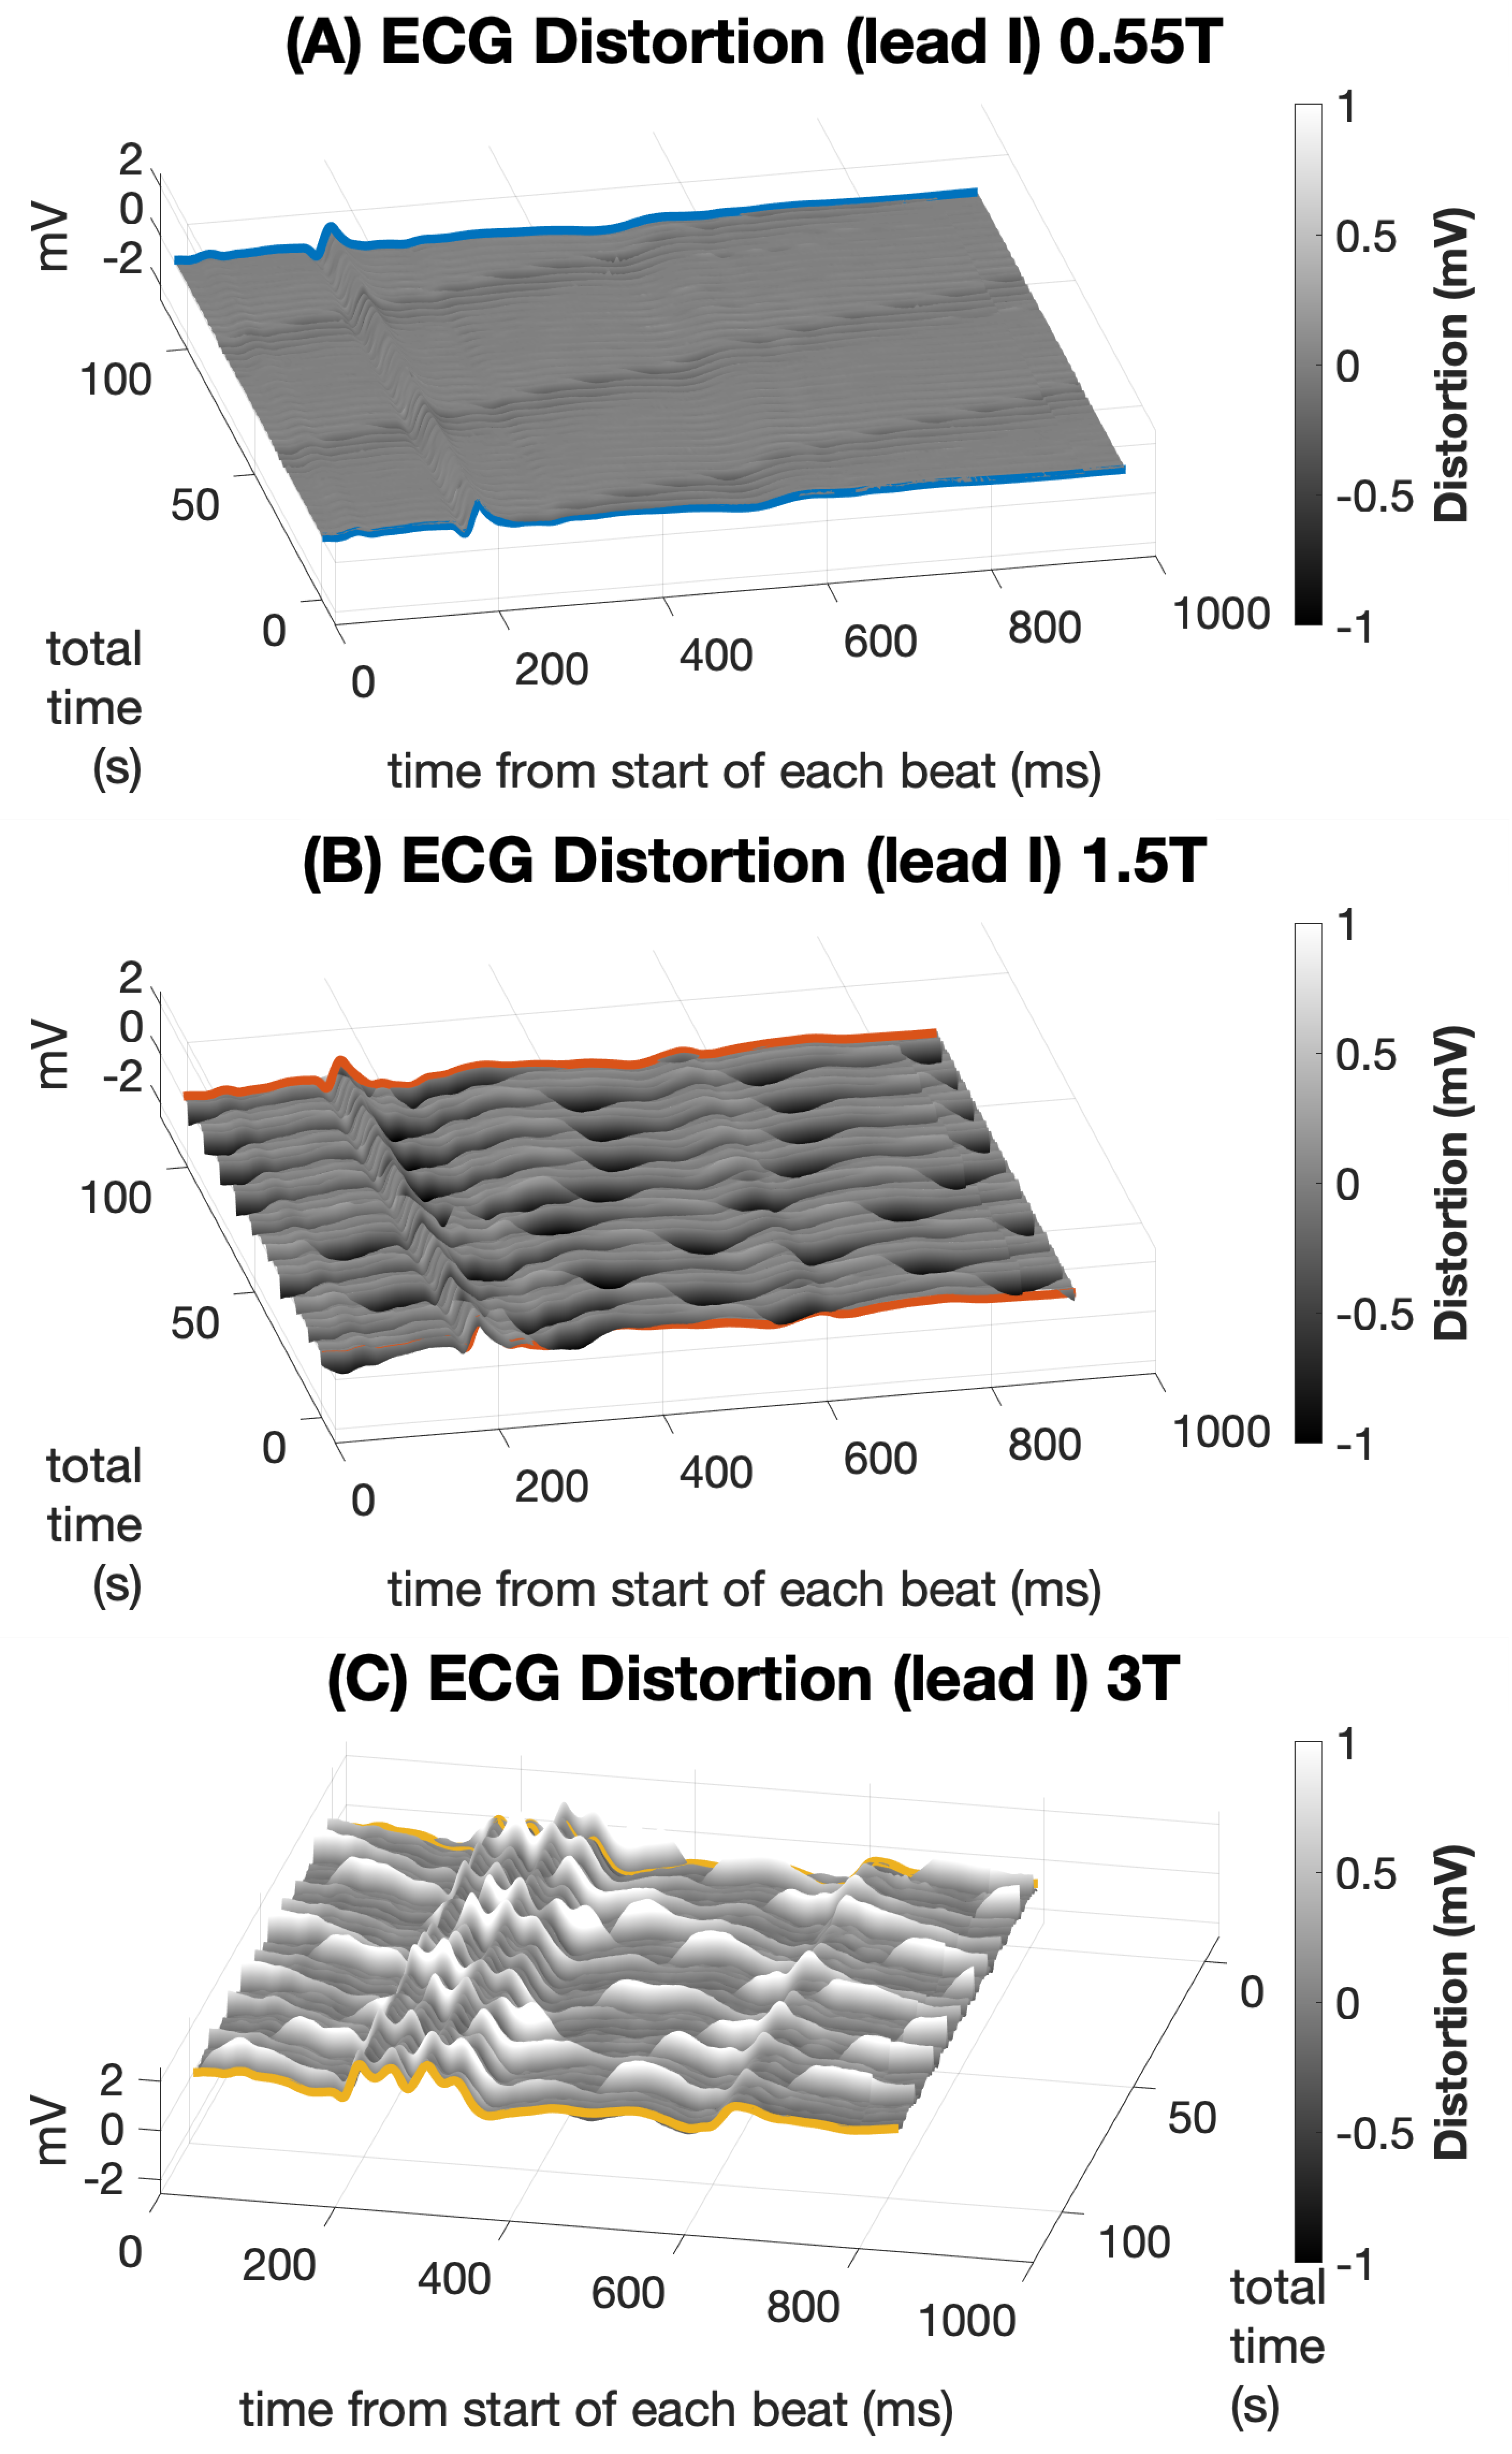
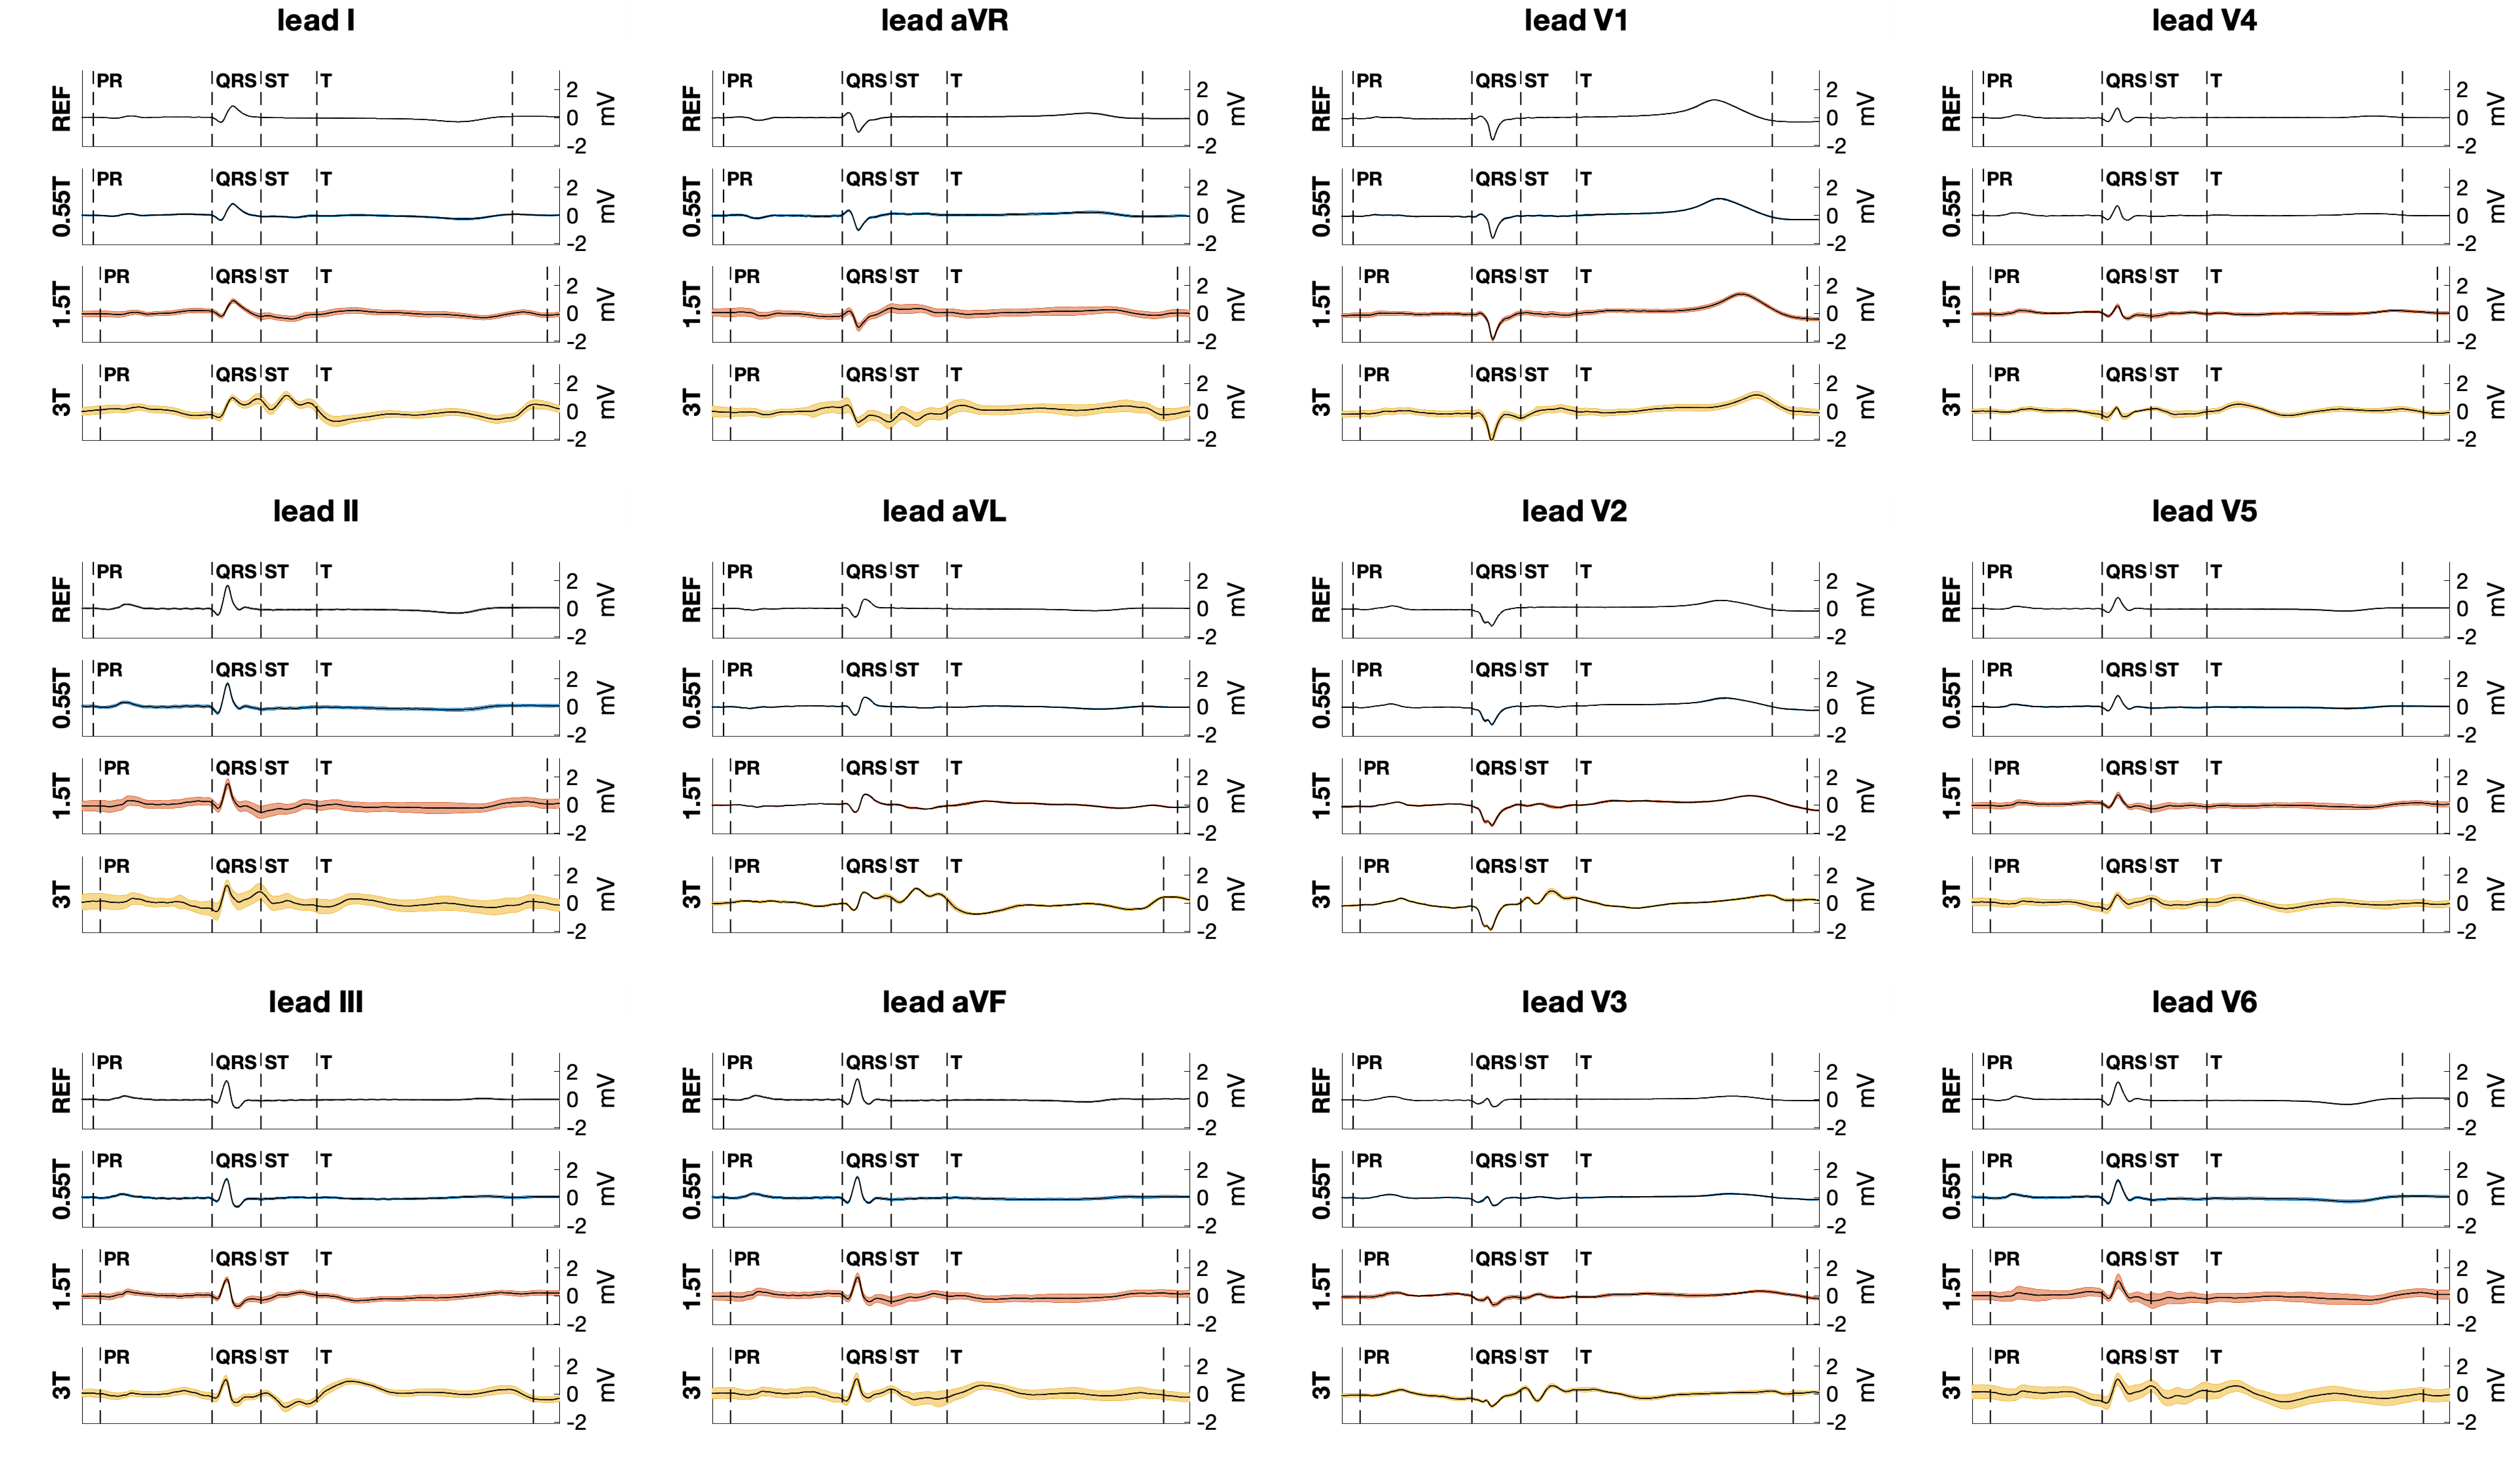
Figure 1 displays recordings in one swine acquired at 3 field strengths. The color scale demonstrates the individual beat difference relative to the average and indicates that variance appears dominated by respiratory motion and lower at 0.55T compared to higher fields.Figure 2 compares ECG recordings acquired at isocenter at 3 fields strengths relative to the reference (outside). ECG distortion increased with field strength. The traces acquired at 0.55T match the reference closely in morphology and variance.
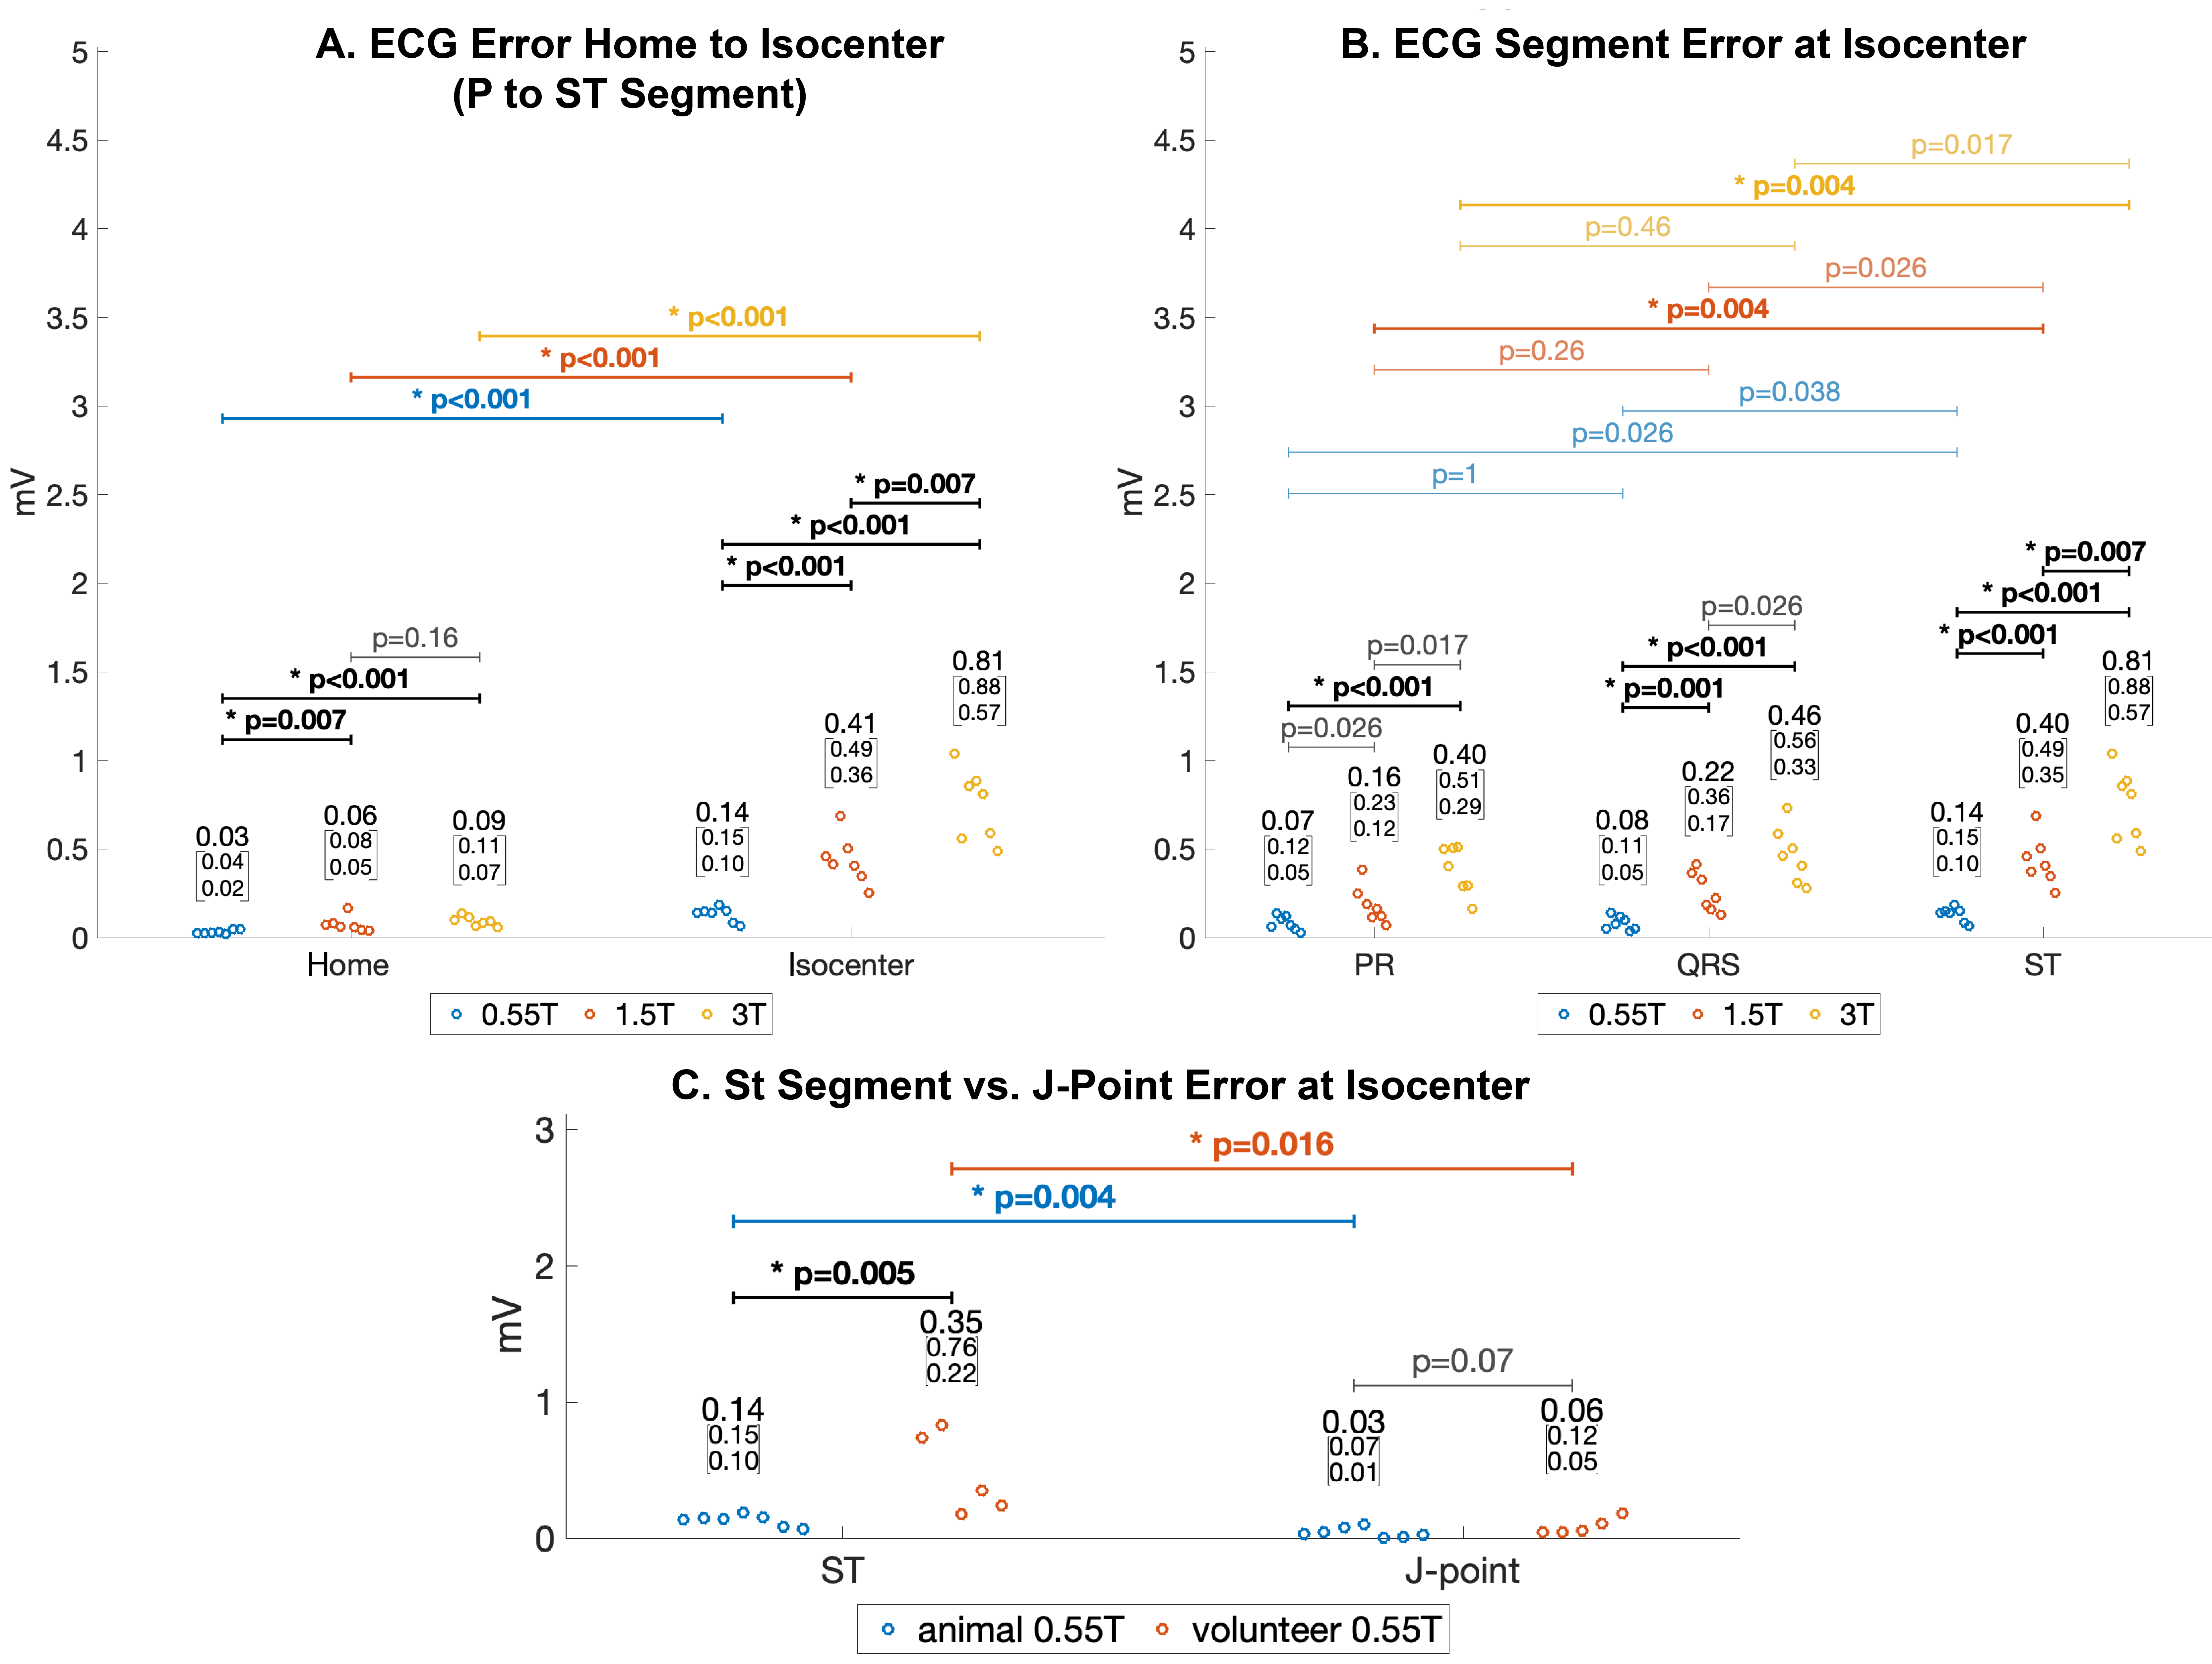
Figure 3 quantifies errors across field strengths and subjects at (A) Home and isocenter relative to the outside reference, and (B) for different ECG segments at isocenter. (C) Shows ST segment error at 0.55T isocenter was higher in human subjects than animals. However, error in the J-point, a primary measure used to detect ischemia, was similar in human subjects and animals.
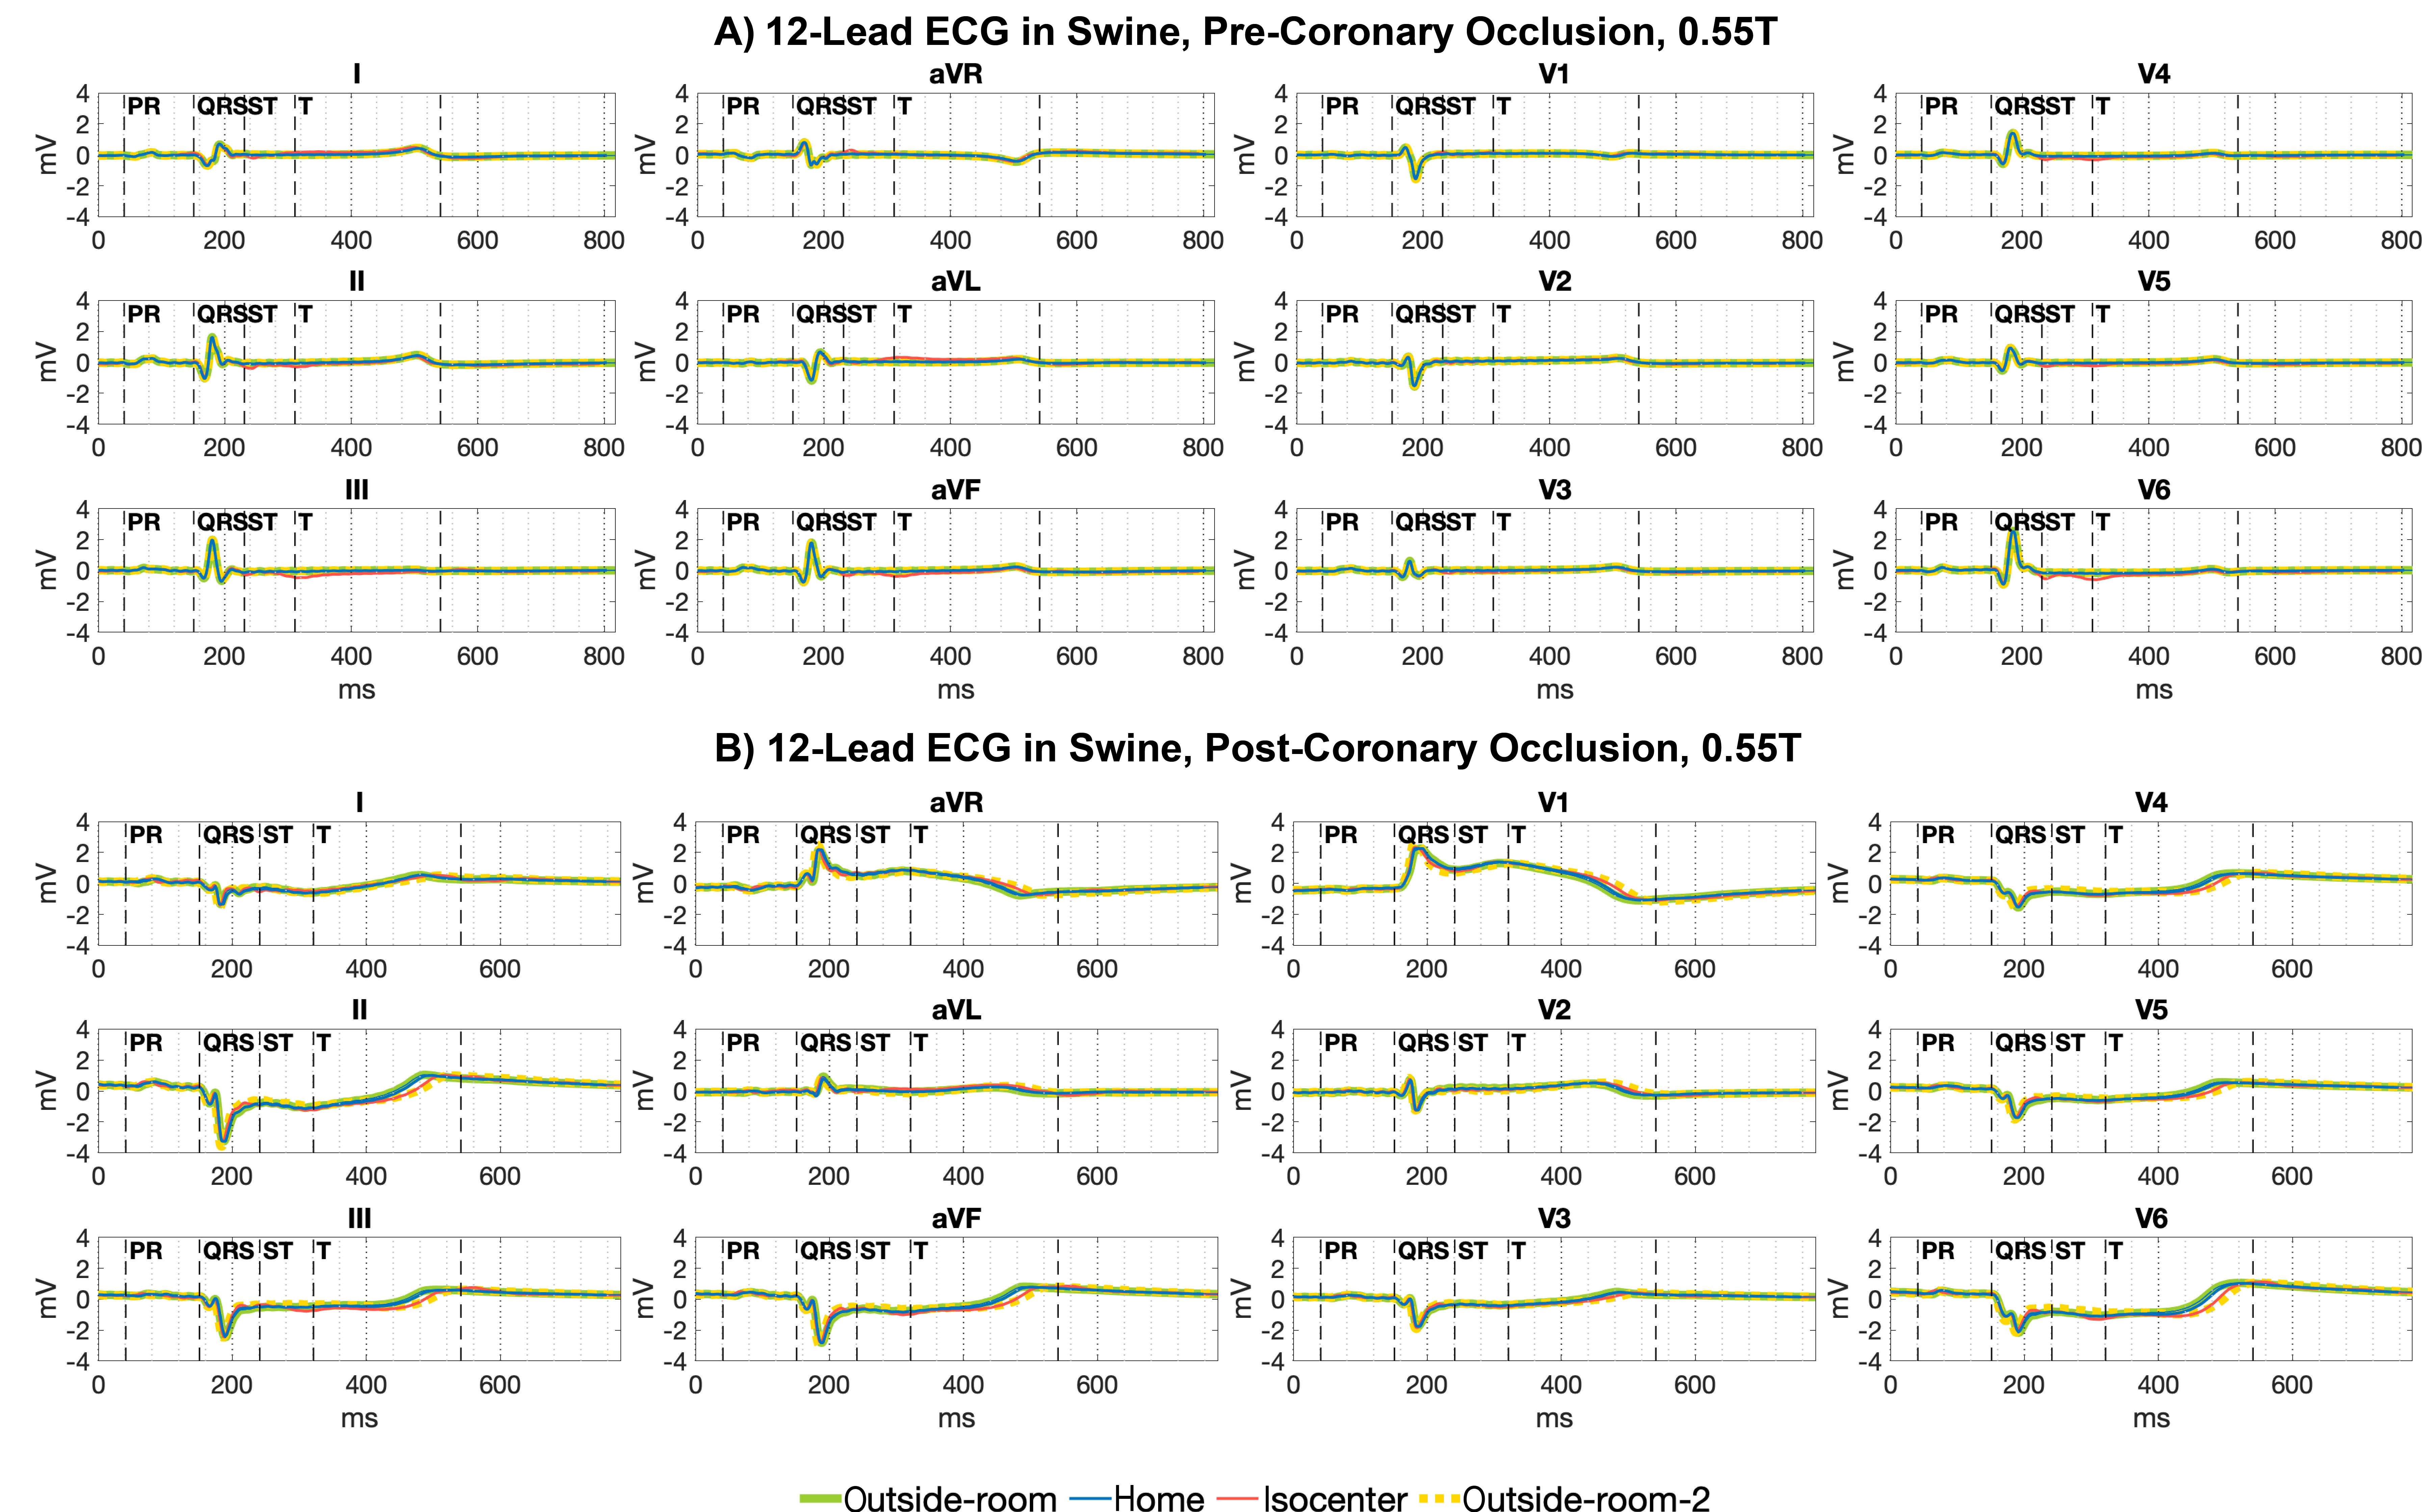
Figure 4 compares ECGs obtained at 0.55T in a swine before and after coronary occlusion induced ischemia. Though subtle ST segment distortion is seen at isocenter before occlusion, gross ST segment changes are clearly noted at 0.55T isocenter during occlusion.
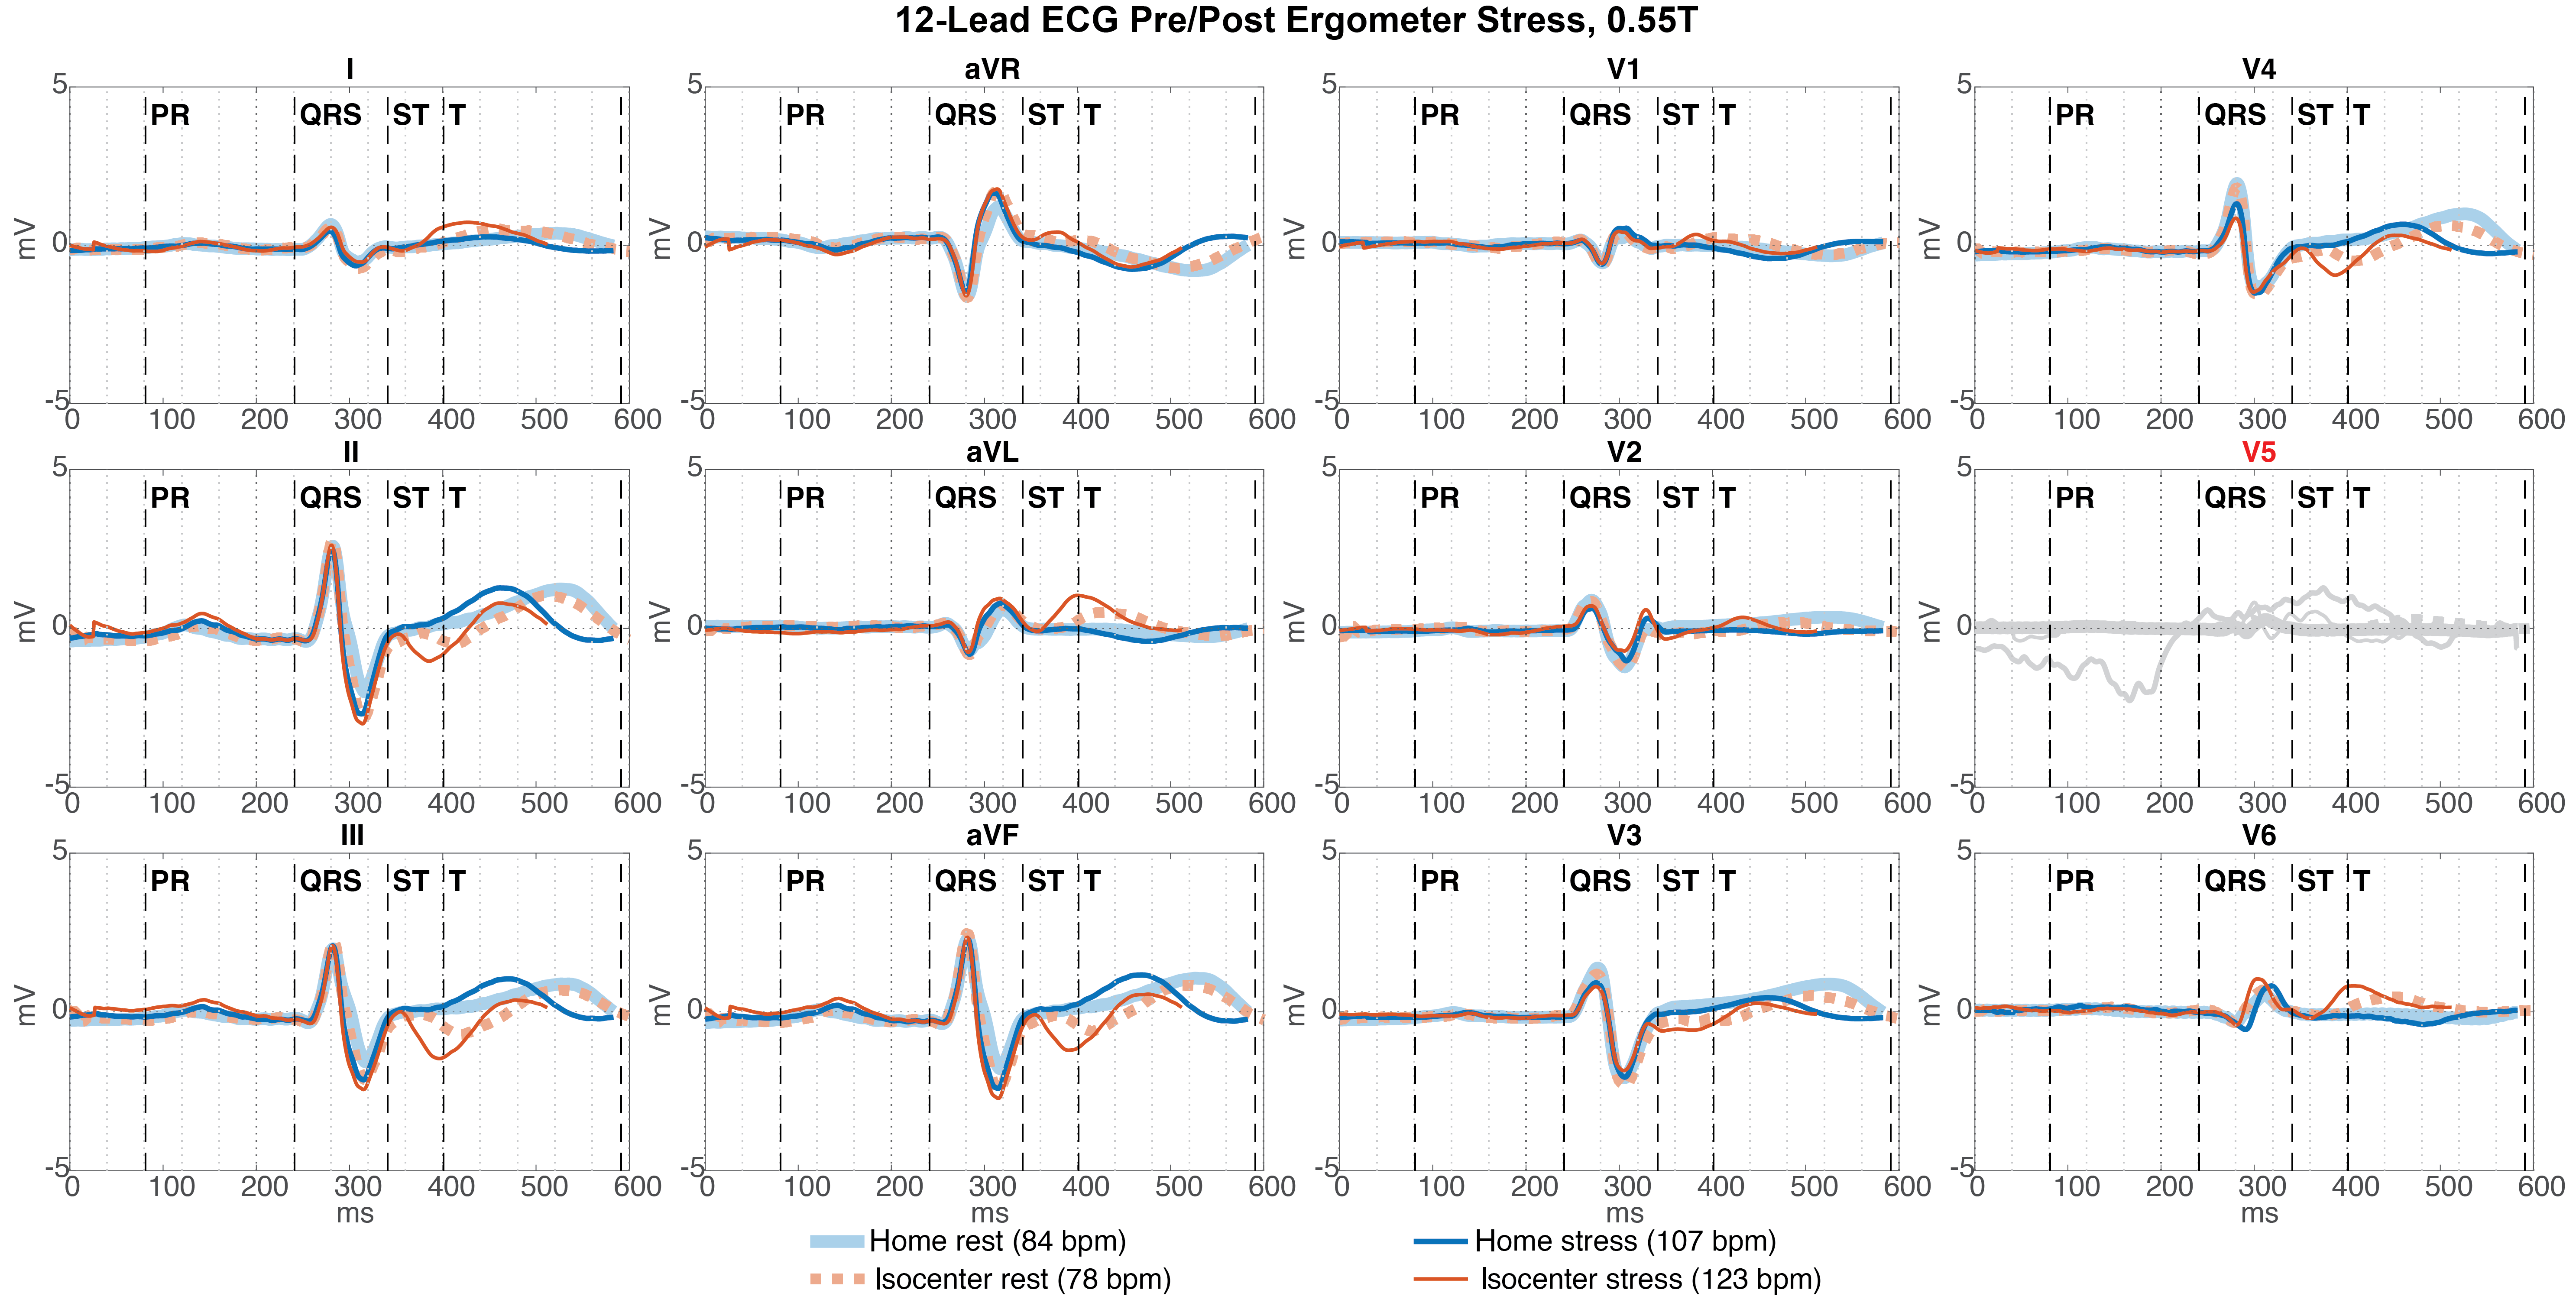
Figure 5 shows an ECG obtained at 0.55T in a normal human subject undergoing ergometer exercise stress. At Home ECG morphology is similar between rest and stress outside of expected changes in QT interval with stress heart rate elevation. At isocenter, distortion of the ST segment increases with stress.
Discussion
ECG distortion in the MRI environment remains a barrier for cardiac monitoring during procedures in the MRI scanner.MRI ECG distortion can be separated into distortion related to MHD, and distortion due to magnetically-induced currents from patient movement, and from scanning.8 We found that MHD-related ECG distortion, mostly involving the ST segment, was significantly improved at 0.55T compared to 1.5T and 3.0T. Respiratory motion-related ECG distortion was also significantly improved at 0.55T and was manifest as beat-to-beat variability that affected all ECG segments. This study did not evaluate ECG distortion during MRI scanning.
Conclusion
ECG distortion is significantly improved in 0.55T compared to 1.5T and 3T due to reduced MHD and reduced sensitivity to subject motion, like respiration. At Home, ECG distortion at 0.55T is sufficiently reduced that clinical interpretation appears feasible.Marked ST segment changes, such as ST elevation during coronary occlusion, also appear detectable at 0.55T isocenter. However, distortion remains enough to obscure subtle ST segment changes that could be clinically relevant. The J-point position, a primary metric for detecting ischemia, was relatively preserved at 0.55T isocenter compared to the subsequent ST segment.
The reduced level of ECG distortion in 0.55T scanners may simplify the problem of suppressing residual distortion by ECG cable positioning, averaging, and filtering and could reduce current restrictions on ECG monitoring during MRI procedures.
Acknowledgements
This work was funded by NHLBI DIR Z01‐HL005062, Z01‐HL006061, Z1A‐HL006213, and ZIA-HL006257). The authors would like to acknowledge the assistance of Siemens Healthcare in the modification of the MRI system for operation at 0.55T under an existing cooperative research agreement (CRADA) between NHLBI and Siemens Healthcare. We would also like to acknowledge the contributions of Victoria Frasier and Katherine Lucas.References
1 Craven, T. P., Tsao, C. W., La Gerche, A., Simonetti, O. P. & Greenwood, J. P. Exercise cardiovascular magnetic resonance: development, current utility and future applications. J Cardiovasc Magn Reson 22, 65 (2020). https://doi.org/10.1186/s12968-020-00652-w
2 Nageotte, S. J., Lederman, R. J. & Ratnayaka, K. MRI Catheterization: Ready for Broad Adoption. Pediatr Cardiol 41, 503-513 (2020). https://doi.org/10.1007/s00246-020-02301-6
3 Mukherjee, R. K., Chubb, H., Roujol, S., Razavi, R. & O'Neill, M. D. Advances in Real-Time MRI-Guided Electrophysiology. Curr Cardiovasc Imaging Rep 12, 6 (2019). https://doi.org/10.1007/s12410-019-9481-9
4 Nijm, G. M., Swiryn, S., Larson, A. C. & Sahakian, A. V. Extraction of the magnetohydrodynamic blood flow potential from the surface electrocardiogram in magnetic resonance imaging. Med Biol Eng Comput 46, 729-733 (2008). https://doi.org/10.1007/s11517-008-0307-1
5 Keltner, J. R., Roos, M. S., Brakeman, P. R. & Budinger, T. F. Magnetohydrodynamics of blood flow. Magn Reson Med 16, 139-149 (1990). https://doi.org/10.1002/mrm.1910160113
6 Wilson, N., Goldberg, S. J., Dickinson, D. F. & Scott, O. Normal intracardiac and great artery blood velocity measurements by pulsed Doppler echocardiography. Br Heart J 53, 451-458 (1985). https://doi.org/10.1136/hrt.53.4.451
7 Oster, J. & Clifford, G. D. Acquisition of electrocardiogram signals during magnetic resonance imaging. Physiol Meas 38, R119-R142 (2017). https://doi.org/10.1088/1361-6579/aa6e8c
8 Felblinger, J., Slotboom, J., Kreis, R., Jung, B. & Boesch, C. Restoration of electrophysiological signals distorted by inductive effects of magnetic field gradients during MR sequences. Magn Reson Med 41, 715-721 (1999). https://doi.org/10.1002/(sici)1522-2594(199904)41:4<715::aid-mrm9>3.0.co;2-7
Figures