1641
Inhomogeneous Magnetization Transfer (ihMT) imaging of the cardiac Purkinje fibers from sheep’s heart at 9.4 T1IHU LIRYC, Univ of Bordeaux, Pessac, France, 2Aix-Marseille Univ, CNRS, CRMBM, Marseille, France, 3APHM, Hopital Universitaire Timone, CEMEREM, Marseille, France, 4CRMSB, UMR 5536 CNRS/Université de Bordeaux, Bordeaux, France
Synopsis
Keywords: Arrhythmia, Magnetization transfer
Motivation: The architecture of the cardiac conduction system is implicated in cardiac arrhythmias such as ventricular fibrillation and characterizing this structure will help better understand and diagnose these arrhythmias.
Goal(s): Optimizing the inhomogeneous magnetization transfer technique for 3D imaging of conducting fibers.
Approach: A range of parameters for ihMTRARE sequence were explored for imaging samples from sheep’s left ventricles containing free-running Purkinje fibers and myocardium.
Results: Across samples, ihMTR signal was found consistently higher in fibers compared to the myocardium for the chosen saturation parameters. This finding holds promise for future 3D imaging of the cardiac conduction system.
Impact: The results of this study hold promise for future 3D imaging of larger samples of the left ventricle containing free-running and intramural Purkinje fibers using the optimized sequence which would allow the segmentation and characterization of these fibers.
Introduction
The cardiac conduction system (CCS) is responsible for propagating electrical impulses throughout the heart, which results in the synchronized beating of the heart. The architecture of the CCS is implicated in arrhythmogenic pathologies such as ventricular fibrillation 1, which often results in sudden cardiac death. Characterizing the CCS is therefore of high importance for understanding these cardiac arrhythmias.It has been demonstrated that Magnetization Transfer (MT) MRI provides a contrast between the conducting Purkinje fibers (PF) and the myocardium by targeting the collagen sheath surrounding the fibers 2. This exploratory study at 9.4 T aims at evaluating a new contrast between the PF and myocardium sensitive to macromolecular content using inhomogeneous magnetization transfer (ihMT) 3,4 on different cardiac samples from sheep’s left ventricle.
Materials & Methods
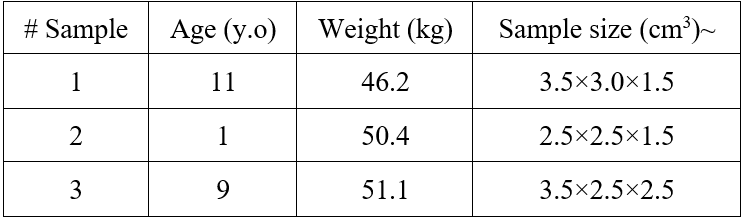
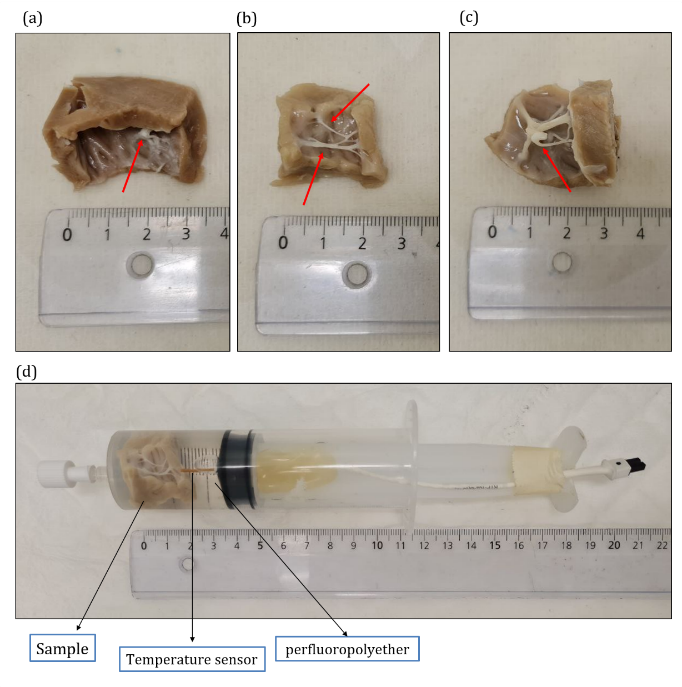
SamplesThree samples from the anterior left ventricle of three different sheep’s hearts (all female, details in table 1), which include several free-running PF (red arrows in figure 1.a-c) were chosen. After euthanasia, samples were fixed in 4% formaldehyde containing 0.1% of GD DOTA (Guerbet, France) of total volume. For data acquisition, each sample was immersed in perfluoropolyether (figure 1-d) and the temperature was kept at 36±1 °C monitored by a temperature probe (SA Instruments, NY) connected to an external computer.
MR acquisition
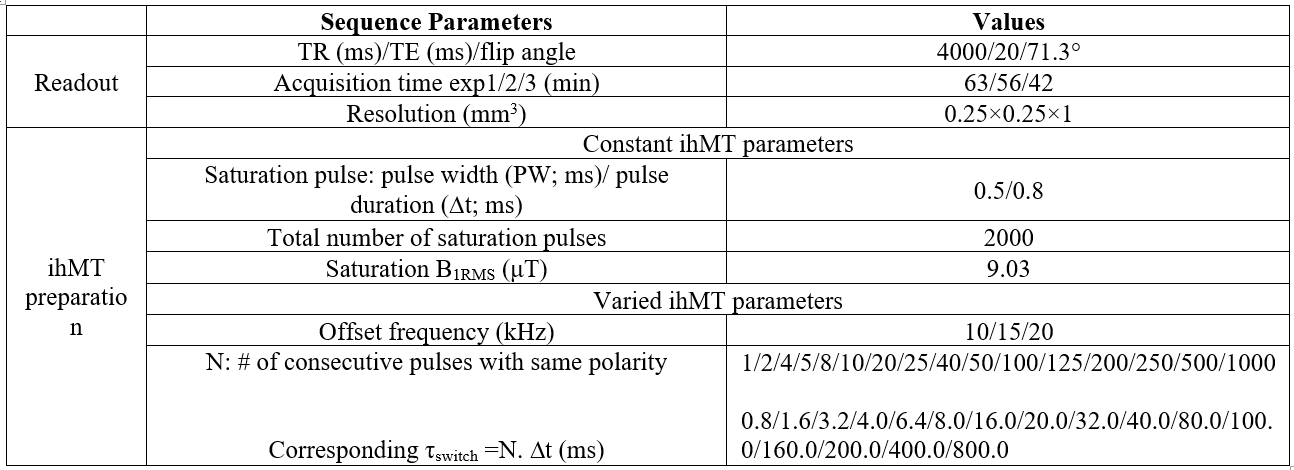
All experiments were performed at 9.4T/30cm (Bruker Biospin MRI, Ettlingen Germany) with a cylindrical transmit coil (87 mm intern) coupled with a 4 arrays reception coil. A 2D ihMT-RARE sequence with frequency-alternated pulses for the dual-offset saturation 4,6 was used to acquire single offset and dual-offset MT weighted images with the saturation parameters listed in table 2.
IhMT ratios (ihMTR in %) were calculated as:
$$ihMTR=100\times\frac{(M_{sing}-M_{dual})}{M_{0}}$$
Where Msing=MT++MT- and Mdual=MT±+MT∓.
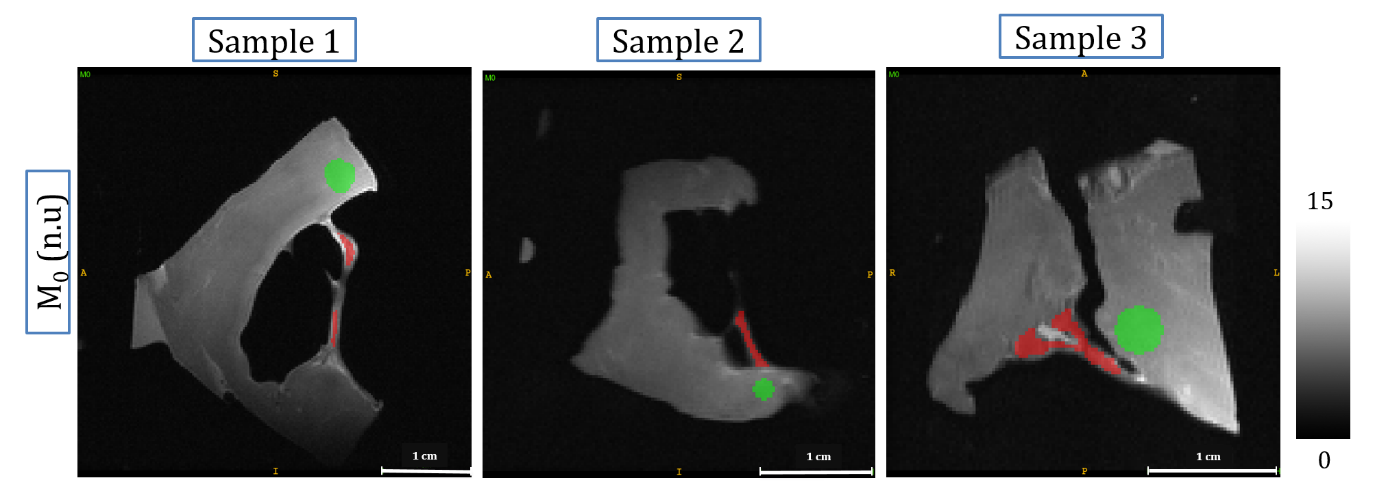
MT+ and MT- refer to the MT weighted images acquired with positive offset saturation and negative offset saturation, respectively and MT± and MT∓ refer to MT weighted images acquired with dual offset saturation. For dual offset saturation, the frequency of the pulses was alternated between positive and negative offsets every τswitch, where τswitch is defined by τswitch=N×$$$\triangle$$$t. N is the number of pulses at the same frequency and $$$\triangle$$$t the saturation pulse repetition time. Allowing a large value for N increases the τswitch value and hence sensitizes the ihMT signal to longer T1D relaxation 5,7. IhMTR maps were generated using the script: https://github.com/lsoustelle/ihmt_proc and a custom-made python script was used to define two ROIs manually in PF (Fig. 2, red) and in myocardium (Fig. 2, green). Mean ihMTR values were calculated in each ROI of all samples.
Results & Discussion
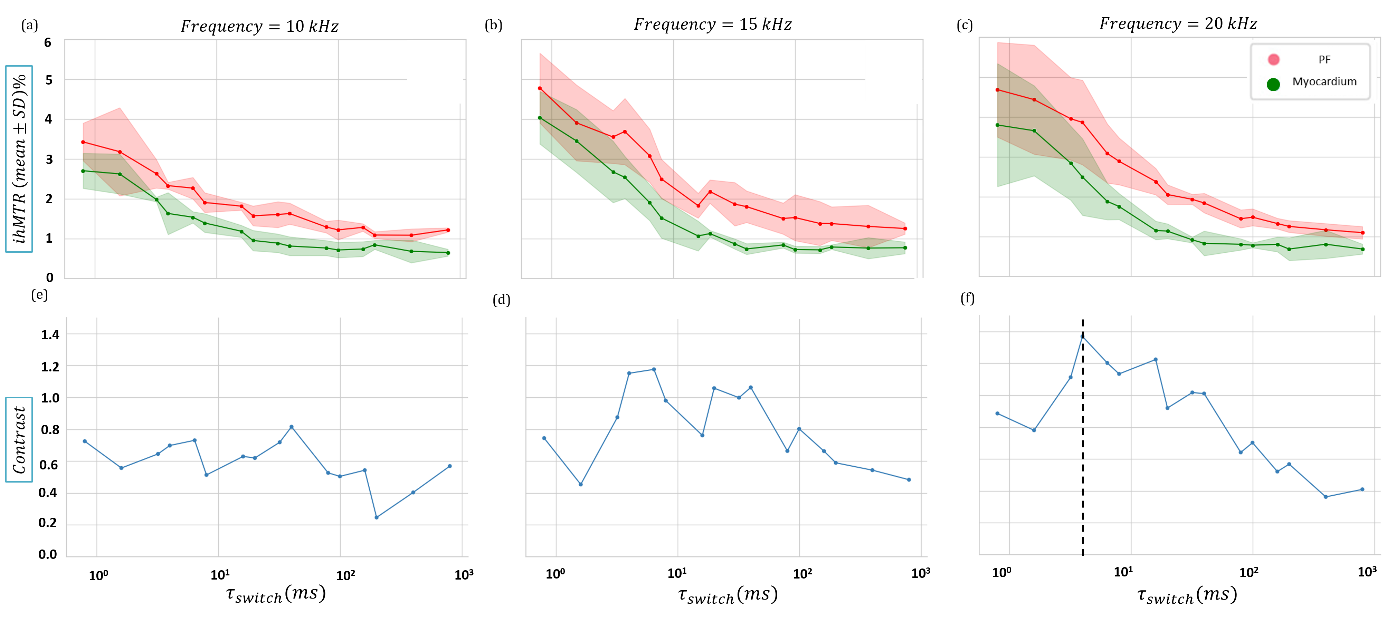
For each different frequency offset and τswitch value, mean ihMTR and standard deviation in myocardium and PF were calculated from the three samples. The decay of the mean ihMTR with increasing τswitch is shown in Figure 3 for the three different frequency offsets. Interestingly, for the saturation parameters used here, the ihMTR value is consistently higher in the PF than in myocardium for all different offset frequencies. Figures 3.e-f show the contrast between PF and myocardium calculated as contrast=ihMTR(PF)-ihMTR(myocardium), for which the maximum contrast of 1.36% (absolute scale) is observed for offset-frequency of 20 kHz and τswitch at 4 ms. Note however, the relatively low ihMTR values (~3-5%) and the overlapping of the myocardium and PF standard deviations (shaded areas), indicative of a relatively low SNR.By increasing the τswitch, ihMTR decreases in different conductive fibers (at 20 kHz, ihMTR(τswitch=0.8 ms)=4.6% vs ihMTR(τswitch=8 ms)=2.8%) and myocardium (at 20 kHz, ihMTR(τswitch=0.8 ms)=3.8% vs ihMTR(τswitch=8 ms)=1.7 %). This loss of signal suggests close and fast T1D relaxation properties for fibers and myocardium.
Conclusion
This study highlighted the potential of generating an MRI contrast between CCS fibers and the cardiac tissue, based on ihMT. A good reproducibility between the three samples has been demonstrated on three different sheep hearts at very high field (9.4T). Future studies will focus on improving the SNR and further optimizing the contrast between the conducting fibers and the myocardium for 3D imaging of free-running and intramural fibers and their segmentation.Acknowledgements
This study received financial support from the French Government by the National Research Agency (ANR; SYNATRA ANR-21-CE19-0014-01.References
1. M. Haissaguerre, et al., Nat Rev Cardiol, vol. 13, no. 3, pp. 155–166, Mar. 2016, doi: 10.1038/nrcardio.2015.193 SMASH.
2. J. Magat et al., MAGMA, vol. 34, no. 4, pp. 605–618, Aug. 2021, doi: 10.1007/s10334-020-00905-w SMASH.
3. G. Varma et al., MRM, vol. 73, no. 2, pp. 614–622, 2015, doi: 10.1002/mrm.25174 SMASH.
4. G. Varma et al., JMR 2015, doi: 10.1016/j.jmr.2015.08.024 SMASH
5. A. Hertanu et al., MRM, vol. 87, no. 5, pp. 2313–2328, May 2022, doi: 10.1002/mrm.29139 SMASH.
6. V. H. Prevost et al., NMR Biomed, vol. 30, no. 6, pp. 1–13, 2017, doi: 10.1002/nbm.3706 SMASH.
7. A. Hertanu et al.,MRM, 2022, doi: 10.1002/mrm.29140 SMASH.
Figures