1640
Quantification of left atrial fibrosis in cardiac MRI: a multi-method, multi-vendor comparison study1Lanzhou University Second Hospital, Lanzhou, China, 2Gansu Provincial Hospital, Lanzhou, China, 3Philips Healthcare, Xi’an, China
Synopsis
Keywords: Arrhythmia, Arrhythmia, Fibrosis
Motivation: The impact of vendors and threshold methods on quantification of LA fibrosis is not well studied.
Goal(s): To evaluate the inter-vendor and inter-threshold impact on LA fibrosis quantification.
Approach: Both packages of Medis and CVI42 ADAS were used to calculate LA fibrosis based on the image IIR 1.2-method and 2 SD above the mean blood pool signal intensity of LA.
Results: The both post-processing software packages of Medis and CVI42 ADAS have a good agreement and correlation to quantify LA fibrosis if an identical quantification method was used. However, LA fibrotic burden is influenced by used quantification methods.
Impact: LA fibrotic burden quantified with cardiac MRI is influenced by used quantification methods, but don’t dependent on vendors. The use of Utah stages by other centers needs further validation when different analysis methods applied.
Introduction
Fibrosis in the atria, characterized by the deposition of collagen fibers in the myocardial interstitium, is thought to be a hallmark of arrhythmogenic structural remodeling [1]. Left atrial (LA) fibrosis can be quantified by cardiac MRI using 3D late gadolinium-enhanced (3D-LGE) sequences [2]. 3D-LGE imaging is a noninvasive method to visualize and quantify the extent of LA fibrosis, which predicts the outcome after pulmonary vein isolation (PVI) [3]. In addition, identification and quantification of atrial fibrosis using cardiac MRI may improve patient selection and risk stratification for AF ablation therapy. Consequently, the quantification of LA fibrosis may have important clinical implications. There are several post-processing vendors and fibrosis threshold methods to identify LA fibrosis. The mainstream image post-processing vendors include Medis and Circle cvi42. The first threshold method defines fibrotic tissue based on the mean and standard deviations (SDs) of reference value. The second threshold method, referred to as the image intensity ratio (IIR), normalizes the signal intensity of the LA wall to the reference value. Nevertheless, the impact of vendors and threshold methods on quantification of LA fibrosis is not well studied. We sought to evaluate the inter-vendor and inter-threshold comparisons of LA fibrosis quantification.Methods
This study was approved by the Medical Ethics Committee of our hospital, and the patients all signed the informed consent. Patients with AF scheduled to undergo PVI ablation procedure were enrolled from September 2022 to August 2023. All MR examinations were performed on a 1.5 T MR scanner equipped with a combination of 18-channel body and 32-channel spine matrix coil elements. The high-resolution 3D-LGE images of LA were acquired using a respiratory navigation and ECG-gated inversion recovery prepared gradient echo pulse sequence applied between 15 and 20 minutes after contrast injection. Both packages of Medis software (Medis, Leiden, the Netherlands) and CVI42 ADAS 3D software (Galgo Medical, Barcelona, Spain) were used to calculate LA fibrosis based on the image intensity ratio (IIR 1.2)-method and 2 SD above the mean blood pool signal intensity of LA. Statistical analysis: Pearson’s test and intraclass correlation coefficients (ICCs) were used to quantify the associations of correlation and agreement between continuous variables. Additionally, measurements of LA fibrosis was visually assessed by Bland–Altman analysis. A p-value < 0.05 was considered statistically significant.Results
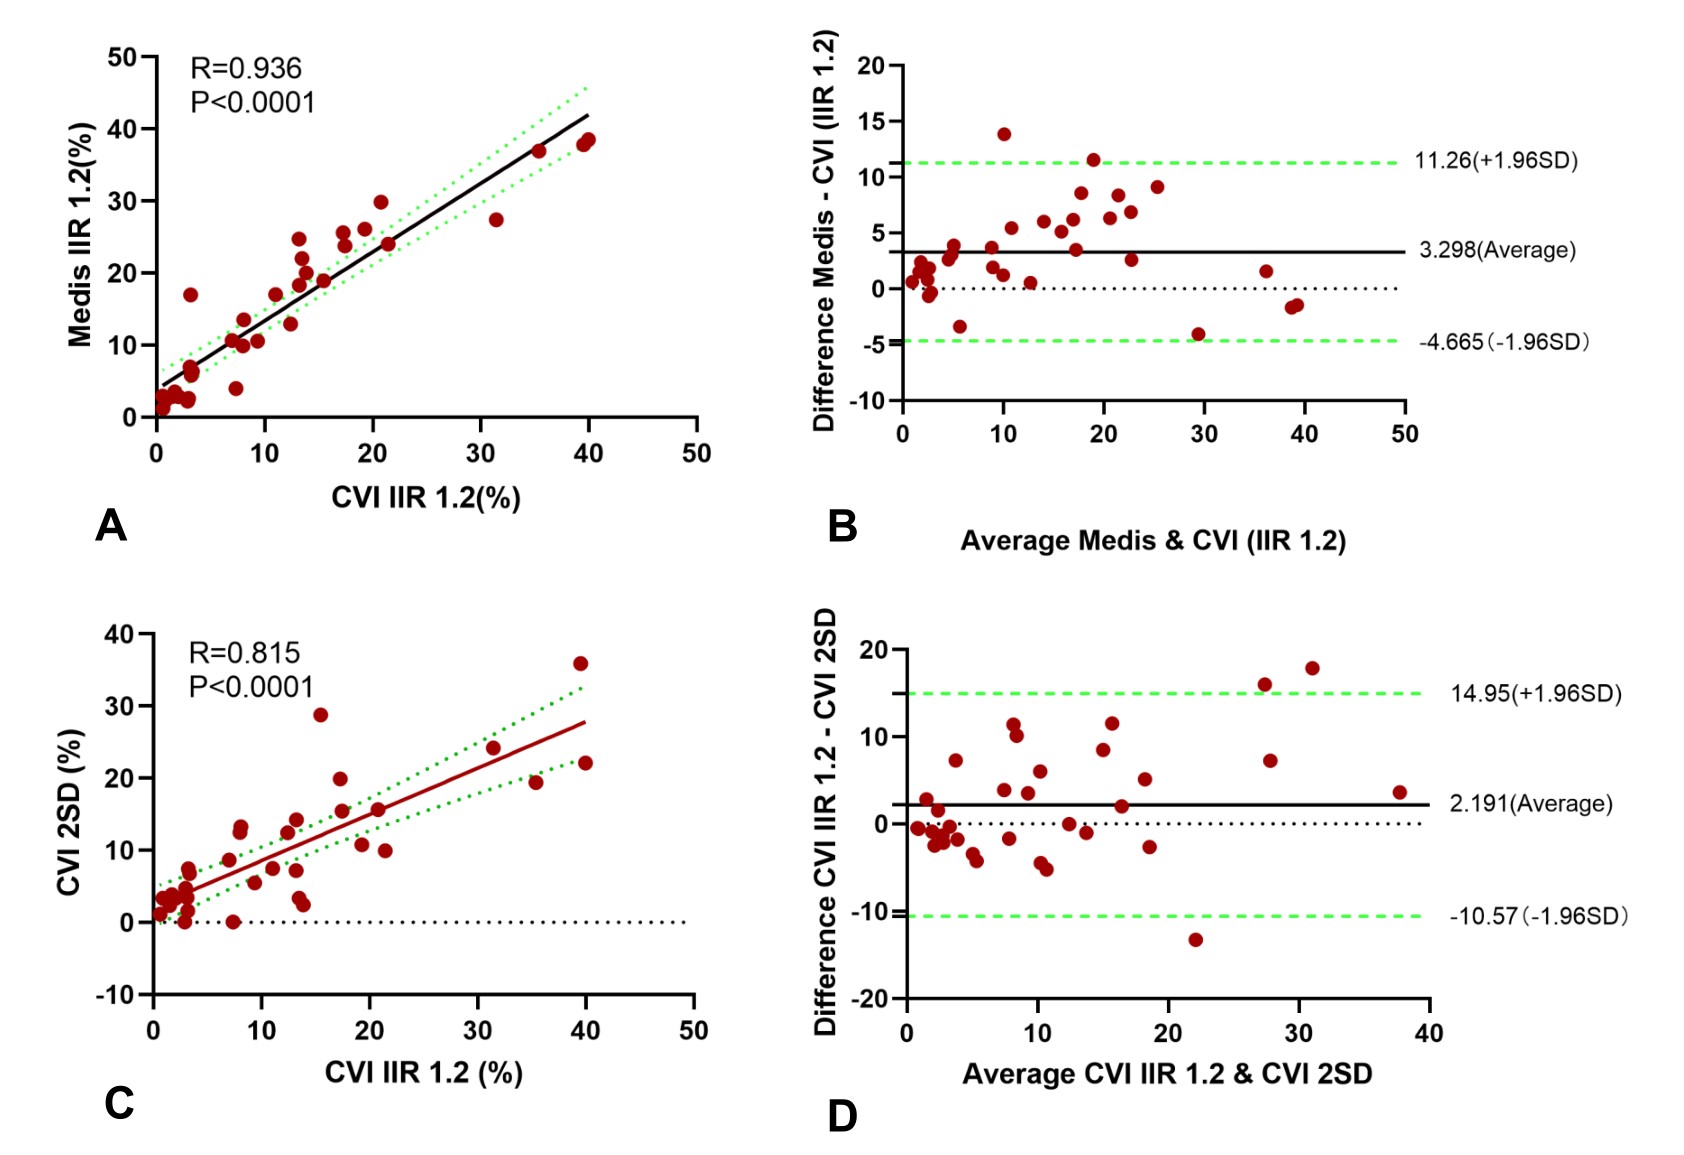
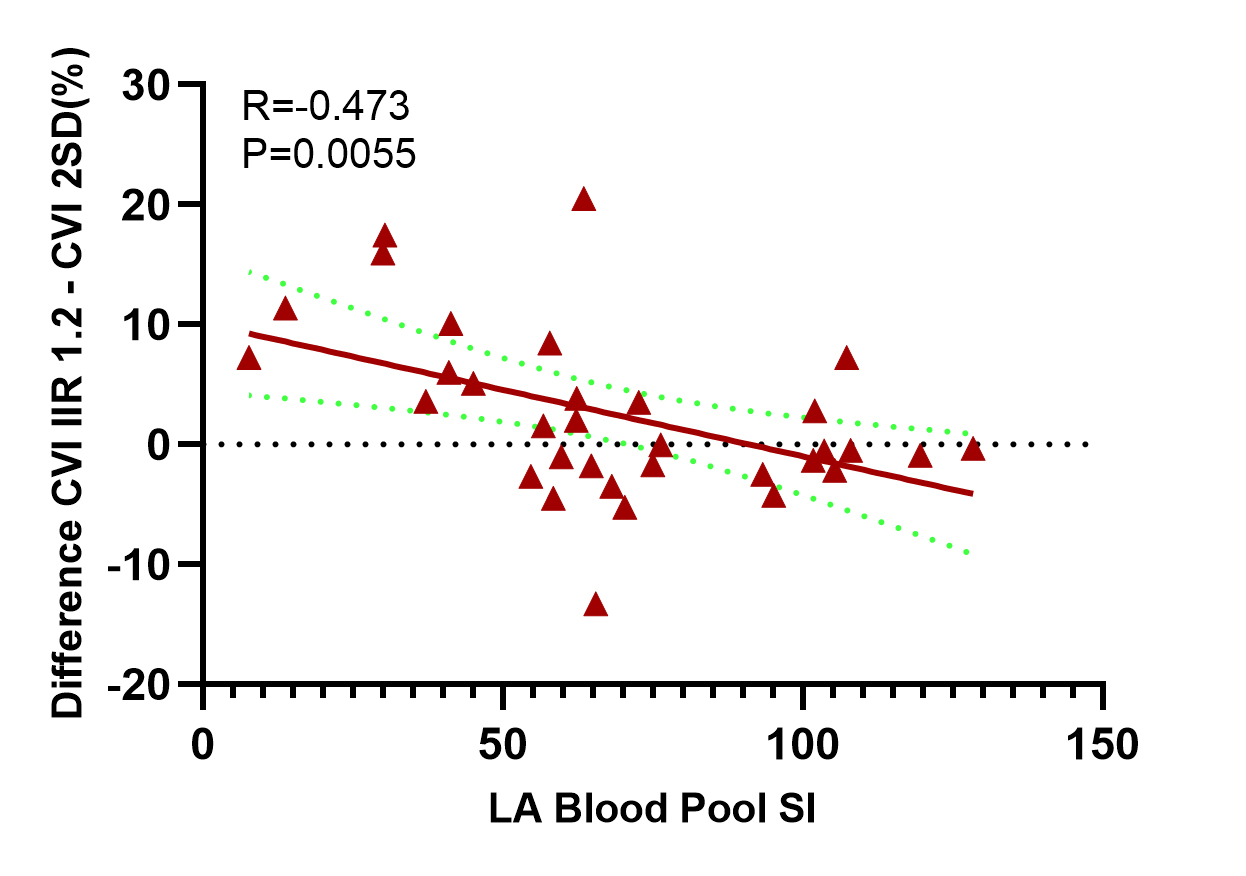
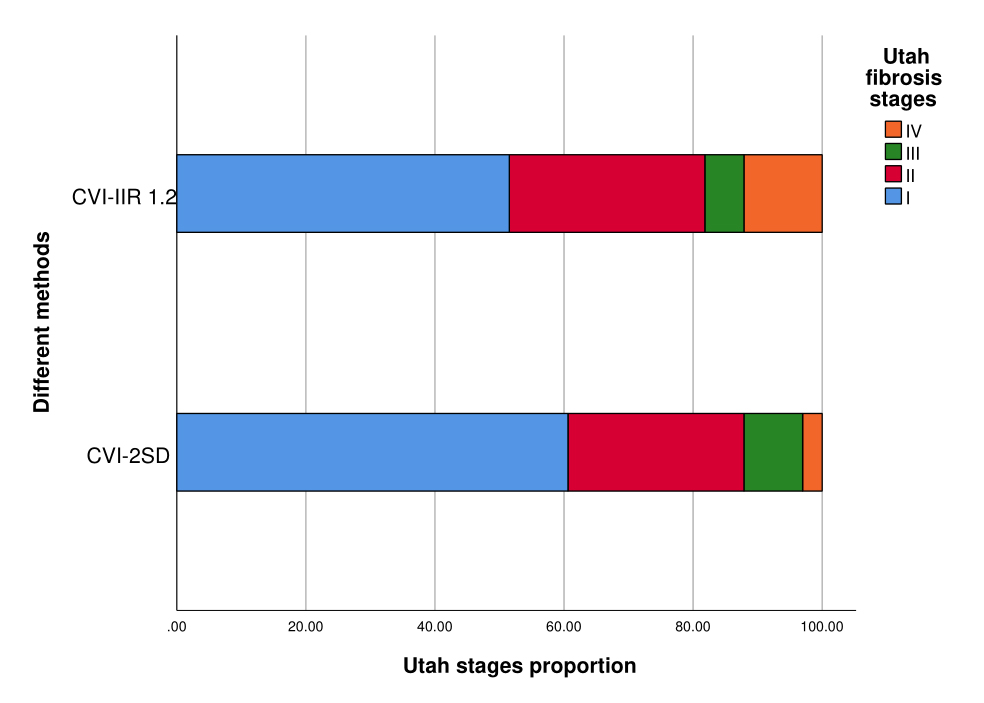
Forty-three of 49 patients completed cardiac MRI examinations, while ten patients were excluded due to insufficient LGE image quality. Thirty-three patients (63.64 ± 9.07 years; 51.52 % men) were eventually included into analysis. The percentage of LA fibrosis assessed using CVI IIR 1.2 was significantly different from the Medis IIR 1.2 (15.44 ± 11.42% vs 12.14 ± 11.21%; P<0.0001). The correlation between the two vendors was excellent (r=0.936) and agreement was good (ICC=0.899; P<0.0001). Although the correlation between the two quantification methods of CVI IIR 1.2 and CVI 2SD was good (r=0.815, P<0.0001), agreement was moderate (ICC=0.778; P<0.0001). Agreement and correlation of LA fibrosis quantification between different methods and vendors were detailed in Figure 1. Furthermore, there was a moderate negative correlation between the difference derived from the CVI IIR 1.2 and CVI 2SD method, and the LA blood pool signal intensity (r=-0.473; P=0.0055; Figure 2). Twelve patients (36.36%) patients were allocated to a different Utah stages dependent on the used quantification method (Figure 3).Discussion
This study showed that the Medis and CVI ADAS package have a good agreement and correlation for LA fibrosis quantification. The LA fibrotic burden quantified by Medis is a slightly higher than CVI42 ADAS with a bias of 3.30%. This result may be attributed to different approachs in delineation of the atrial wall, which the thickness range of the atrial wall delineated by Medis is thicker than CVI42 ADAS. In addition, the present study demonstrates that the two quantification methods don’t have a good agreement. Based on the two quantification methods, twenty-one of the 33 patients (63.64%) got assigned to the same Utah stage while 12 patients (36.36%) got assigned to a different fibrosis stage. The measured fibrotic burden is influenced by used fibrosis quantification methods. Furthermore, we find that the LA blood pool signal intensity has a moderate negative correlation with the difference derived from the CVI IIR 1.2 and CVI 2SD method. Maybe, a high LA blood pool signal intensity resulted in a smaller difference.Conclusion
The both post-processing software packages of Medis and CVI42 ADAS have a good agreement and correlation to quantify LA fibrosis if an identical quantification method was used. However, LA fibrotic burden and Utah stages is influenced by used quantification methods.Acknowledgements
I would like to thank every participants in this research for their help.References
1. Burstein B, Nattel S. Atrial fibrosis: mechanisms and clinical relevance in atrial fibrillation. J Am Coll Cardiol 2008;51:802–9. 2. Ambale-Venkatesh B, Lima JA. Cardiac MRI: a central prognostic tool in myocardial fibrosis. Nat Rev Cardiol 2015;12:18–29. 3. Marrouche NF, Wilber D, Hindricks G, et al. Association of atrial tissue fibrosis identified by delayed enhancement MRI and atrial fibrillation catheter ablation: the DECAAF study. JAMA. 2014;311:498–506. 4. Harrison JL, Jensen HK, Peel SA, et al. Cardiac magnetic resonance and electroanatomical mapping of acute and chronic atrial ablation injury: a histological validation study. Eur Heart J 2014;35:1486–95.Figures