1638
Characterization of the cardiac conduction system with inhomogeneous Magnetization Transfer (ihMT): an ex-vivo study1Aix Marseille Univ, CNRS, CRMBM, Marseille, France, 2IHU LIRYC, University of Bordeaux, Pessac, France, 3Radiology, Division of MRI Research, Beth Israel Deaconess Medical Center, Harvard Medical School, Boston, MA, United States, 4IHU LIRYC, University of Bordeaux, Bordeaux, France, 5CRMSB, UMR 5536 CNRS, Université de Bordeaux, Bordeaux, France
Synopsis
Keywords: Myocardium, Cardiovascular, Contrast Mechanism, ihMT
Motivation: Imaging the cardiac conduction system (CCS) remains a significant challenge, since no imaging modalitiy has so far provided good contrast between the cardiac muscle and the embedded fibers that regulate normal heartbeat.
Goal(s): We aim to address this challenge by employing inhomogeneous Magnetization Transfer Imaging (ihMT).
Approach: We hypothesise that the conductive fibers exhibit unique dipolar order properties, due to the collagen sheath that surrounds them, and could thus be selectively isolated by ihMT.
Results: As a first step towards enhancing muscle-to-fiber contrast, this work investigated the biophysical parameters that govern the ihMT signal in the macromolecular environment of the CCS.
Impact: The assessment of the macromolecular environment of the cardiac conduction system (CCS) allows for a better understanding of its morphological architecture, and will enable us to design an ihMT sequence specifically sensitive to the challenging morphology of the CCS.
Introduction
The free running Purkinje Fibers (PF) and fibers embedded in the cardiac muscle are the main components of the cardiac conduction system (CCS) and are implicated in the initiation and maintenance of lethal arrhythmias [1]. Despite its importance, the 3D organization of the CCS remains relatively poorly studied, while conventional MRI has provided limited contrast between PF and myocardium [2]. A discriminative feature of the PF related to the myocardium is the collagen sheath that surrounds the PF [3]. We hypothesise that the latter could be selectively isolated by Inhomogeneous Magnetization Transfer (ihMT) [4] and its dipolar order sensitivity, to provide contrast enhancement between myocardium and PF. We present first steps towards this goal by assessing two biophysical models and the associated parameters that underlie the ihMT signal of the CCS macromolecular environment.Method
The ex-vivo sampleOne sample (Figure 1A, ~25×25×20 mm3) from a sheep’s anterior left ventricle (female, w=50.4 kg, age=1y.o.) was extracted after euthanasia and fixed in formaldehyde (4%).
ihMT models
Two ihMT biophysical tissue models (a mono-component and a bi-component T1D) (Figure 2A), originally developed for the central nervous system [5], [6], were adjusted for ex-vivo cardiac ihMT data acquired with an ihMT-RARE sequence (Figure 2B) and to describe CCS’s macromolecular environment and ihMT signal dynamics over the experiments conducted.
MRI acquisition
Experiments were performed at 7T (Bruker Biospec; 72mm volume transmitter, 2x2 surface receiver coil). The sample was maintained at 37°C during the whole acquisition time. A single-slice (Figure 1B) single-shot ihMT-RARE sequence was applied using the frequency-alternating approach for the the dual-offset saturation [6], to acquire the ihMT images (Figure 2B). The readout parameters were: matrix 128x128x1, resolution 0.2x0.2x0.9 mm3; TR/TE = 3500/4.755 ms. Six sets of experiments were performed with the ihMT saturation parameters listed in Table 1 which explored a) the τswitch dimension (improved sensitivity of ihMT data to T1D), b) the frequency-offset dimension (improved sensitivity to T2b), and c) the RF duty cycle dimension (sensitivity to the exchange constant R). These experimental dimensions were combined in a global fitting approach to estimate the targeted biophysical tissue parameters.
Global fits of data to models
Two regions-of-interest (ROIs) were manually drawn around the myocardium and fiber in zero-power, unsaturated images (MT0, Figure 1B) acquired within each ihMT scan. Mean ihMTR (ihMTR=2*(MT+ - MT+-)/MT0) were computed within the myocardium and fiber ROIs for each experiment in Table 1.A global fit was applied to ihMT data derived from all experiments in Table 1, using non-linear least squares (Matlab) to estimate T2b, R, M0ZB(s) and T1D(s) (Figure 2A), for the two ihMT models. The ihMT model that best describes the CCS of the sample was assessed based on the Bayesian Information Criterion (BIC) [8].
Results
For both models the fitted simulations are consistent with the ihMT signal dynamics over the explored experimental dimensions for both the myocardium and the conductive fiber. A better agreement is nevertheless observed with a bi-component model, as confirmed by larger BIC values (Figure 3). T2b and R could be estimated with a relatively low standard deviation, while they don’t seem to be correlated with other parameters (Figure 4). Conversely, M0ZB(s) and T1D(s) are correlated, which limits the capacity of the fitting algorithm to disentangle the impact of one parameter from the other. Moreover, the short component M0ZB,s and T1D,S were estimated with high uncertainty (high standard deviations). R exhibits different values between the myocardium and PF, while no conclusion can be drawn here for the other estimated parameters.Discussion
The reason why the bi-component T1D model failed to reliably estimate the short T1D component despite a better fit is due to an inappropriate set of experimental data or an intrinsic model’s limitation (strong correlation between M0ZBs and T1Ds) remains to be investigated (e.g., via a sensitivity analysis). Regardless of the model, the myocardium and the fiber show close dipolar relaxation (similar T1D values) but seem to have different bound pool fractions and probably have different exchange rates. These differences could be further exploited to enhance the ihMT contrast between these 2 tissues. Examples of contrast enhancement is seen in data obtained at 20 kHz (Figures 3C,D) or at 30% DC (Figures 3E,F). Using these parameter estimates for the biophysical model, we will simulate ihMTR values for a larger range of saturation parameters towards finding the ihMT-RARE sequence-configuration that would yield the highest contrast in CCS.Conclusion
The 2 ihMT models provided decent fits and were able to simulate the dynamics of ihMT in CCS over the three explored experimental dimensions.Acknowledgements
This study received financial support from the French Government by the National Research Agency (ANR; SYNATRA ANR-21-CE19-0014-02).References
[1] Haissaguerre M, Vigmond E, et al. Ventricular arrhythmias and the His-Purkinje system. Nat Rev Cardiol. 2016;13(3):155-166.10.1038/nrcardio.2015.193.
[2] SMASH Magat J, Fouillet A, et al. 3D magnetization transfer (MT) for the visualization of cardiac free-running Purkinje fibers: an ex vivo proof of concept. MAGMA. 2021.10.1007/s10334-020-00905-w.
[3] SMASH Magat J, Fouillet A, Constantin M, Haliot K, Naulin J, El Hamrani D, Benoist D, Charron S, Walton R, Bernus O, Quesson B. 3D magnetization transfer (MT) for the visualization of cardiac free-running Purkinje fibers: an ex vivo proof of concept. Magnetic Resonance Materials in Physics, Biology and Medicine. 2021 Aug 1:1-4.
[4] Alsop DC, Ercan E, Girard OM, Mackay AL, Michal CA, Varma G, Vinogradov E, Duhamel G. Inhomogeneous magnetization transfer imaging: Concepts and directions for further development. NMR in Biomedicine. 2023 Jun;36(6):e4808.
[5] Carvalho VN, Hertanu A, Grélard A, Mchinda S, Soustelle L, Loquet A, Dufourc EJ, Varma G, Alsop DC, Thureau P, Girard OM. MRI assessment of multiple dipolar relaxation time (T1D) components in biological tissues interpreted with a generalized inhomogeneous magnetization transfer (ihMT) model. Journal of Magnetic Resonance. 2020 Feb 1;311:106668.
[6] Hertanu A, Soustelle L, Le Troter A, Buron J, Le Priellec J, Carvalho VN, Cayre M, Durbec P, Varma, G, Alsop DC, Girard OM. T1D‐weighted ihMT imaging–Part I. Isolation of long‐and short-T1D components by T1D‐filtering. Magnetic Resonance in Medicine. 2022 May;87(5):2313-28.
[7] Soustelle, L., Troalen, T., Hertanu, A., Ranjeva, J. P., Guye, M., Varma, G., ... & Girard, O. M. (2023). Quantitative magnetization transfer MRI unbiased by on‐resonance saturation and dipolar order contributions. Magnetic Resonance in Medicine.
[8] Andrej-Nikolai, and Natalie Neumeyer. "An evaluation of R2 as an inadequate measure for nonlinear models in pharmacological and biochemical research: a Monte Carlo approach." BMC pharmacology 10.1 (2010): 1-11.
Figures
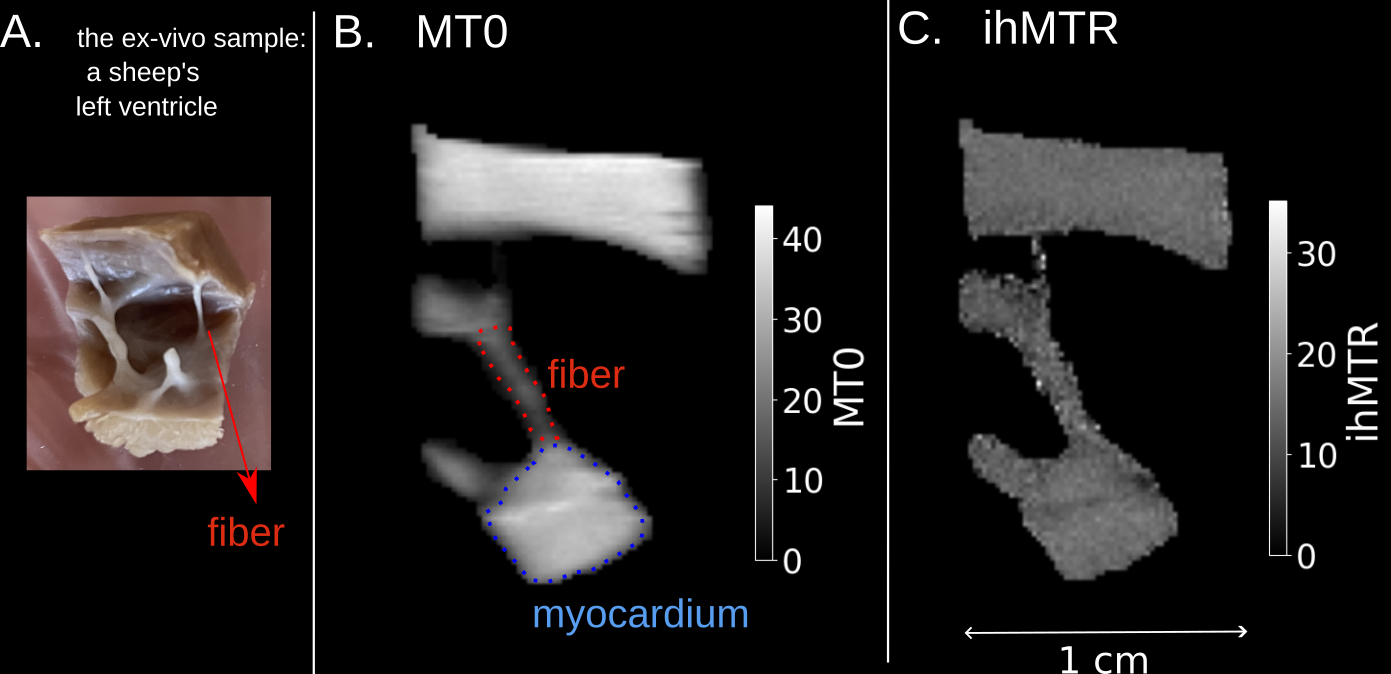
Figure 1
A) The sample used in the study. Several free-running PF in the myocardium can be observed (red arrow). B) The MT0 reference image showing the myocardium (blue contour) and the fiber (red contour). C) An ihMTR image (in %) obtained with pw=0.5 ms; Δt= 0.63 ms; B1RMS = 9 μT; B1peak=48 μΤ; BTR= 70 ms ; Np = 12; τswitch = 0.63 ms; number of bursts = 12; duty cycle = 9%; +f = 20 kHz.
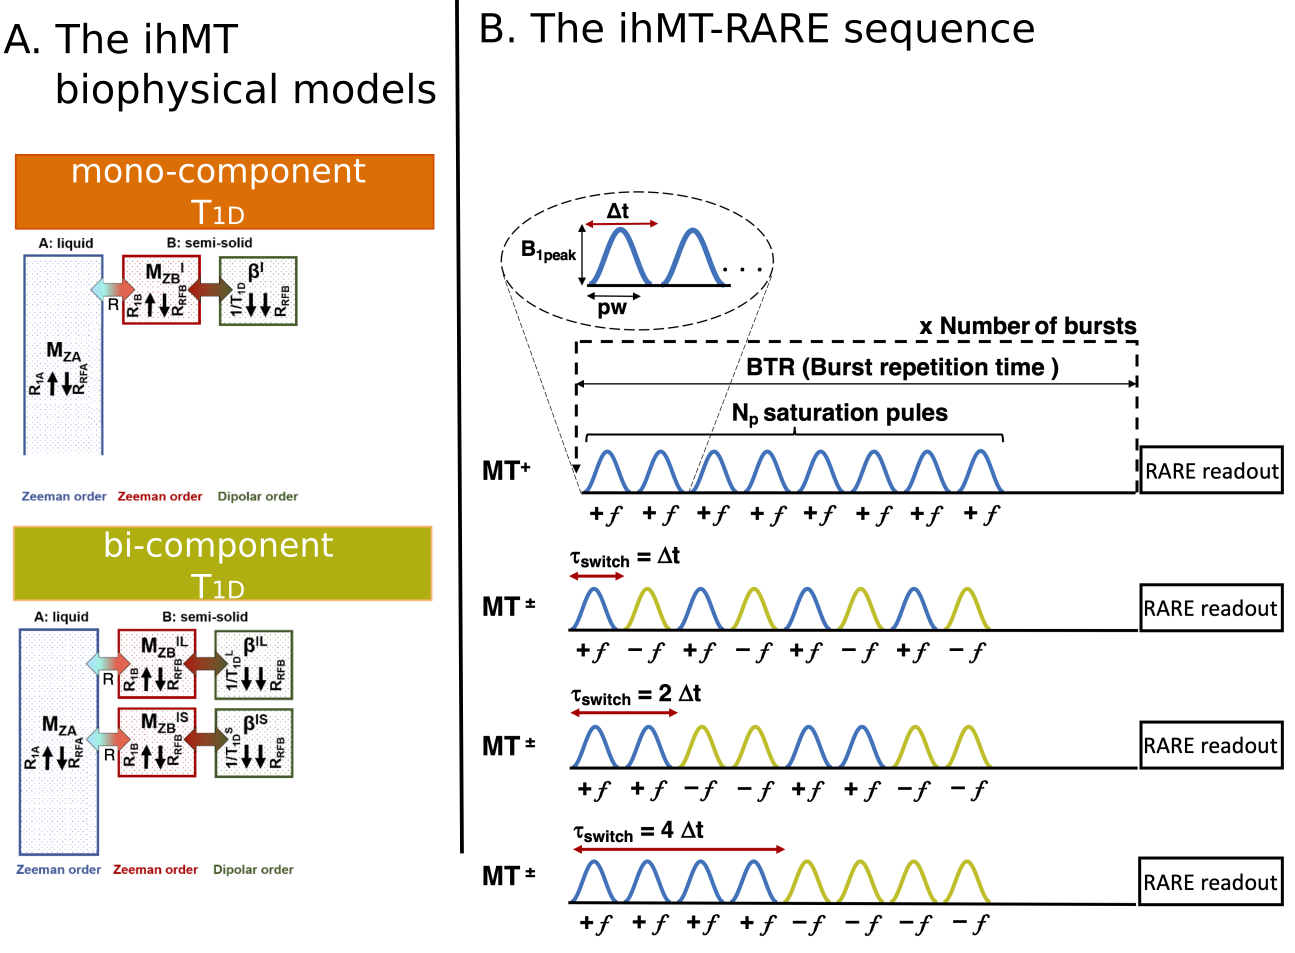
Figure 2
A) ihMT biophysical models [5,6]. T2b (bound pool transverse relaxation time), R (exchange rate), M0ZB(s) (bound pool(s) content) and T1D(s) (dipolar relaxation time(s)) were estimated from the fit. Other parameters were fixed [7]. B) ihMT-RARE sequence including single- and dual-offset MT+ and MT+- images from which the ihMT image is computed. Saturation parameters: pw (ms); B1peak (uT); Δt (ms); Np pulses; BTR (ms); f (kHz); frequency switching time τswitch (ms) (tswitch = n* Δt).
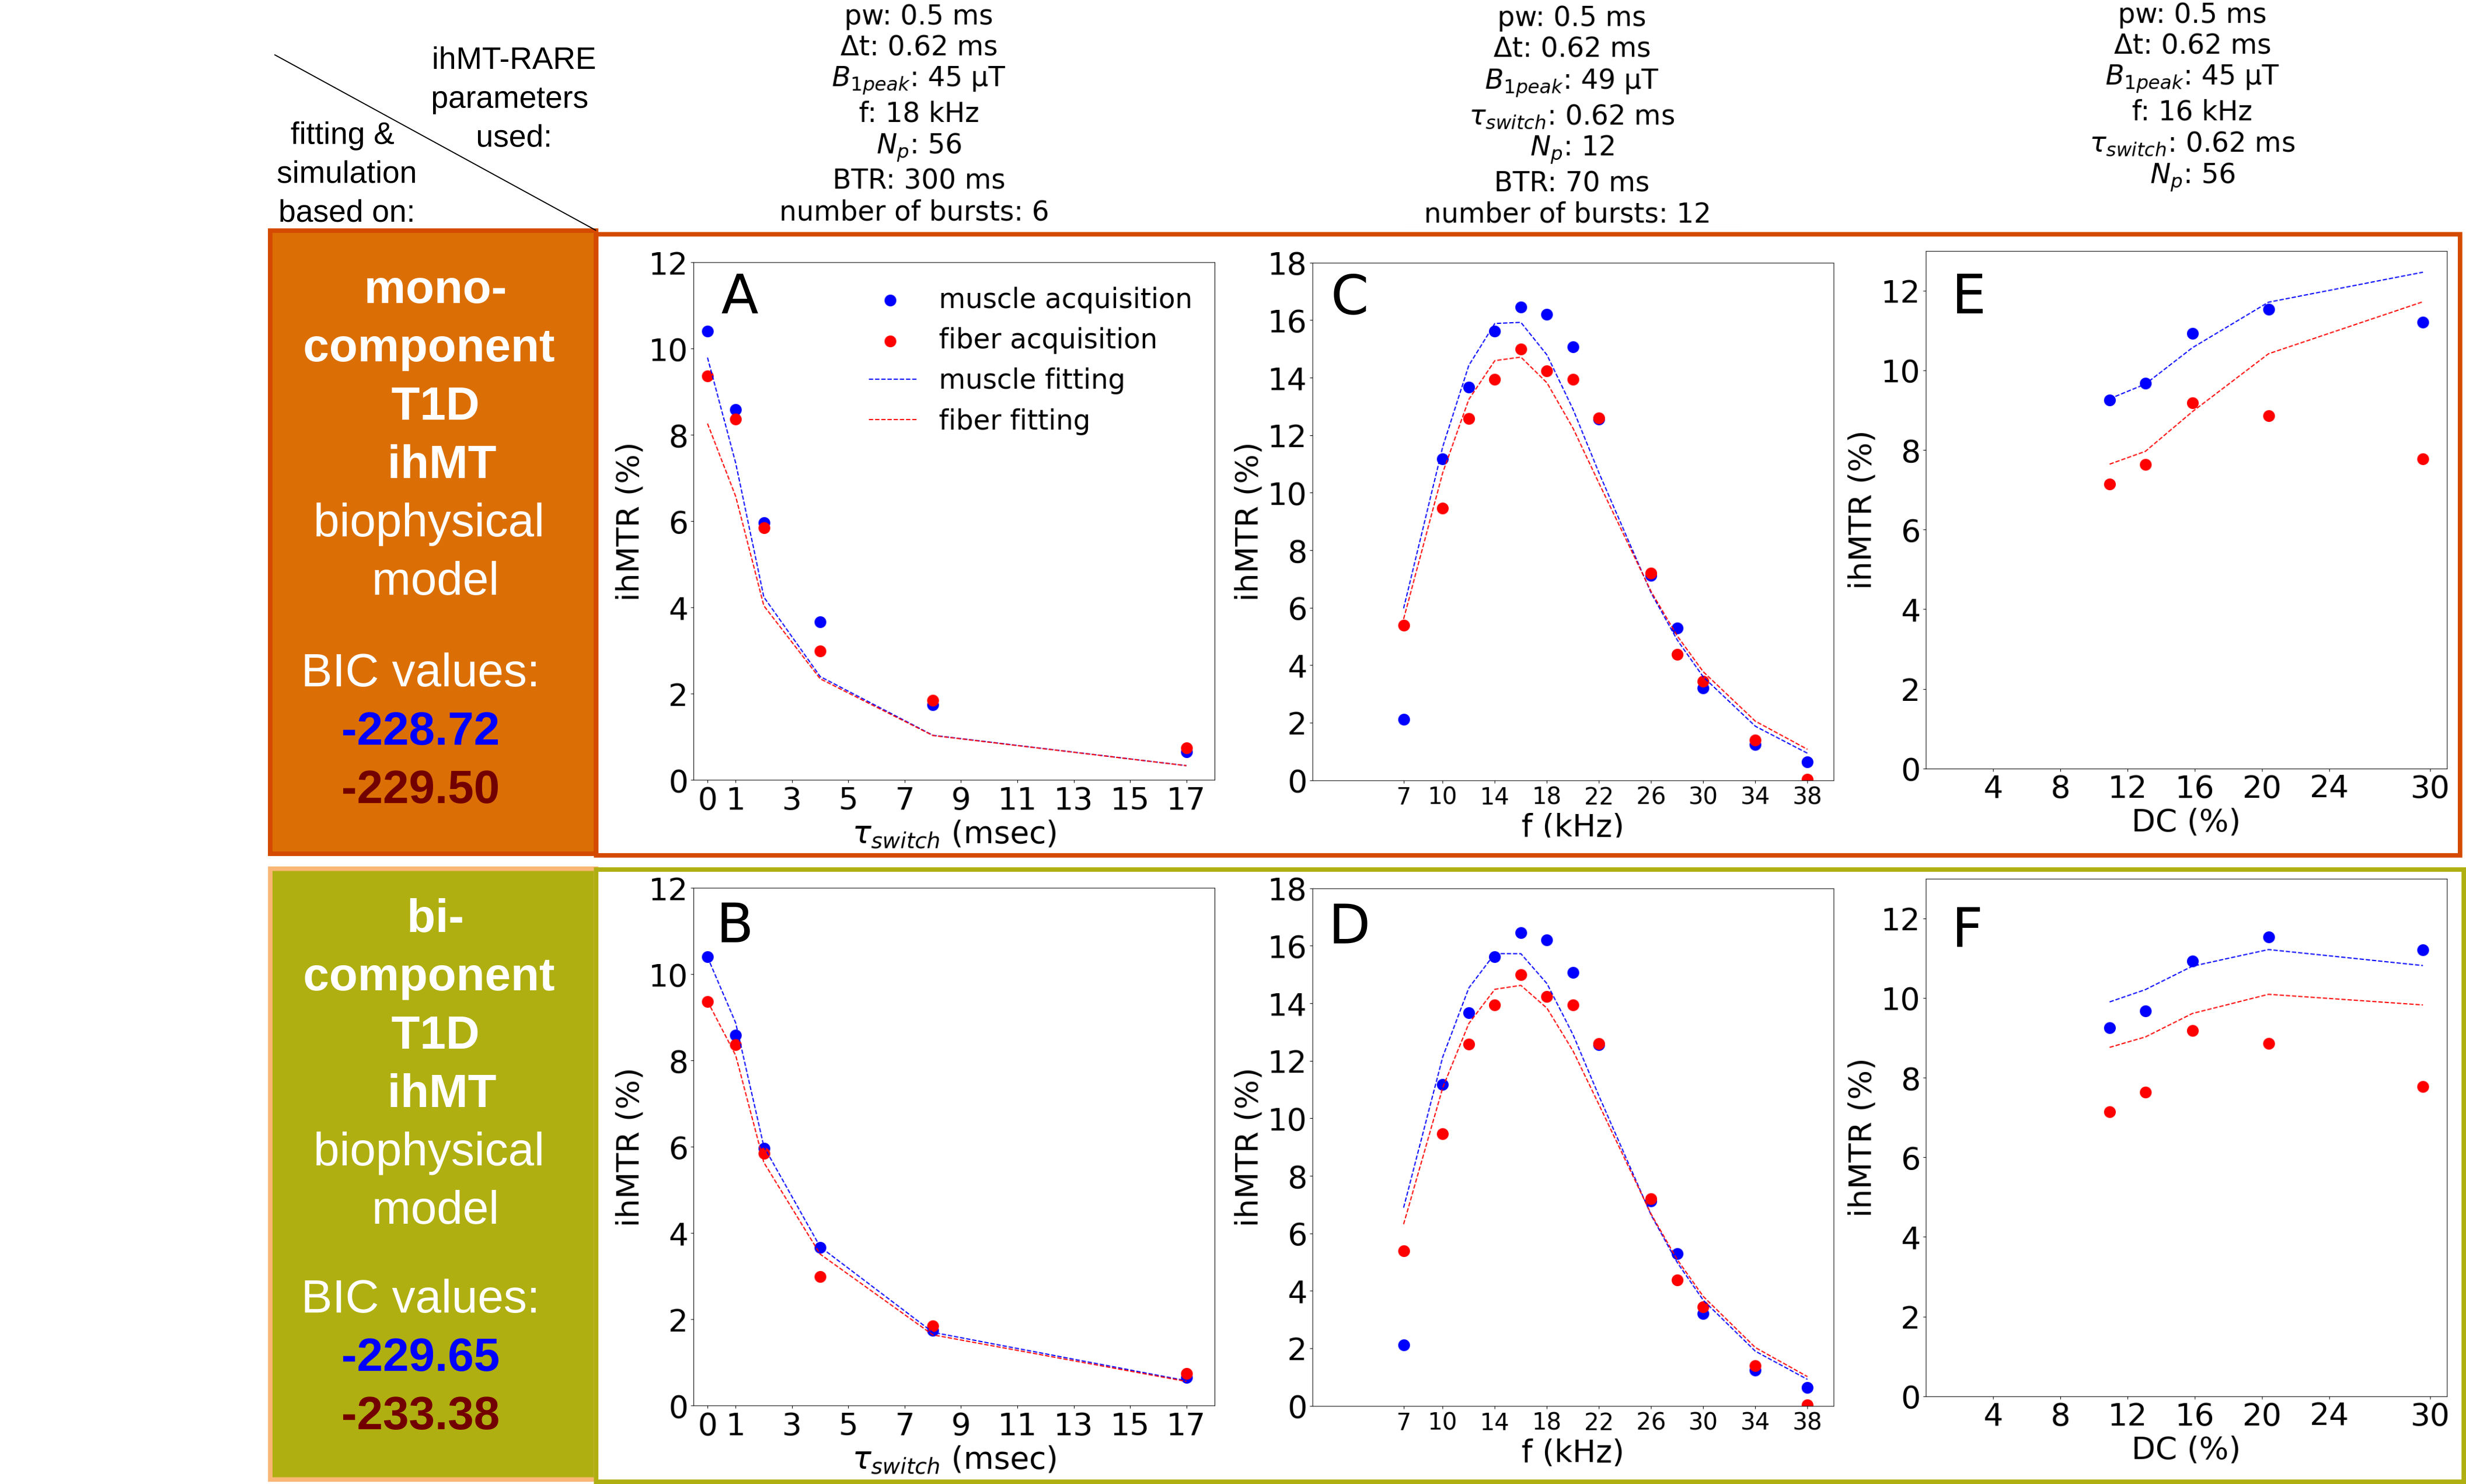
Figure 3
Mono-component and bi-component T1D ihMT models’ fitting results (straight lines) on 3 out of the 6 experimental datasets, for which τswitch, f and the RF duty cycle (DC) varied. Other saturation parameters corresponding to each subplot are provided in the top of each pair of plots. BIC values are provided for myocardium (blue) and fiber (red).
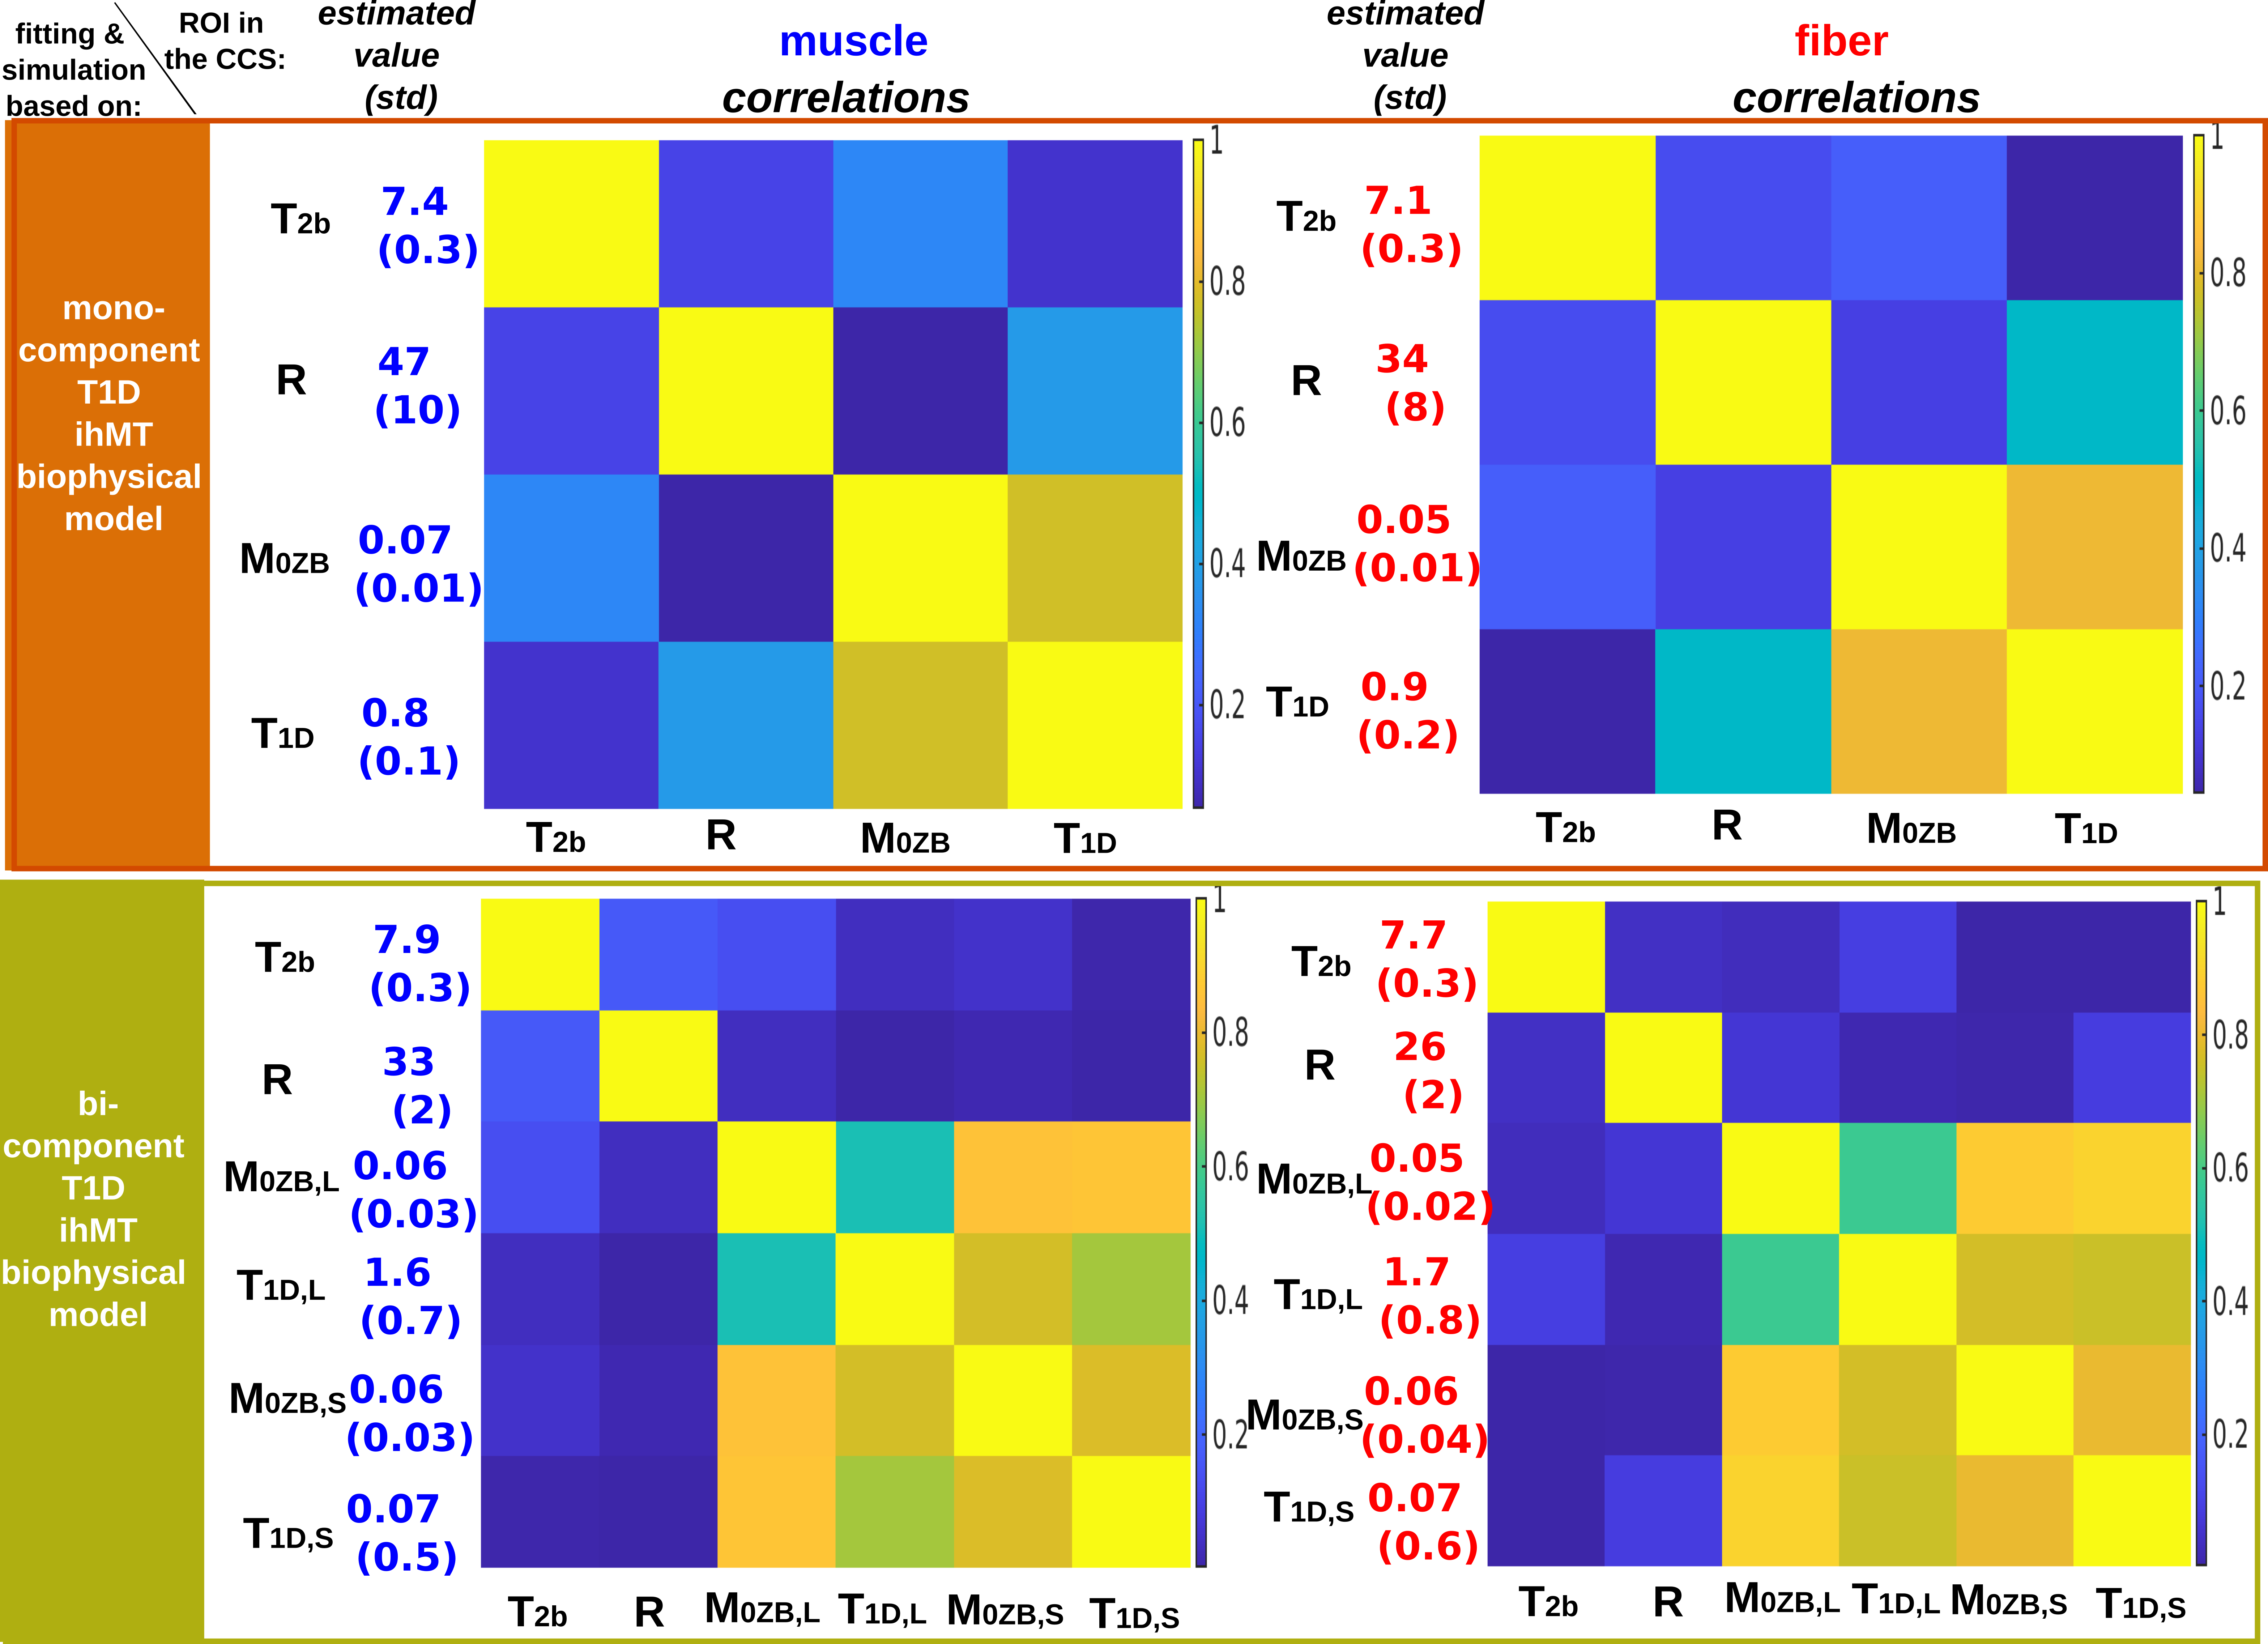
Figure 4
Correlation matrices corresponding to the covariance matrix of each model’s parameters for muscle ROI (left) and the fiber ROI (right). Values (standard deviation) of parameters estimated from the 2 models are provided.
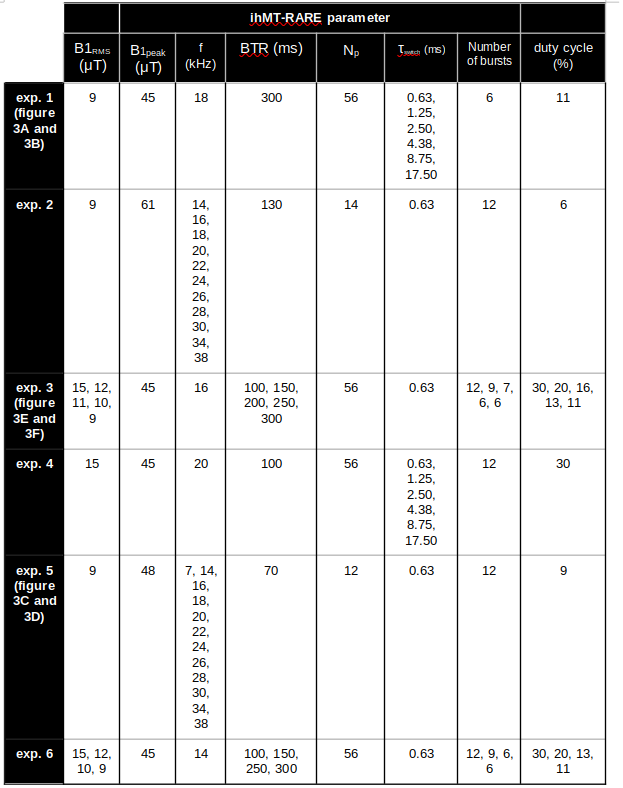
Table 1
ihMT saturation parameters used for the 6 experiments. Common parameters were: pw/Δt=0.5/0.63 ms. B1,RMS is the root mean square saturation power calculated over BTR. The RF duty cycle is defined as DC=Np*pw/BTR.