1632
Imaging sequence and gender impact on quantitative MRI thresholds for traumatic bone oedema.1Clinical and Research Imaging Centre, South Australian Health and Medical Research Institute, Adelaide, Australia, 2Jones Radiology, Adelaide, Australia, 3Quantitative Morphology Group, University of Adelaide, Adelaide, Australia
Synopsis
Keywords: Bone, Normal development, Fracture
Motivation: Stress fractures are common in athletic populations causing significant time-lost and potential future complications. Quantitative MRI thresholds have gained popularity but indiscriminate use without careful validation may cause error.
Goal(s): Evaluate impact of imaging sequence, age and gender on diagnosis of traumatic bone oedema.
Approach: Lumbar MRI from high risk screening and symptomatic injuries were imaged using multiple fat-suppressed sequences. A modified water-fat phantom was built mimicking normal and abnormal bone composition.
Results: Up to two-fold variation was evident in signal intensity of oedema between different fat-suppressed sequences, even when normalised. Female athletes showed higher signal intensities but age was not significant.
Impact: Sequence and gender-dependence on bone signal have important clinical implications for the use of absolute intensity or ratios to quantify oedema. Clinical adoption requires more attention to standardisation, calibration or locally derived thresholds to avoid misdiagnosis.
Introduction
MRI is commonly utilised for assessment of bone oedema caused by stress injuries both in screening and diagnosis as well as increasingly to monitor bone healing after fracture. Quantitative thresholds from fat-suppressed images have been applied to the diagnosis of posterior arch stress injuries as well as spondylitis and sacroiliitis. Normal trabecular bone comprises a network of interconnected plates and marrow that adapts with age as haemopoiesis declines. Bone stress and fracture causes increase in interstitial fluid evident histologically (1) and by MR spectroscopy (2). The determinants of contrast and reproducibility of measurement under different imaging conditions is critical for translation of normative values or the application of radiomic and AI models. However, in clinical practice fat suppression is often considered as a collective term with limited emphasis on the impact of different techniques including spectral saturation and inversion.Methods
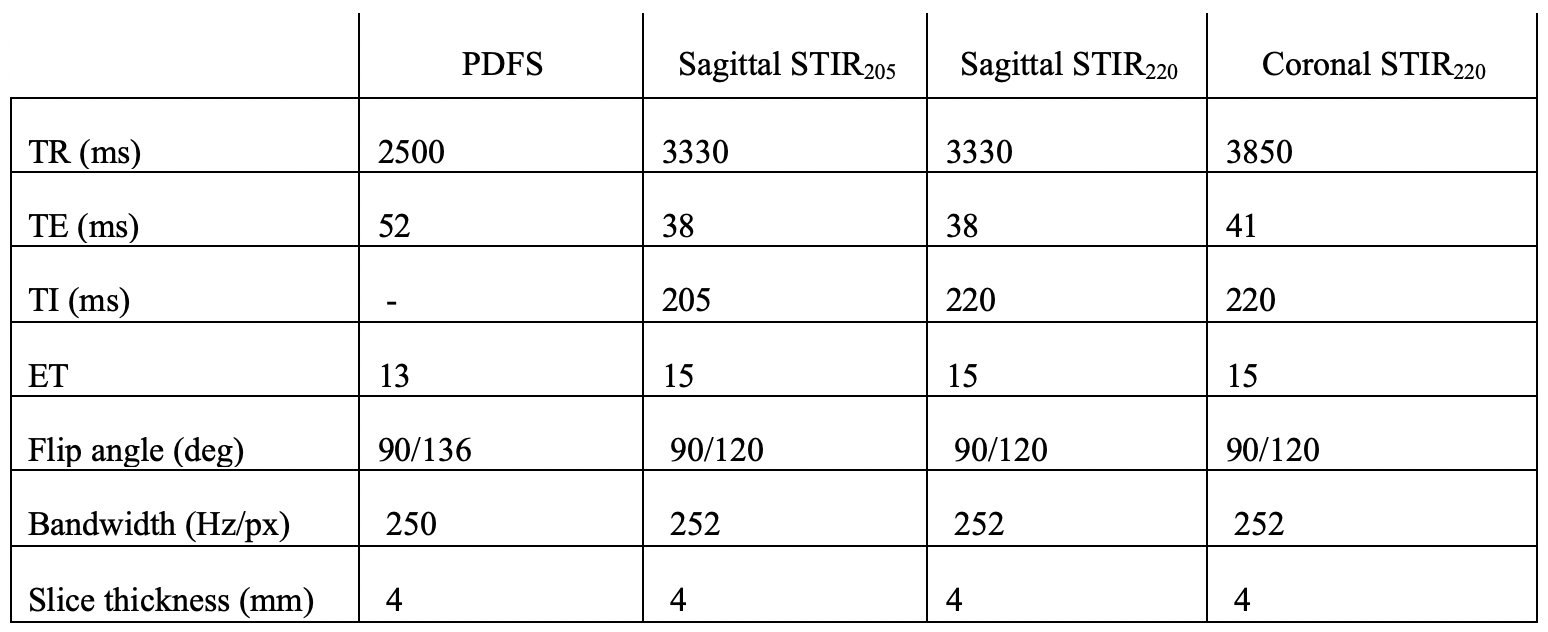
An in-house fat-water phantom comprised of distilled water and castor oil with emulsifiers originally designed for liver fat fraction imaging was adapted as a model of bone marrow with increasing water content. Lumbar MRI was performed on 32 asymptomatic participants and 6 stress injury patients (17 female, 22 male, age range 16-29 years using a 3T MAGNETOM Skyra VE software (Siemens Healthineers, Erlangen, Germany) using four commonly used fat suppression sequences (Table 1). Circular or elliptical regions of interest were drawn in Osirix by an imaging scientist with expertise in bone morphometry and musculoskeletal radiologist with over 10 years of experience in pars imaging. From absolute values, relative indices referenced to normal bone were calculated based on original work of Sims et al (3). Kruskal-Wallis's test was used to compare the difference across MR sequences, and Kendall rank correlation coefficient was calculated between each pair of MR sequences. All statistical analyses were performed in R (R Core Team, 2023).Results
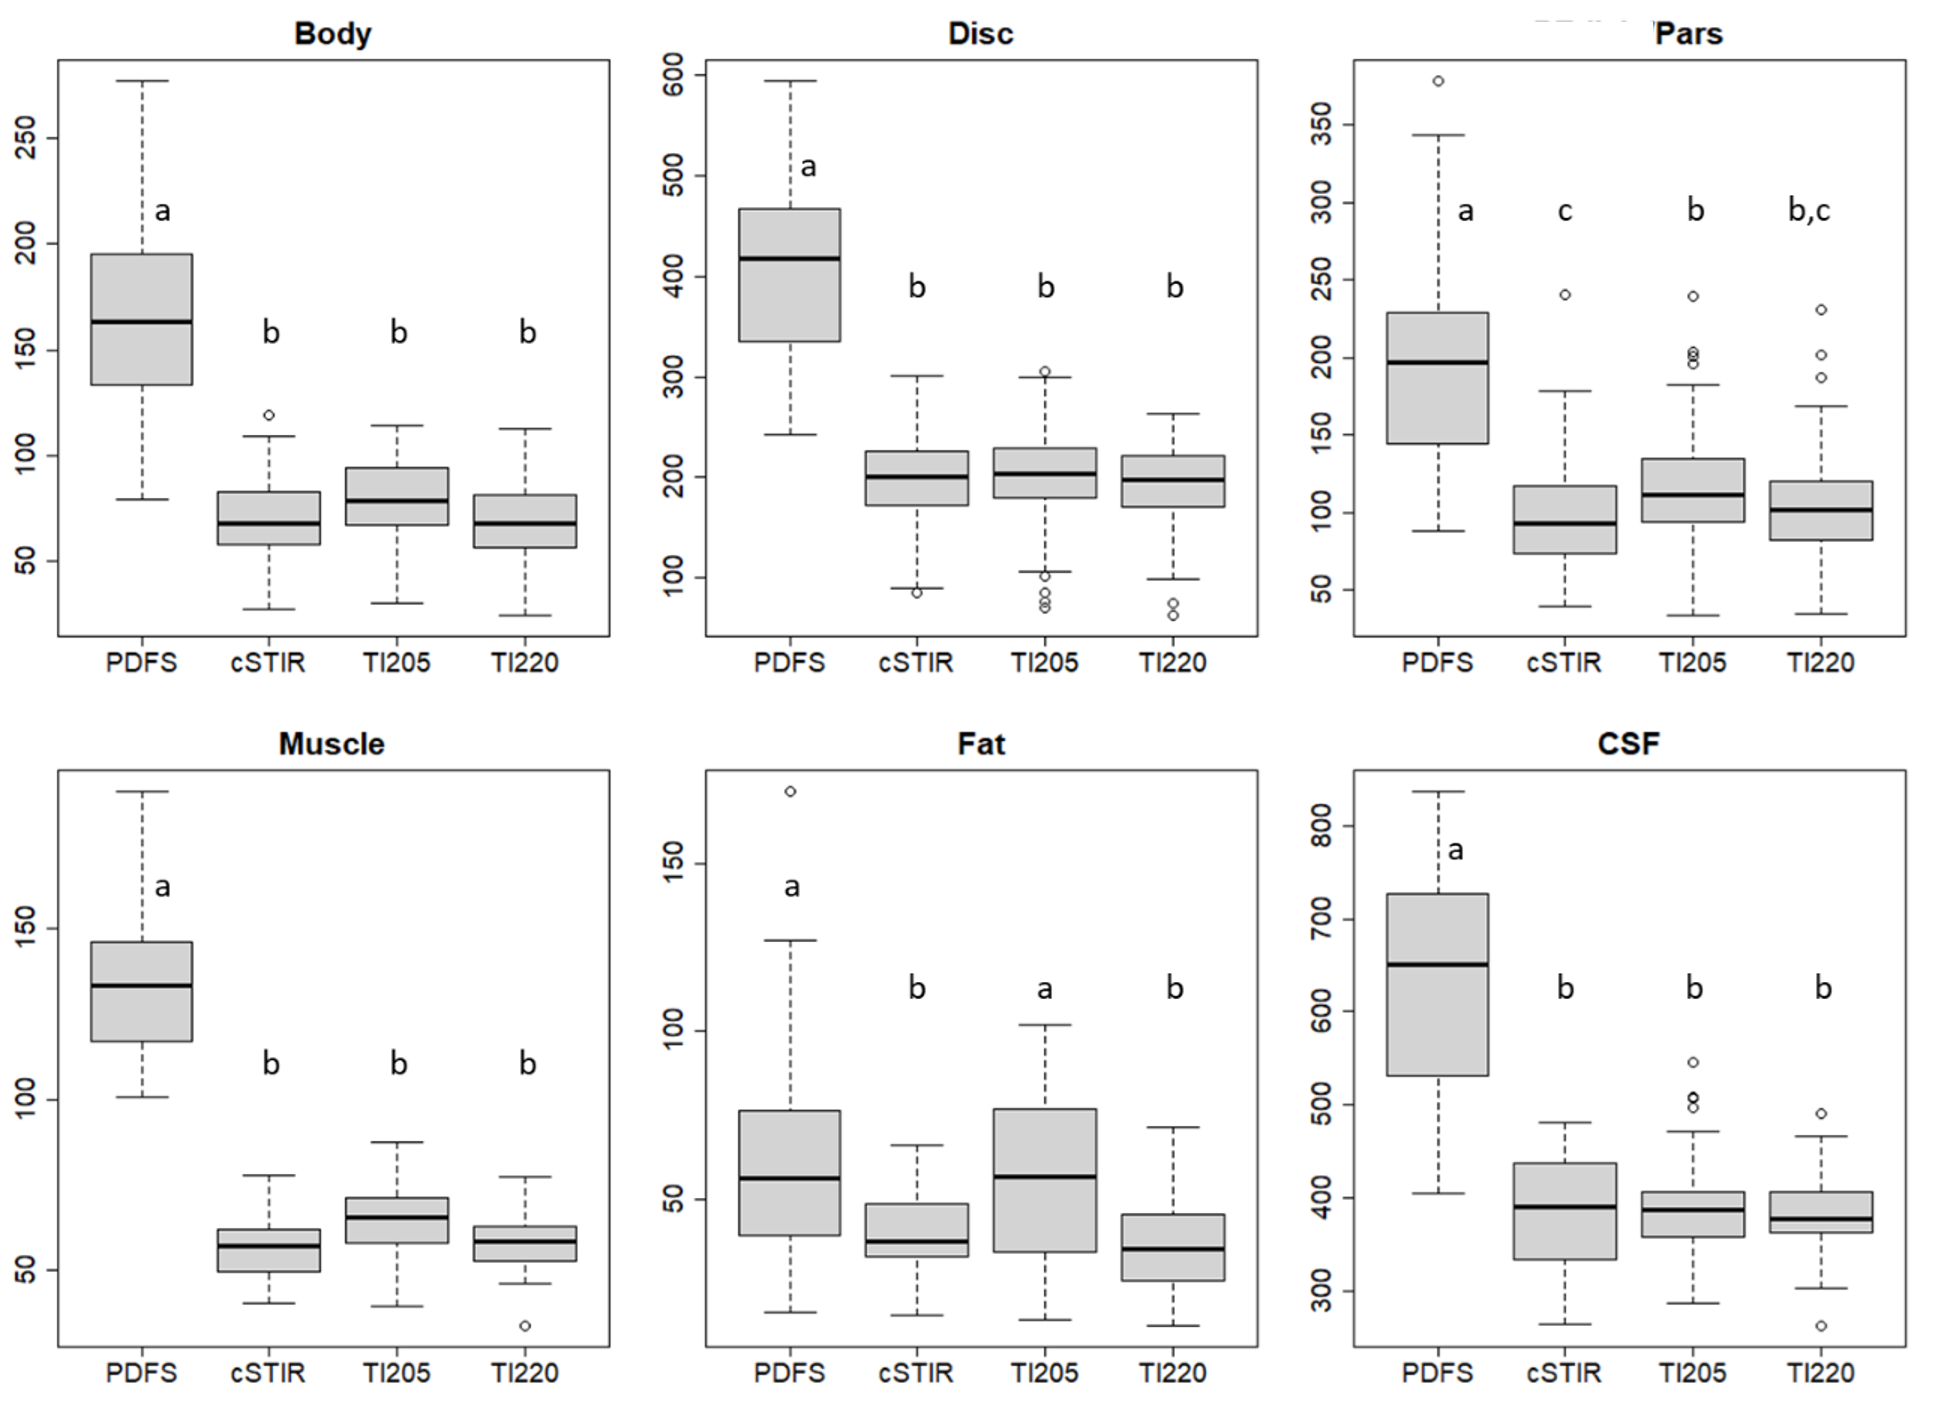
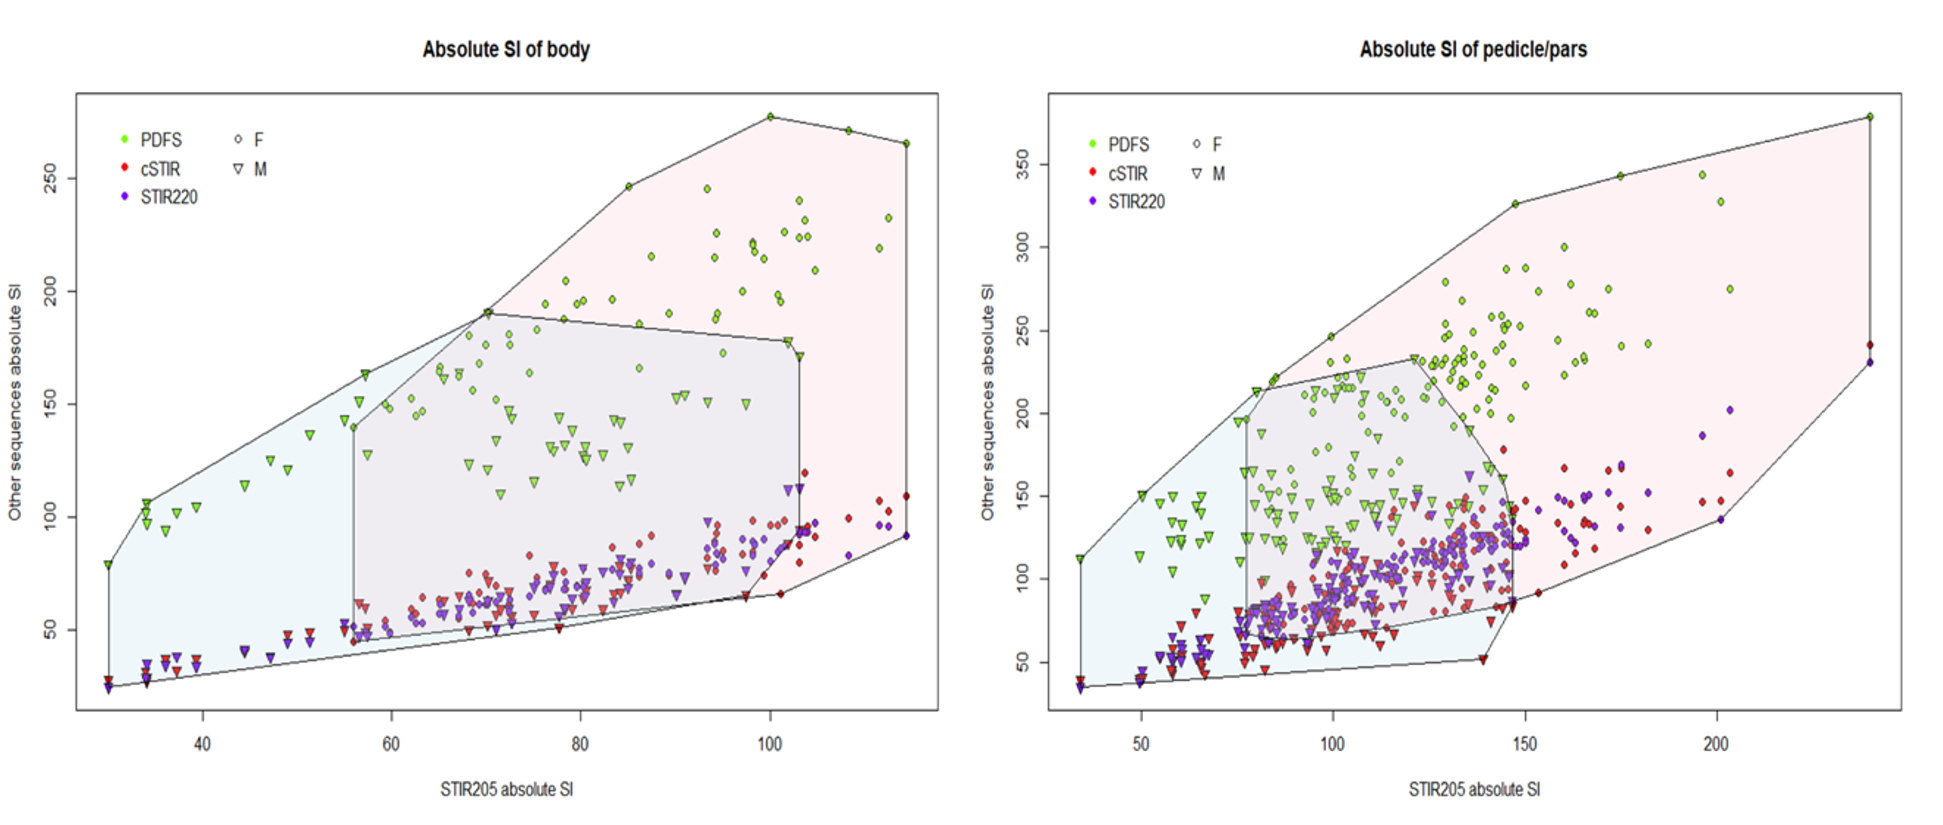
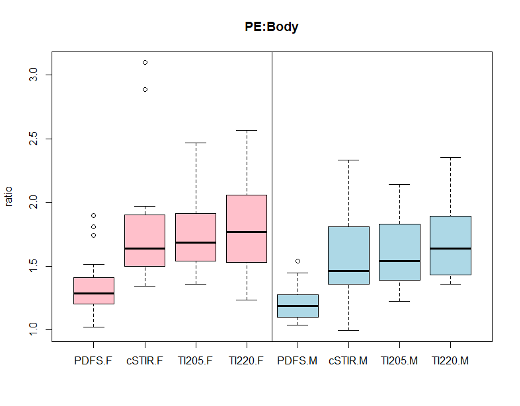
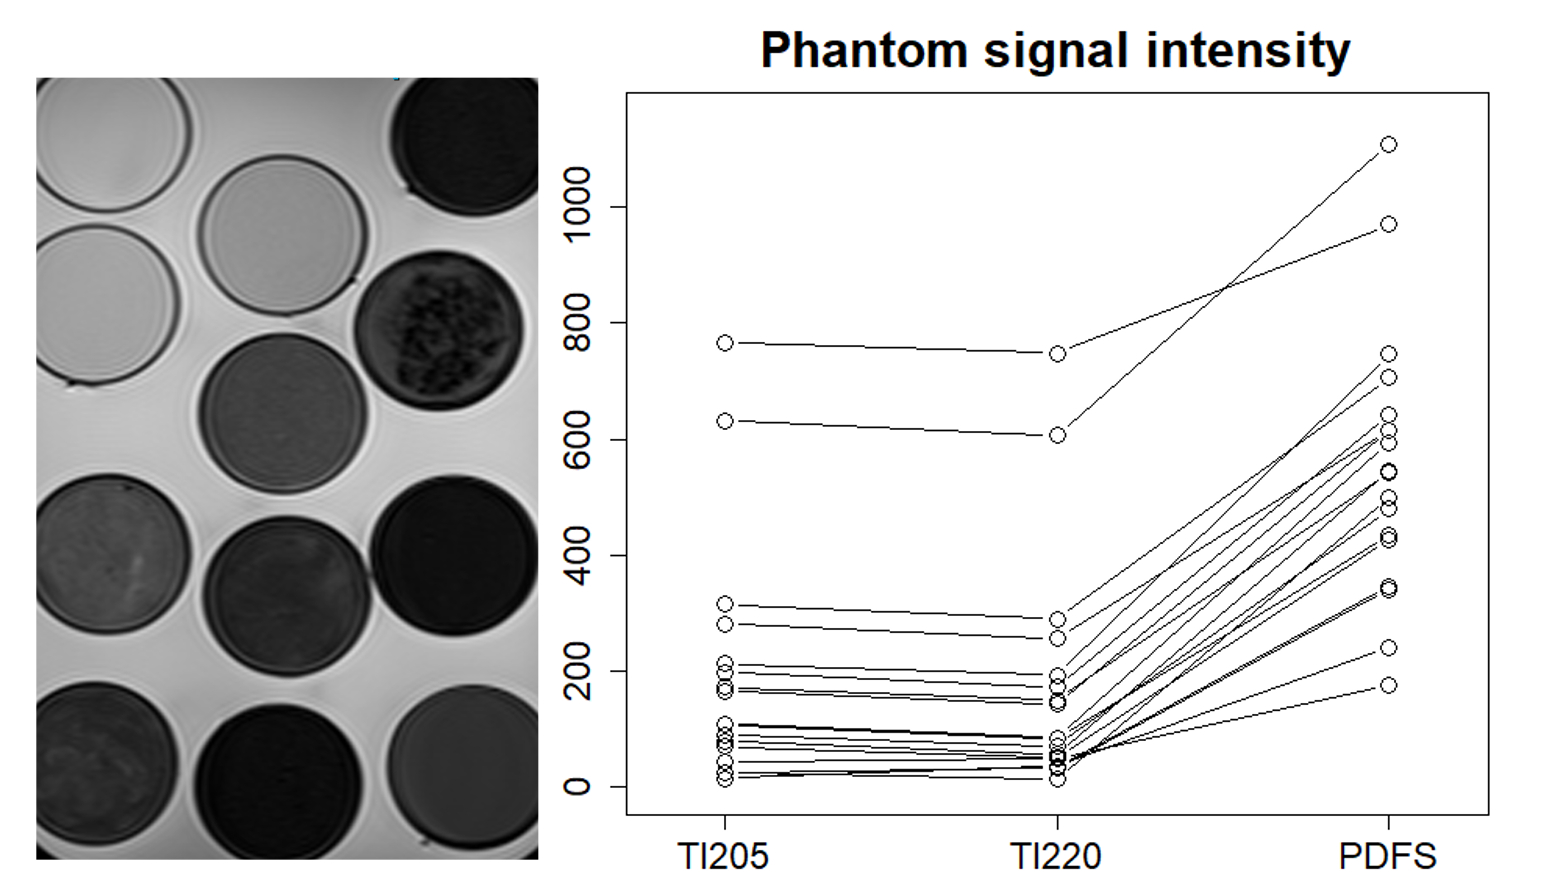
Absolute signal intensities for all vivo tissue classes were dependent on the method of fat suppression (Figure 1) with significant differences between PDFS and STIR but only small magnitude differences within variations of STIR sequence. There was significant between-gender difference with female athletes having higher bone signal intensity on all sequences, particularly PDFS and more dispersion (Figure 2). There was only a mild trend for younger patients to have higher intensity values. Regarding relative indices commonly used to diagnose oedema, in vivo data from patients in the screening cohort showed significant between-sequence differences (Figure 3). When then applied to those with clinically diagnosed oedema, intensity ratio from matched ROI was 3.9 for STIR versus 2.1 for PDFS. This closely mirrors the results from our simplified two-compartment phantom model (Figure 4) where PDFS showed higher signal in all vials but similarly the ratio between the eight regions-of-interest with the highest water (simulating oedematous bone) to the eight with lowest (simulating non-oedematous bone) was 3.9 for STIRTI205, 3.7 for STIRTI220 and 1.6 for PDFS validating the reduced sensitivity for increasing proportion of water.Discussion
Intensity values for normal bone marrow and other tissue classes can vary significantly between spectral suppression and inversion sequences commonly used in musculoskeletal imaging. As with many in vivo biomarkers, the lack of ground truth or biopsy in these patients means no sequence can be deemed true but the historic use of STIR in prior outcome research weights it as a default. Higher signal in females may be explained by differences in haematopoietic marrow. Whilst mitigating variability through normalisation to a reference tissue is appealing, the approach is flawed due to regional heterogeneity and the inherent sensitivity of each sequence for pathologically increased water. Minor modification in STIR parameters of an extent common in clinical practice did not cause meaningful differences. However substitutions between STIR and PDFS creates a high risk of erroneous diagnosis. Of note, we have only assessed technical differences using a single platform and other fat suppression methods also exist. Our comparative data between phantom and patient cohorts suggests a modified water-fat phantom could be used to standardise or calibrate between sequences.Acknowledgements
The authors acknowledge the support of the National Imaging Facility, a National Collaborative Research Infrastructure Strategy (NCRIS) capability of Australia.References
(1) Rangger C, Kathrein A, Freund MC, Klestil T, Kreczy A. Bone bruise of the knee: histology and cryosections in 5 cases. Acta Orthop Scand 1998;69:291–4.
(2) Li X, Ma BC, Bolbos RI, et al. Quantitative assessment of bone marrow edema-like lesion and overlying cartilage in knees with osteoarthritis and anterior cruciate ligament tear using MR imaging and spectroscopic imaging at 3 Tesla. 2008. JMRI Aug;28(2):453-461. DOI: 10.1002/jmri.21437.
(3)
Sims K, Kountouris A, Stegeman JR, Rotstein AH,
Beakley D, Saw AE, et al. MRI bone marrow oedema signal intensity: A reliable
and valid measure of lumbar bone stress injury in elite junior fast bowlers.
Spine, 2019.
Figures