1626
Validation of GRAPPATINI T2 mapping for detection of structural and biochemical changes in cartilage of ACLR patients1Radiology, Huashan Hospital, Fudan University, Shanghai, China, 2Sports Medicine, Huashan Hospital, Fudan University, Shanghai, China, 3MR Research Collaboration, Siemens Healthineers Ltd., Shanghai, China, 4Application Developments, Siemens Shenzhen Magnetic Resonance Ltd., 518057 Shenzhen, China, Shanghai, China, 5Siemens Healthineers AG, Forchheim, Berlin, Germany, 6LTS5, Ecole Polytechnique Fédérale de Lausanne (EPFL), Lausanne, Switzerland, 7Department of Radiology, Lausanne University Hospital and University of Lausanne, Lausanne, Switzerland, 8Advanced Clinical Imaging Technology, Siemens Healthineers International AG, Lausanne, Switzerland
Synopsis
Keywords: Cartilage, MSK
Motivation: The study validated a non-invasive quantitative MR imaging for evaluating cartilage prognostic status after anterior cruciate ligament reconstruction (ACLR) as a technique against arthroscopic and histological measures.
Goal(s): To find the non-invasive biomarkers that can guide treatments and limit post-traumatic osteoarthritis (PTOA) in ACLR patients via quantitative cartilage morphometry analysis and biochemical assessments using GRAPPATINI T2 mapping.
Approach: This was a retrospective cohort study with level II evidence.
Results: Most knee cartilage subregions were thicker, larger in volume, and had higher T2 values in ACLR patients than in healthy controls. Partial cartilage parameters were significantly correlated with clinical scores.
Impact: Quantitative MRI parameters of cartilage could significantly advance non-invasive diagnosis, prognostication, and personalized management of cartilage degeneration.
Introduction
Anterior cruciate ligament (ACL) injuries often lead to post-traumatic osteoarthritis (PTOA), causing long-term pain and disability. Up to 87% of patients develop PTOA after ACL rupture [1-2]. As cartilage degeneration is a hallmark of PTOA [3-4], early detection of cartilage changes after ACL reconstruction (ACLR) could enable better prognostication and treatment to prevent progression to severe osteoarthritis (OA).An accelerated T2 mapping MRI technique called GRAPPATINI has been proposed [5] and applied for knee cartilage [6]. In this study, we applied GRAPPATINI in ACLR patients to quantitatively assess their cartilage matrix composition changes. The morphological properties including cartilage thickness and volume were efficiently analyzed via a semi-automated segmentation software. By comparing ACLR patients to healthy controls, we determined the ability of these imaging biomarkers to detect subtle structural and biochemical cartilage changes at 6 months after ACLR. Clinical outcome scores were also analyzed.
Method
Twenty-five patients with ACLR and twenty-five propensity-matched individuals without ACLR were enrolled. Each participant’s operated knee joint was scanned via MRI using a 3 T MRI scanner (MAGNETOM Prisma, Siemens Healthineers AG, Erlangen, Germany) with a 15-channel Tx/Rx knee coil. Participants were required to rest in a sitting position for 30 minutes before knee joint MRI to ensure that the cartilage was stable during the scan. Table 1a shows the demographic data of participants in the normal control (NC) and ACLR groups. Table 1b shows the MRI sequences and parameters. The morphological imaging included coronal, axial, sagittal fat-sat, proton-density-weighted (PDWI) and axial T1WI sequences. The research application GRAPPATNI T2 mapping sequence was performed in sagittal orientation to quantitatively analyze the knee joint cartilage and the T2 maps were generated inline. The post-processing research application (MRChondralHealth v2.1.0, Siemens Healthineers AG, Forchheim, Germany) was used for segmentation of the cartilage [7]. Patients with ACLR underwent clinical scoring, including the Tegner, Lysholm, 2000 International Knee Documentation Committee, and MOCART 2.0 scales. The tibiofemoral and patellofemoral cartilage in the knee joint were divided into 21 subregions according to anatomical structure to measure their thickness and volume. Each cartilage subregion was further divided into three layers according to thickness to measure the T2 values. Either the Student’s t-test or the nonparametric Mann-Whitney U test was used to analyze the differences in cartilage subregional thickness, volume, and T2 values between groups. Pearson correlation analysis was used to test the correlations between cartilage parameters and clinical scales.Results
1. Segmentation: Automated segmentation with manual correction was much faster than fully manual segmentation (~8min vs 1 hour per case) (Fig. 1).2. Structural Changes: Cartilage was thicker in ACLR group compared to controls in 14 subregions, mainly in patellofemoral and medial tibiofemoral areas. Cartilage volume was larger in ACLR group in femur, tibia, patella, and 19 subregions (Table 2a-b).
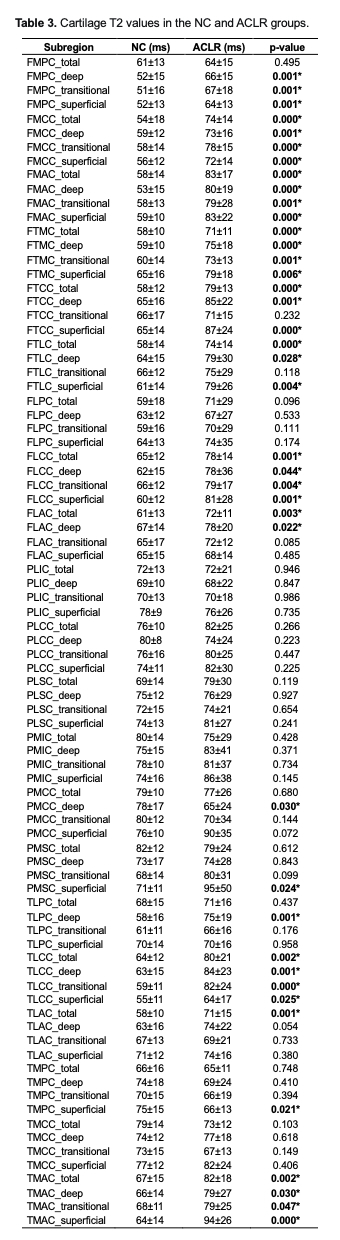
3. Biochemical Changes T2 values were significantly higher in the ACLR group in 40/84 subregions, indicating cartilage matrix changes. Differences were most significant in superficial and deep layers. Higher T2 values suggest collagen disruption and increased hydration (Table 3).
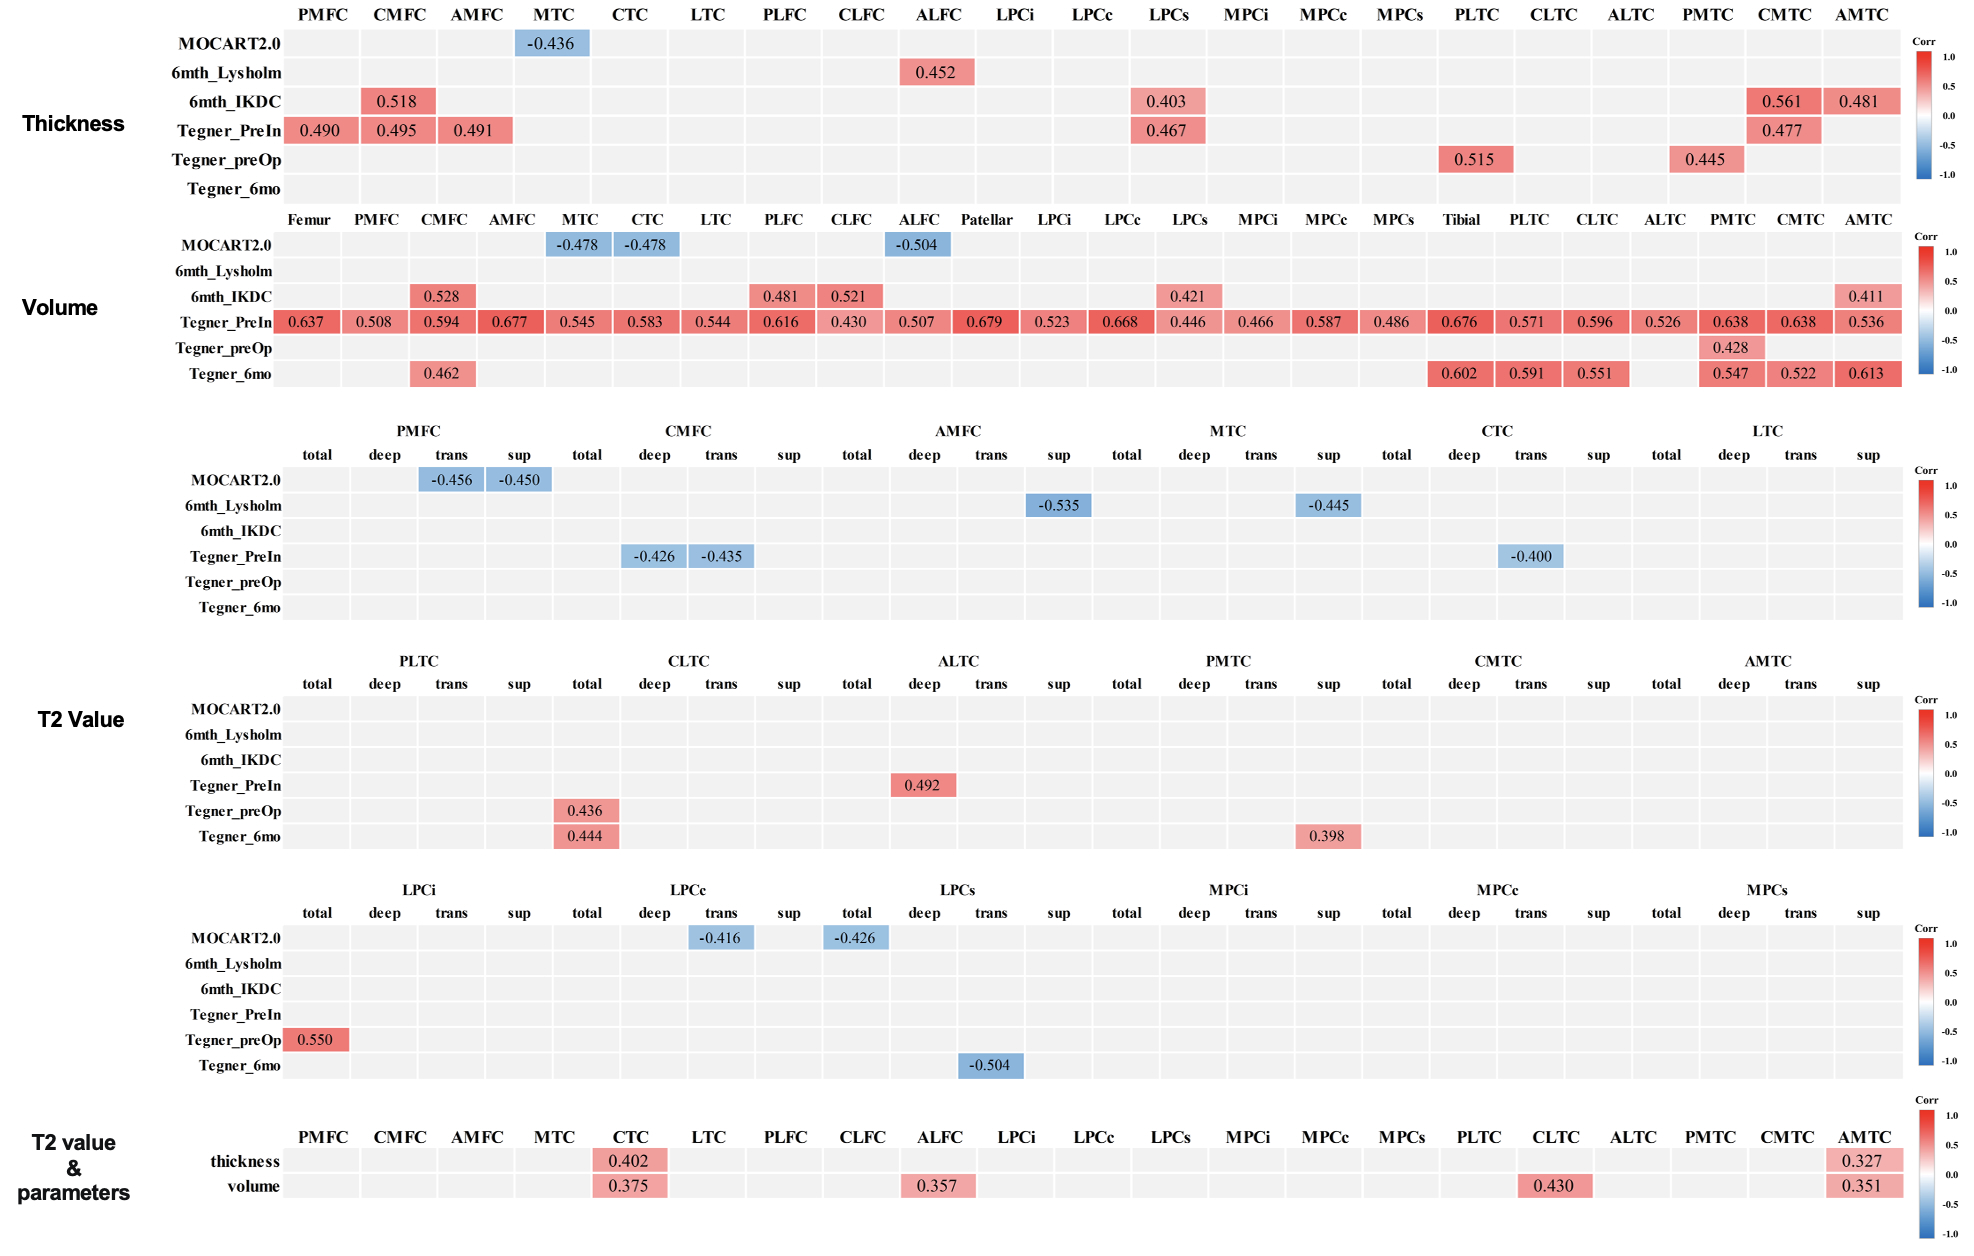
4. Correlations: The thickness of several subregions correlated positively with clinical scores. The volume of femoral, tibial, and patellar subregions correlated with clinical scores. Higher T2 values correlated negatively with clinical scores in some subregions. Some subregions showed correlations between T2 values and thickness/volume. (Fig. 2).
Discussion
GRAPPATINI T2 mapping allowed accelerated quantification of cartilage collagen organization and hydration through T2 relaxation times. Meanwhile, the automated segmentation technique enabled expedited analysis of morphological properties including cartilage thickness and volume.At 6 months post-surgery, significant increases were observed in both T2 values and thickness/volume across many cartilage subregions. Elevated T2 measures indicated alterations in collagen matrix and hydration, reflecting early degenerative processes. Conversely, greater thickness and volume may have resulted from initial reparative cell proliferation and matrix synthesis. Changes were most prominent in the superficial and deep layers.
Counterintuitively, some subregions exhibited reduced T2 values, which may be attributed to increased collagen production temporarily improving cartilage integrity. However, few correlations occurred between structural and compositional metrics.
Conclusion
This preliminary study introduced an innovative MRI analysis pipeline to efficiently provide quantitative structural and functional biomarkers of cartilage health after ACLR. Broader implementation and validation of this methodology in sizable ACLR cohorts will now help establish its utility for sensitive diagnosis, monitoring, and guided treatment of PTOA.Acknowledgements
The MRI sequence and software for this study were supported by Siemens Healthcare AG.References
[1] Wang LJ, Zeng N, Yan ZP, Li JT, Ni GX. Post-traumatic osteoarthritis following ACL injury. Arthritis Res Ther. 2020;22(1):57.
[2] Khella CM, Asgarian R, Horvath JM, Rolauffs B, Hart ML. An Evidence-Based Systematic Review of Human Knee Post-Traumatic Osteoarthritis (PTOA): Timeline of Clinical Presentation and Disease Markers, Comparison of Knee Joint PTOA Models and Early Disease Implications. Int J Mol Sci. 2021;22(4).
[3] Peterfy CG, Gold G, Eckstein F, et al. MRI protocols for whole-organ assessment of the knee in osteoarthritis. Osteoarthritis Cartilage. 2006;14 Suppl A: A95-111.
[4] Welsch GH, Mamisch TC, Hughes T, et al. Advanced morphological and biochemical magnetic resonance imaging of cartilage repair procedures in the knee joint at 3 Tesla. Semin Musculoskelet Radiol. 2008;12(3):196-211.
[5] Hilbert T, Sumpf TJ, Weiland E, et al. Accelerated T2 mapping combining parallel MRI and model-based reconstruction: GRAPPATINI. J Magn Reson Imaging. 2018;48(2):359-368.
[6] Roux M, Hilbert T, Hussami M, et al. MRI T2 Mapping of the Knee Providing Synthetic Morphologic Images: Comparison to Conventional Turbo Spin-Echo MRI. Radiology. 2019;293(3):620-630.
[7] Fripp J, Crozier S, Warfield SK, Ourselin S. Automatic segmentation and quantitative analysis of the articular cartilages from magnetic resonance images of the knee. IEEE Trans Med Imaging. 2010;29(1):55-64.
Figures
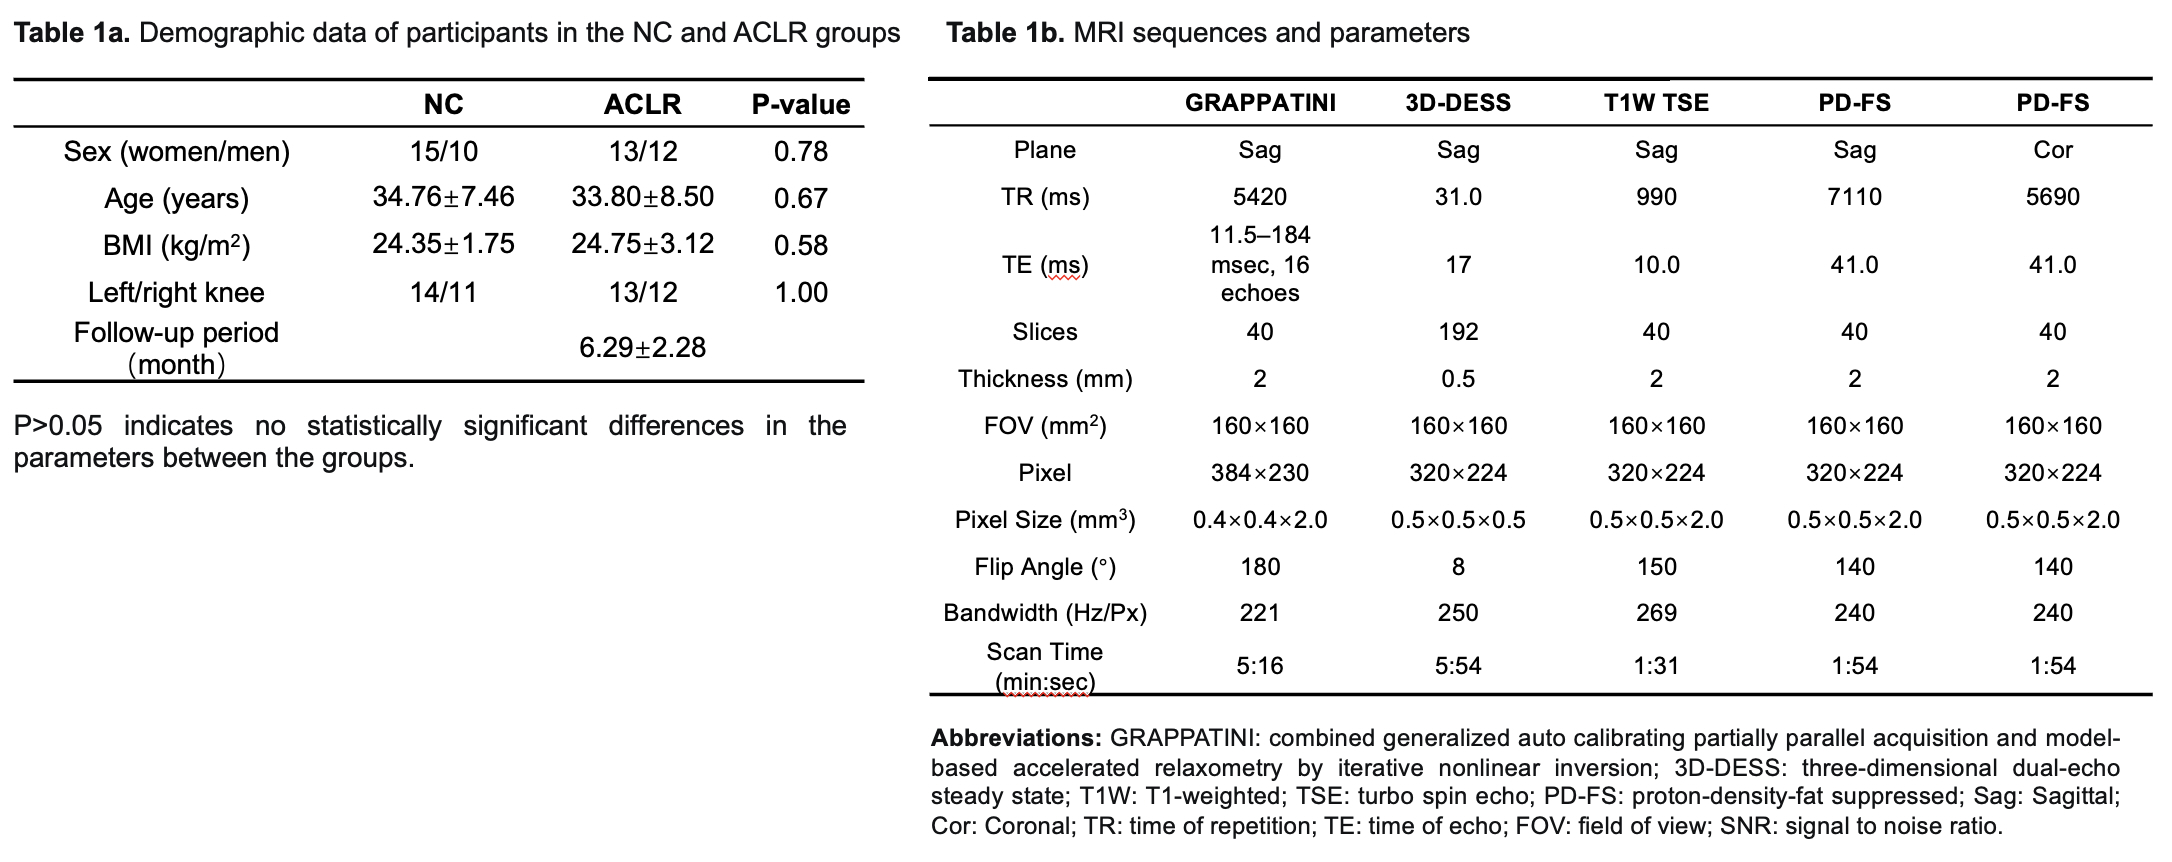
Table 1a. Demographic data of participants in the NC and ACLR groups
Table 1b. MRI sequences and parameters
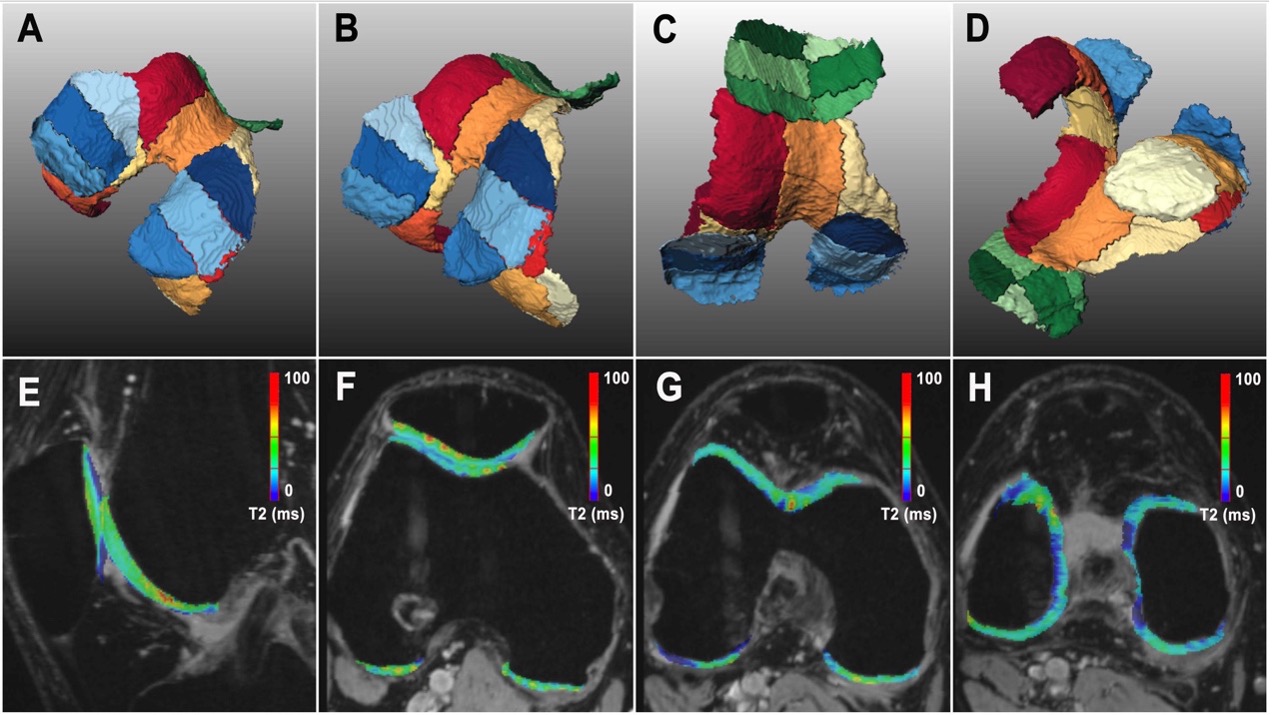
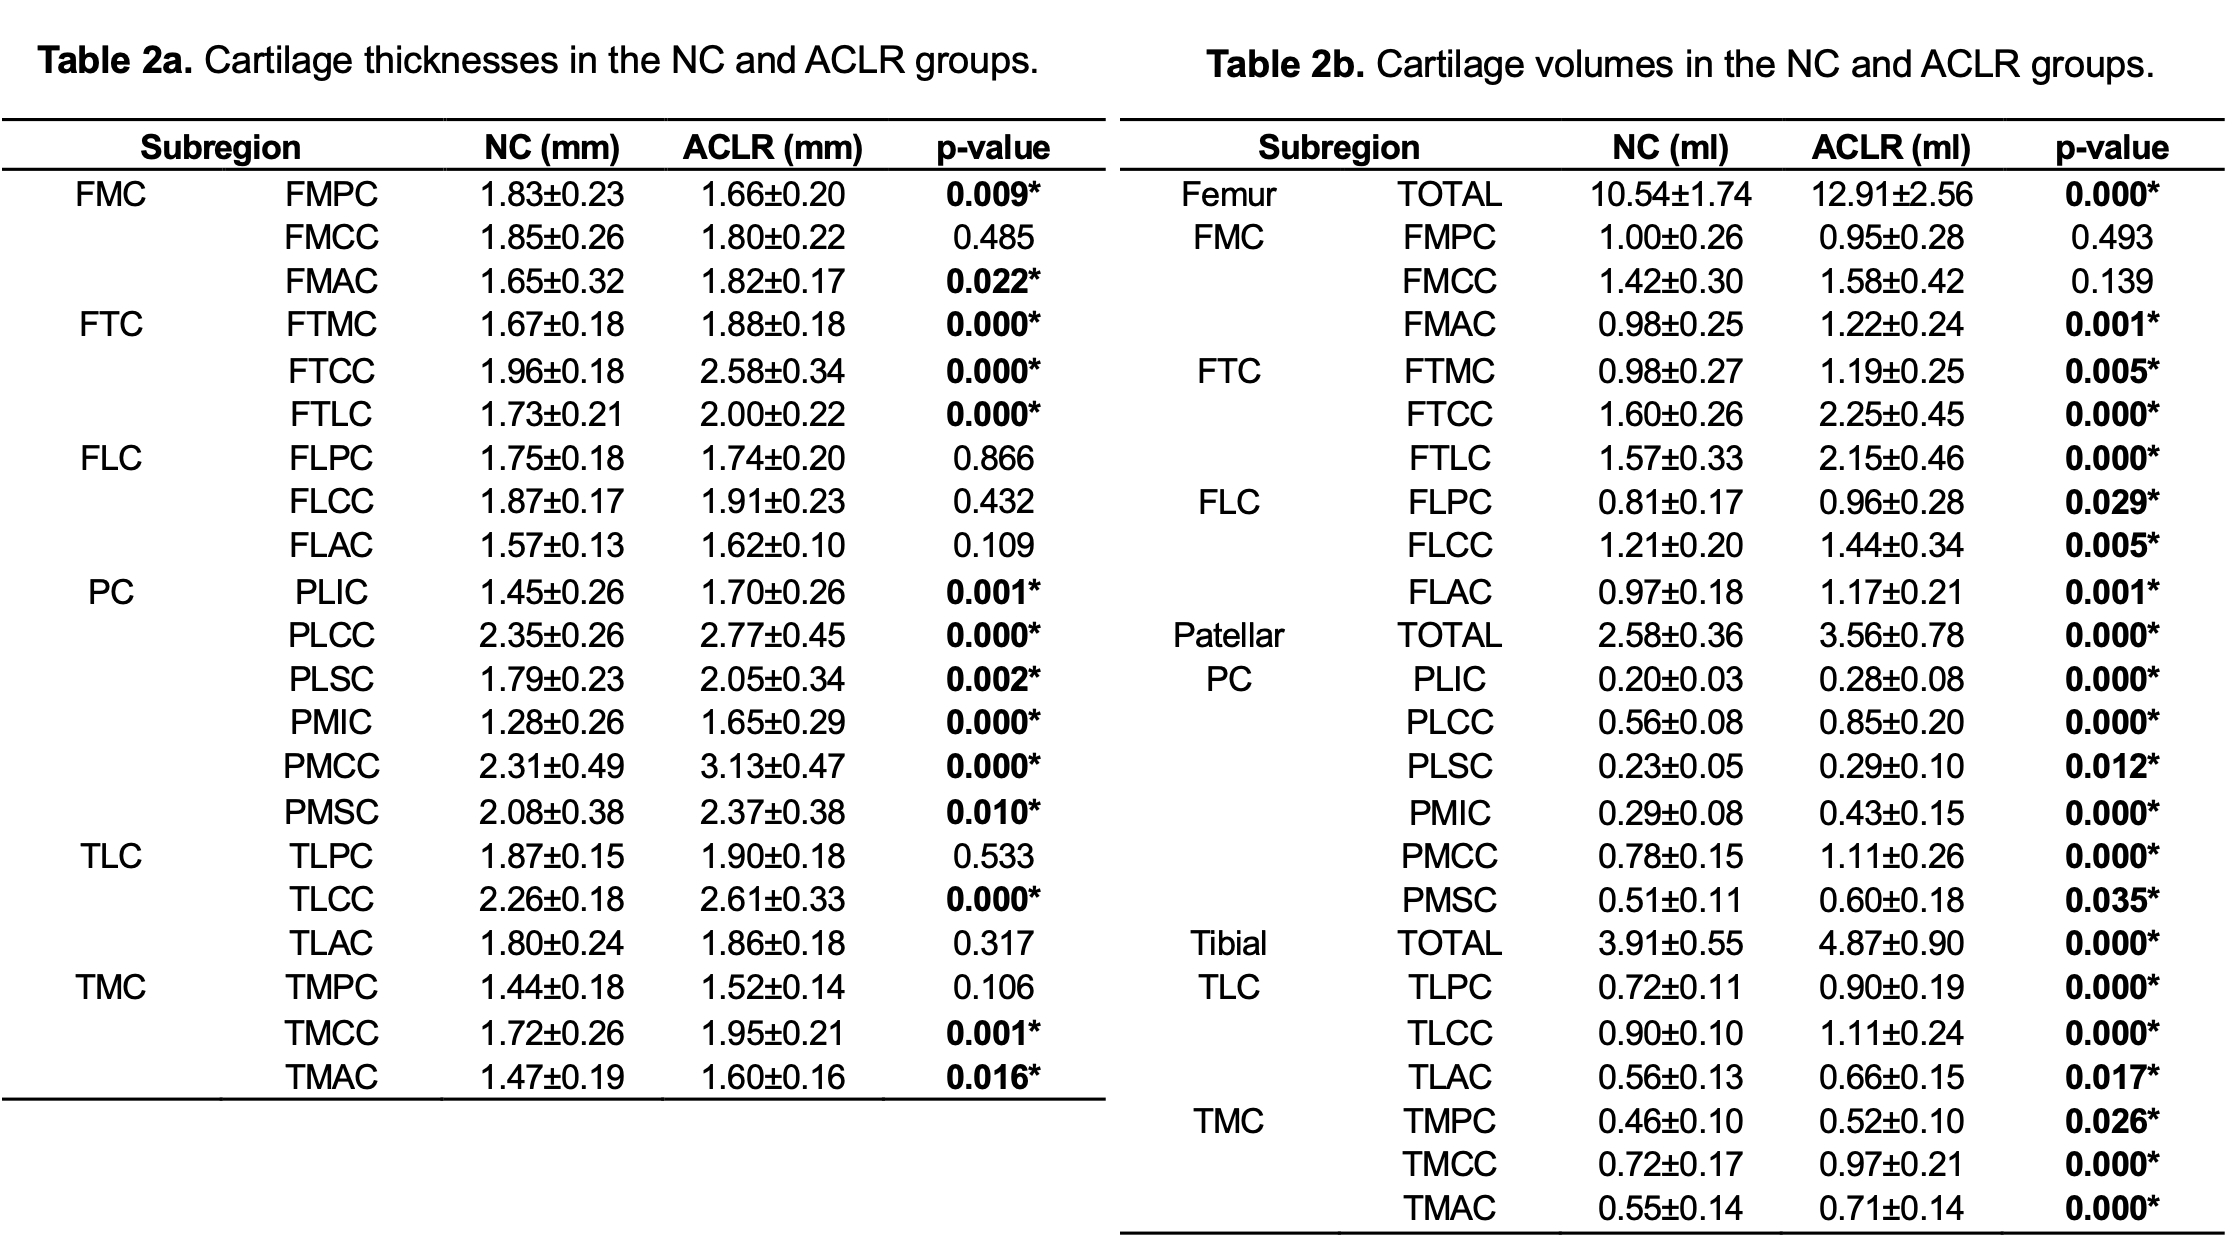
Table 2a. Cartilage thicknesses in the NC and ACLR groups. Data are presented as means ± SD. *P<0.05 indicates statistically significant differences in the cartilage thickness between groups.
Table 2b. Cartilage volumes in the NC and ACLR groups. Data are presented as means ± SD. *P<0.05 indicates statistically significant differences in the cartilage volume between groups.