1622
Overcoming challenges of quantitative susceptibility mapping in moderate-to-severe TBI patients1Cognitive Neuroscience Unit, Deakin University, Melbourne, Australia, 2School of Information Technology and Electrical Engineering,, The University of Queensland, Brisbane, Australia, 3Department of Emergency Medicine, St. Vincent’s Hospital, Melbourne, Australia, 4Siemens Healthcare, Brisbane, Australia, 5Centre for Advanced Imaging, The University of Queensland, Brisbane, Australia
Synopsis
Keywords: Quantitative Imaging, Quantitative Susceptibility mapping, lesion filling, individualised profiling
Motivation: Quantitative susceptibility mapping (QSM) is being increasingly used to investigate pathophysiological changes in traumatic brain injury (TBI). However, generating artefact-free quantitative susceptibility maps in brains with large focal lesions, as in the case of moderate-to-severe TBI (ms-TBI), is particularly challenging.
Goal(s): To generate artefact-free quantitative susceptibility maps in moderate-to-severe TBI patients with large focal lesions.
Approach: We utilized a novel two-pass masking technique and reconstruction procedure in combination with a recently developed virtual brain grafting tool for brain repair.
Results: Our innovative approach allowed us to generate artefact-free personalised QSM profiles of individual ms-TBI patients with reference to a sample of healthy controls.
Impact: We outline an approach to obtain magnetic susceptibility values in the presence of large focal lesions and provide a framework to generate personalised QSM profiles that may be used by clinicians to characterise TBI pathophysiology or implement neuroscience-guided rehabilitation programs.
Background
Emerging evidence suggests that traumatic brain injury (TBI) is a major risk factor for developing neurodegenerative disease later in life. Recently, quantitative susceptibility mapping (QSM) has been shown to be a promising tool in the investigation of neurodegenerative disease mechanisms, such as iron accumulation, calcium deposits, and demyelination (see review1) QSM has been used by an increasing number of studies investigating pathophysiological changes in (mostly mild) TBI1. However, very few clinical QSM studies have been conducted in moderate-to-severe TBI (ms-TBI) because generating artefact-free quantitative susceptibility maps in brains with large focal lesions is particularly challenging. In the present study, we implemented a novel solution, a two-pass masking technique and reconstruction procedure to generate quantitative susceptibility maps (QSMxT)2 in combination with virtual brain grafting (VBG) for brain repair3, to reliably obtain magnetic susceptibility values in ms-TBI. In addition, there is an increasing number of studies highlighting the importance of single-subject analyses4,5,6, which represent a growing recognition that traditional group analyses cannot adequately reflect what happens in individual patients or handle between-patient heterogeneity. We therefore used QSMxT and VBG to generate personalised QSM profiles of individual patients with reference to a sample of healthy controls.Methods
Chronic ms-TBI patients (N=8; five males, age range: 29-60 years, 42 ±12 years) and healthy controls, HC (N=12; five males, age range: 25-64 years, 35.7 ±14.4 years) underwent GRE (TR = 52ms, TE = 7.38/14.76/22.14/29.52/36.9/44.27ms, FA = 15º, 144 slices, FOV = 256mm, 1mm3 isotropic voxels), and MPRAGE scanning (TR = 2100ms, TE = 2.22ms, FA = 8º, 208 contiguous slices, FOV =256mm, 0.8x0.8x0.8mm3 voxels) on a 3T Siemens MAGNETOM Prisma scanner. We utilized QSMxT (v1.1.9) together with VBG to generate artifact-free quantitative susceptibility maps and to improve automated delineation of brain areas (done with FreeSurfer v7.2) (Figure 1). We then extracted values of magnetic susceptibility in grey matter (GM) regions across the whole brain and determined if they deviate from a reference HC group [Z-score < -3.43 or > 3.43, relative to the HC mean], with the aim of obtaining personalised QSM profiles. Using the NumART2* algorithm7, we also measured R2* values across regions found to have altered susceptibility values to disentangle the effects of iron accumulation, calcium deposits, and demyelination.Results
Using QSMxT we were able to generate susceptibility maps with a substantial increase in quality and reduction in artefacts irrespective of the presence of large focal lesions (Figures 2 and 3). In addition, VBG minimised the loss of GM regions and exclusion of patients due to the presence of a lesion. Our findings revealed that each TBI patient had a distinctive, spatially heterogeneous set of GM regions for which magnetic susceptibility differed from HC (Figure 4). This included both increases and decreases in susceptibility values in multiple GM regions across the brain. Altered R2* values were observed in a small proportion of regions with altered susceptibility values, both in the same and opposite direction as susceptibility changes in those regions. One patient, for example, exhibited increased magnetic susceptibility in the right superior frontal gyrus, and in the left frontal pole and caudal anterior cingulate gyrus. In this patient we also observed decreased magnetic susceptibility in the right accumbens, and the left lateral and medial orbitofrontal gyri. This patient also exhibited reduced R2* in the right superior frontal gyrus that, alongside an increase in susceptibility in this structure, points to substantial loss in cortical myelin. An increase in susceptibility alongside a reduction in R2* can be attributed to myelin loss, as this can be expected to make the average estimated susceptibility more positive.Conclusion
We report on a study of personalised QSM profiling in ms-TBI patients. We were able to implement a novel approach to reliably obtain magnetic susceptibility values in ms-TBI that was successful in suppressing artefacts even in the presence of large focal lesions and reducing failures in delineation of GM areas. Applying our approach to generate QSM profiles revealed that magnetic susceptibility measures were altered, relative to HC, in a wide array of GM regions, which differed across TBI patients. In combination with R2* data, we were able to provide evidence indicating that the changes in GM susceptibility variously reflect alterations in iron accumulation, myelin loss and calcification. Future work should incorporate behavioral data (cognitive and motor outcomes) to establish a link between neurodegenerative disease mechanisms and behavioral outcomes. Personalised QSM profiling may be used by clinicians in the future to track the trajectory of TBI pathophysiology or implement neuroscience-guided integrative rehabilitation programs tailored to individual TBI patients to improve their quality of life.Acknowledgements
KC is supported by a Veski Fellowship. The Victorian Near-miss Award Pilot is administered by Veski for the Victorian Health and Medical Research Workforce Project on behalf of the Victorian Government and the Association of Australian Medical Research Institutes. Funding for the Pilot has been provided by the Victorian Department of Jobs, Precincts and Regions. SB and AS acknowledge the Australian Research Council (ARC) Training Centre for Innovation in Biomedical Imaging Technology (project number IC170100035) funded by the Australian Government and funding through ARC Linkage grant LP200301393 with Siemens Healthineers.
References
- Gozt, A., Hellewell, S., Ward, P. G. D., Bynevelt, M., & Fitzgerald, M. (2021). Emerging Applications for Quantitative Susceptibility Mapping in the Detection of Traumatic Brain Injury Pathology. Neuroscience, 467, 218–236. https://doi.org/10.1016/j.neuroscience.2021.05.030
- Stewart, S.W., Robinson, S.D., O’Brien, K., Jin, J., Widhalm, G., Hangel, G., Walls, A., Goodwin, J., Eckstein, K., Tourell, M., Morgan, C., Narayanan, A., Barth, M., Bollmann, S. (2022) QSMxT: Robust masking and artifact reduction for quantitative susceptibility mapping. Magn. Reson. Med., 87, 1289-1300. https://doi.org/10.1002/mrm.29048
- Radwan, A. M., Emsell, L., Blommaert, J., Zhylka, A., Kovacs, S., Theys, T., Sollmann, N., Dupont, P., & Sunaert, S. (2021). Virtual brain grafting: Enabling whole brain parcellation in the presence of large lesions. NeuroImage, 229, 117731. https://doi.org/https://doi.org/10.1016/j.neuroimage.2021.117731
- Attyé, A., Renard, F., Baciu, M., Roger, E., Lamalle, L., Dehail, P., Cassoudesalle, H., & Calamante, F. (2021). TractLearn: A geodesic learning framework for quantitative analysis of brain bundles. NeuroImage, 233, 117927. https://doi.org/10.1016/j.neuroimage.2021.117927
- Clemente, A., Attyé, A., Renard, F., Calamante, F., Burmester, A., Imms, P., Deutscher, E., Akhlaghi, H., Beech, P., Wilson, P. H., Poudel, G., Domínguez D, J. F., & Caeyenberghs, K. (2023). Individualised profiling of white matter organisation in moderate-to-severe traumatic brain injury patients. Brain research, 1806, 148289. https://doi.org/10.1016/j.brainres.2023.148289
- Imms, P., Clemente, A., Deutscher, E., Radwan, A. M., Akhlaghi, H., Beech, P., Wilson, P. H., Irimia, A., Poudel, G., Domínguez Duque, J. F., & Caeyenberghs, K. (2022). Exploring personalized structural connectomics for moderate to severe traumatic brain injury. Network Neuroscience, 1-24. https://doi.org/10.1162/netn_a_00277
- Hagberg, G.E., Indovina, I., Sanes, J.N., Posse, S., 2002. Real-time quantification of T2* changes using multiecho planar imaging and numerical methods. Magnetic Resonance in Medicine, 48(5), 877-882. https://doi.org/10.1002/mrm.10283
Figures
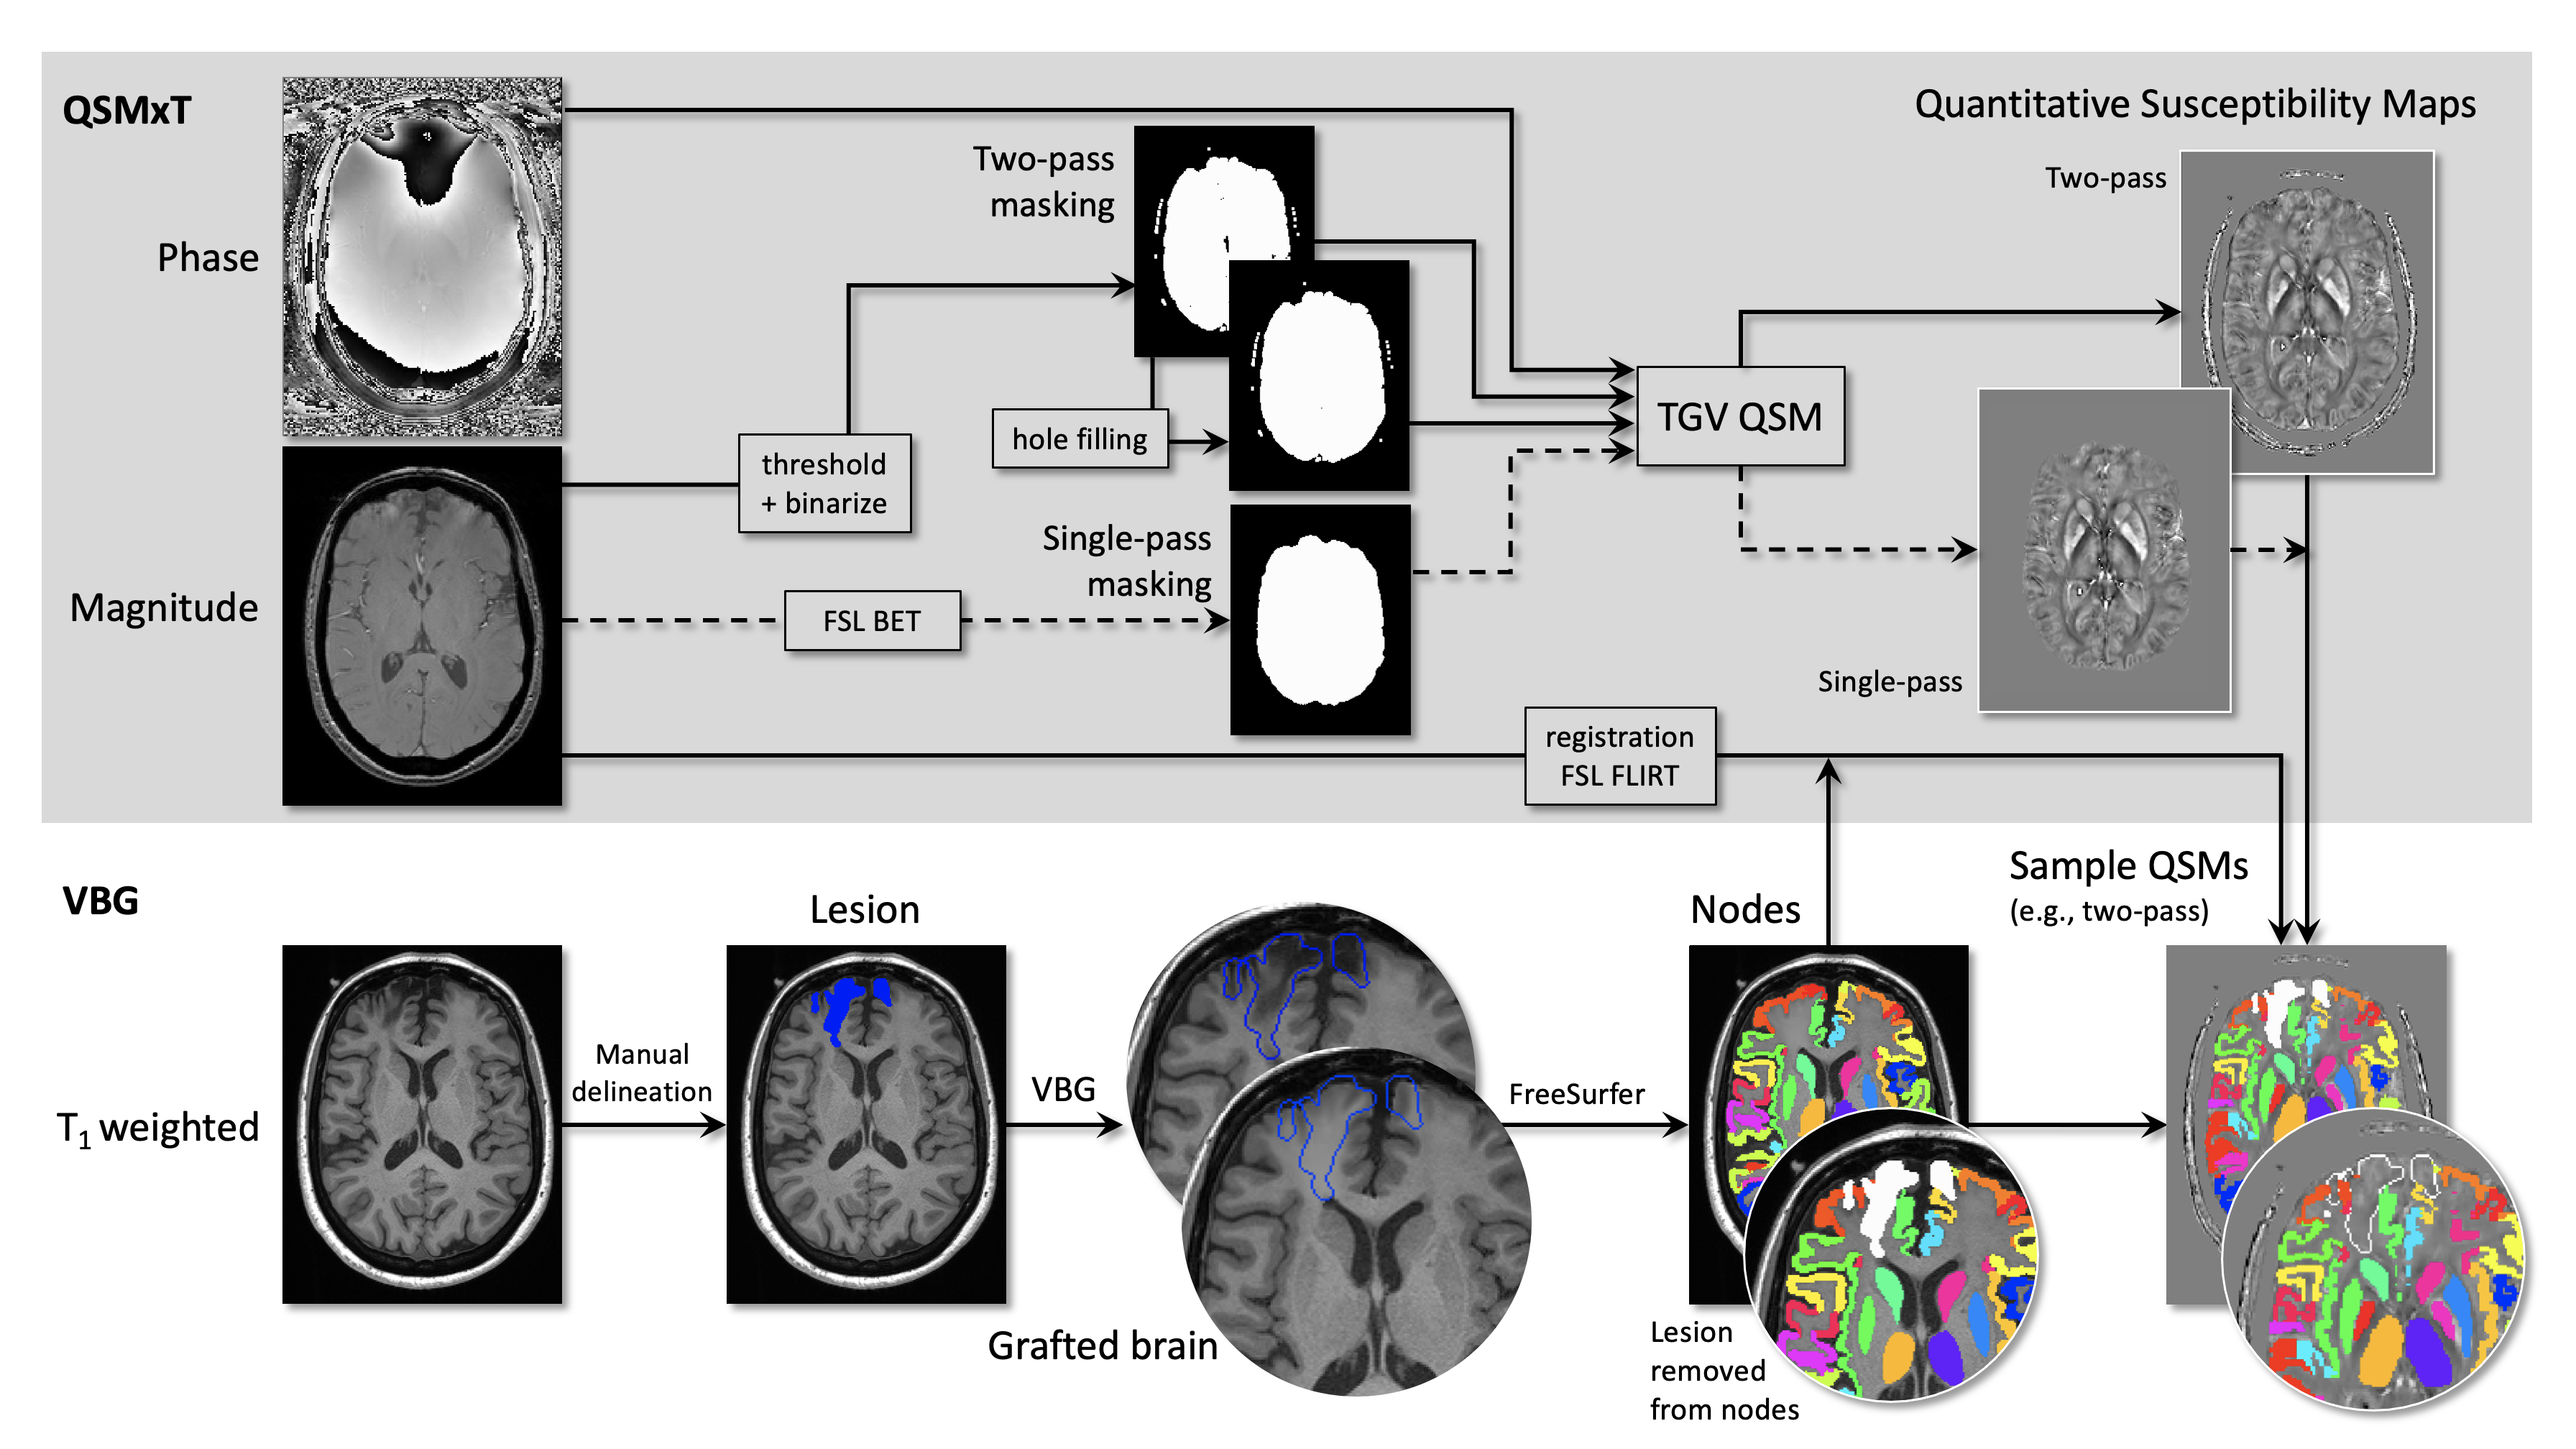
Figure 1. Combined QSMxT and VBG processing pipeline and outputs. Outputs for each subject include masks, parcellations and segmentations from grafted T1-weighted images (VBG nodes), and VBG nodes registered to the quantitative susceptibility map space. The lesion is shown variously in full or as an outline, in blue or white, to facilitate visualization depending on the context. NB: the lesion has been removed from the VBG nodes prior to sampling QSM values.
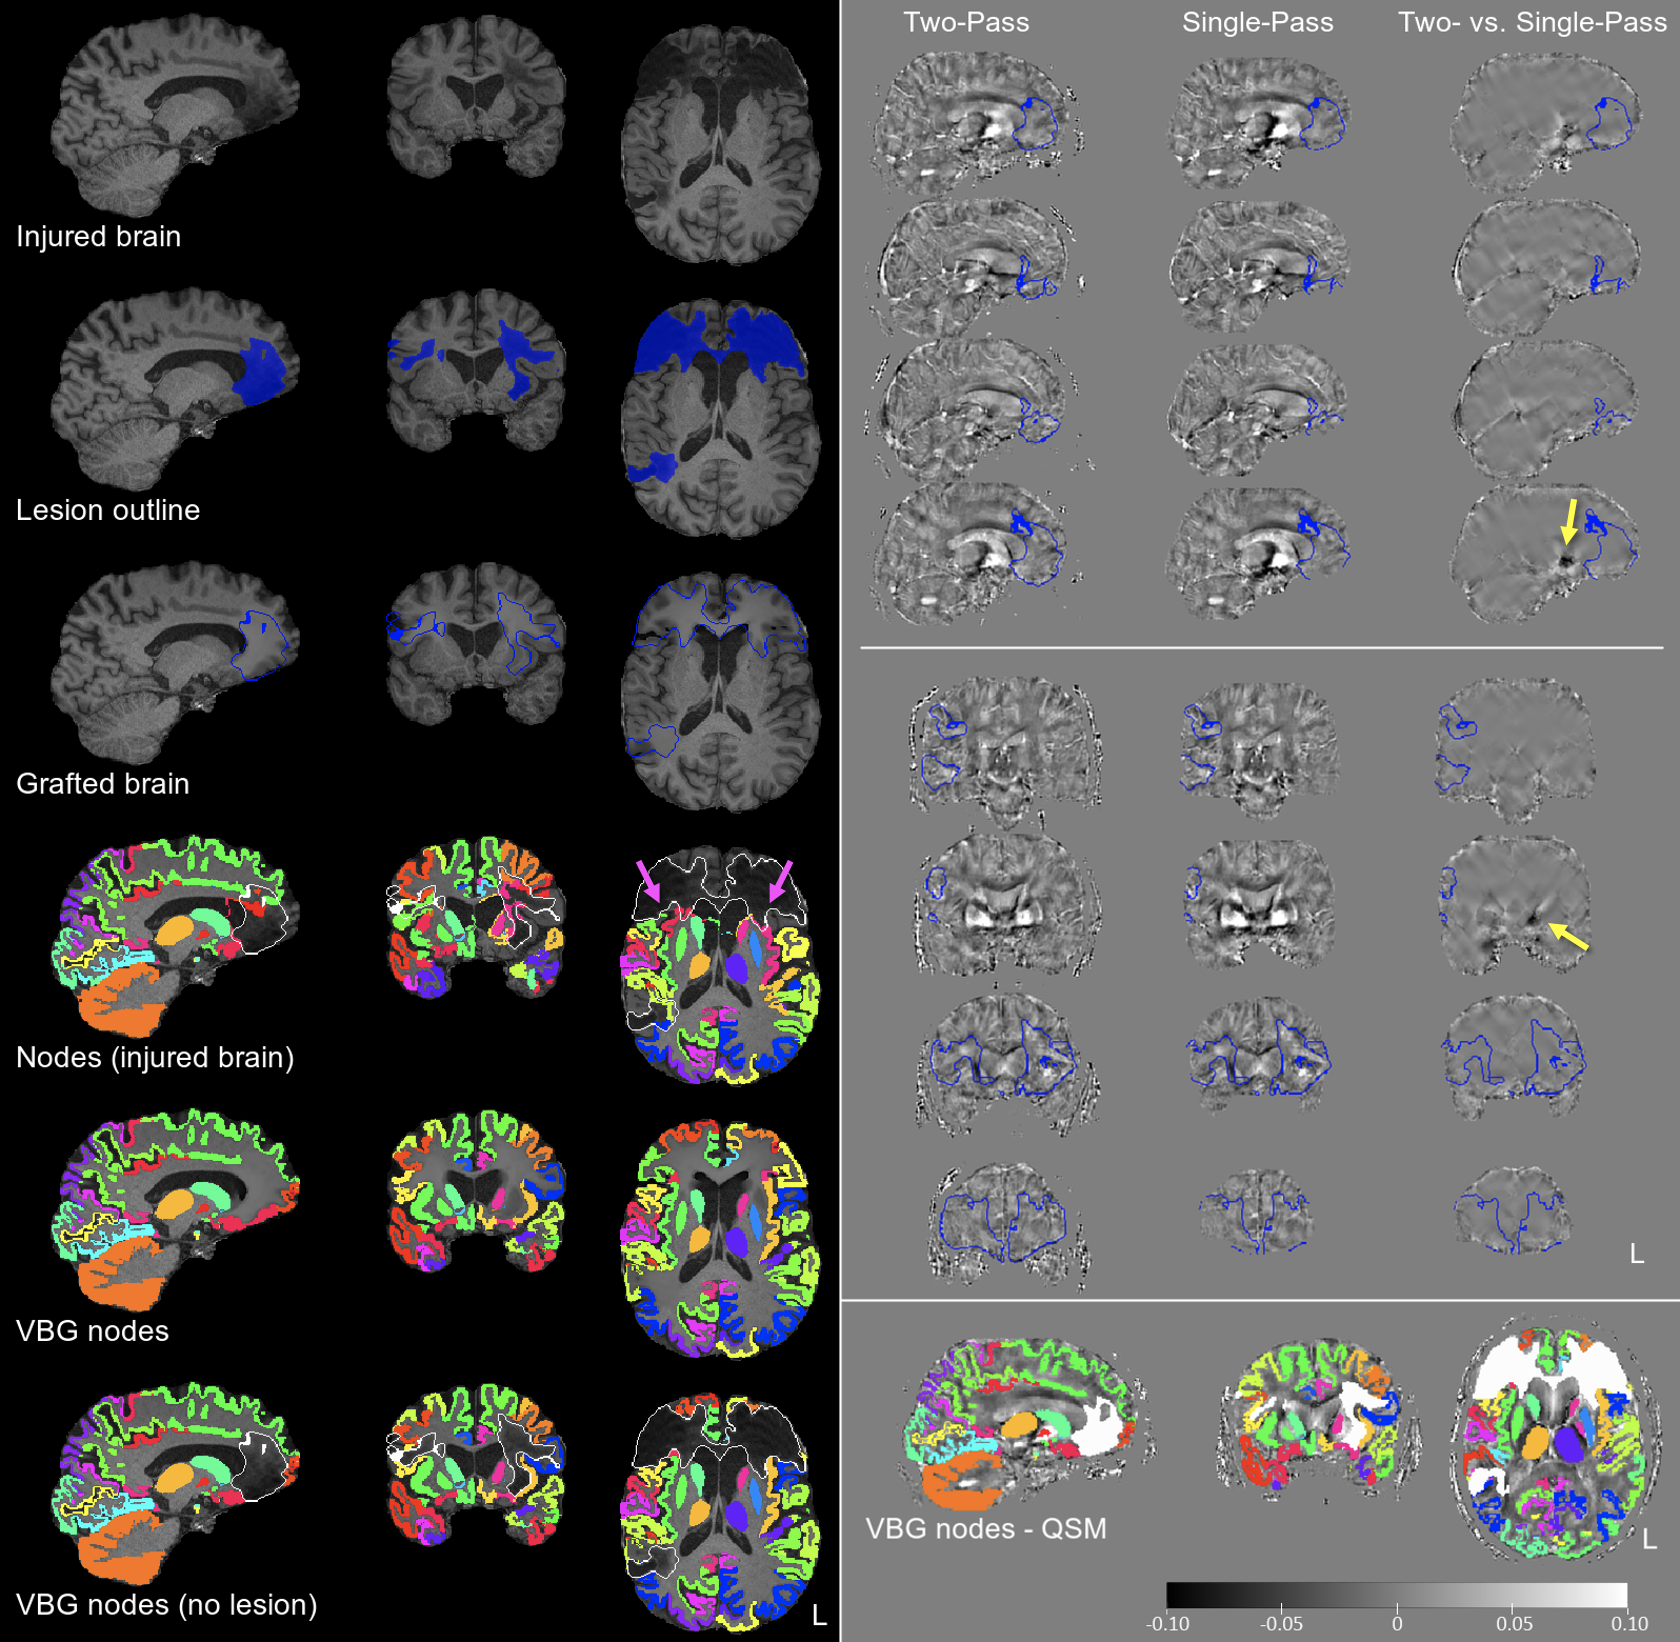
Figure 2. Results of VBG, FreeSurfer and QSMxT for patient TBI2. Left: outputs of the VBG/FreeSurfer pipeline including, from top to bottom: the injured brain, the outline of the lesion; virtual brain grafting; FreeSurfer/FSL FIRST nodes before and after VBG; and VBG nodes with the lesion removed. Top right: illustration of the outputs of the QSMxT pipeline, including, from left to right, two- and single-pass QSM, and the difference image, highlighting the location of artefacts in single-pass QSM (yellow arrows). Bottom right: VBG nodes in QSM space.
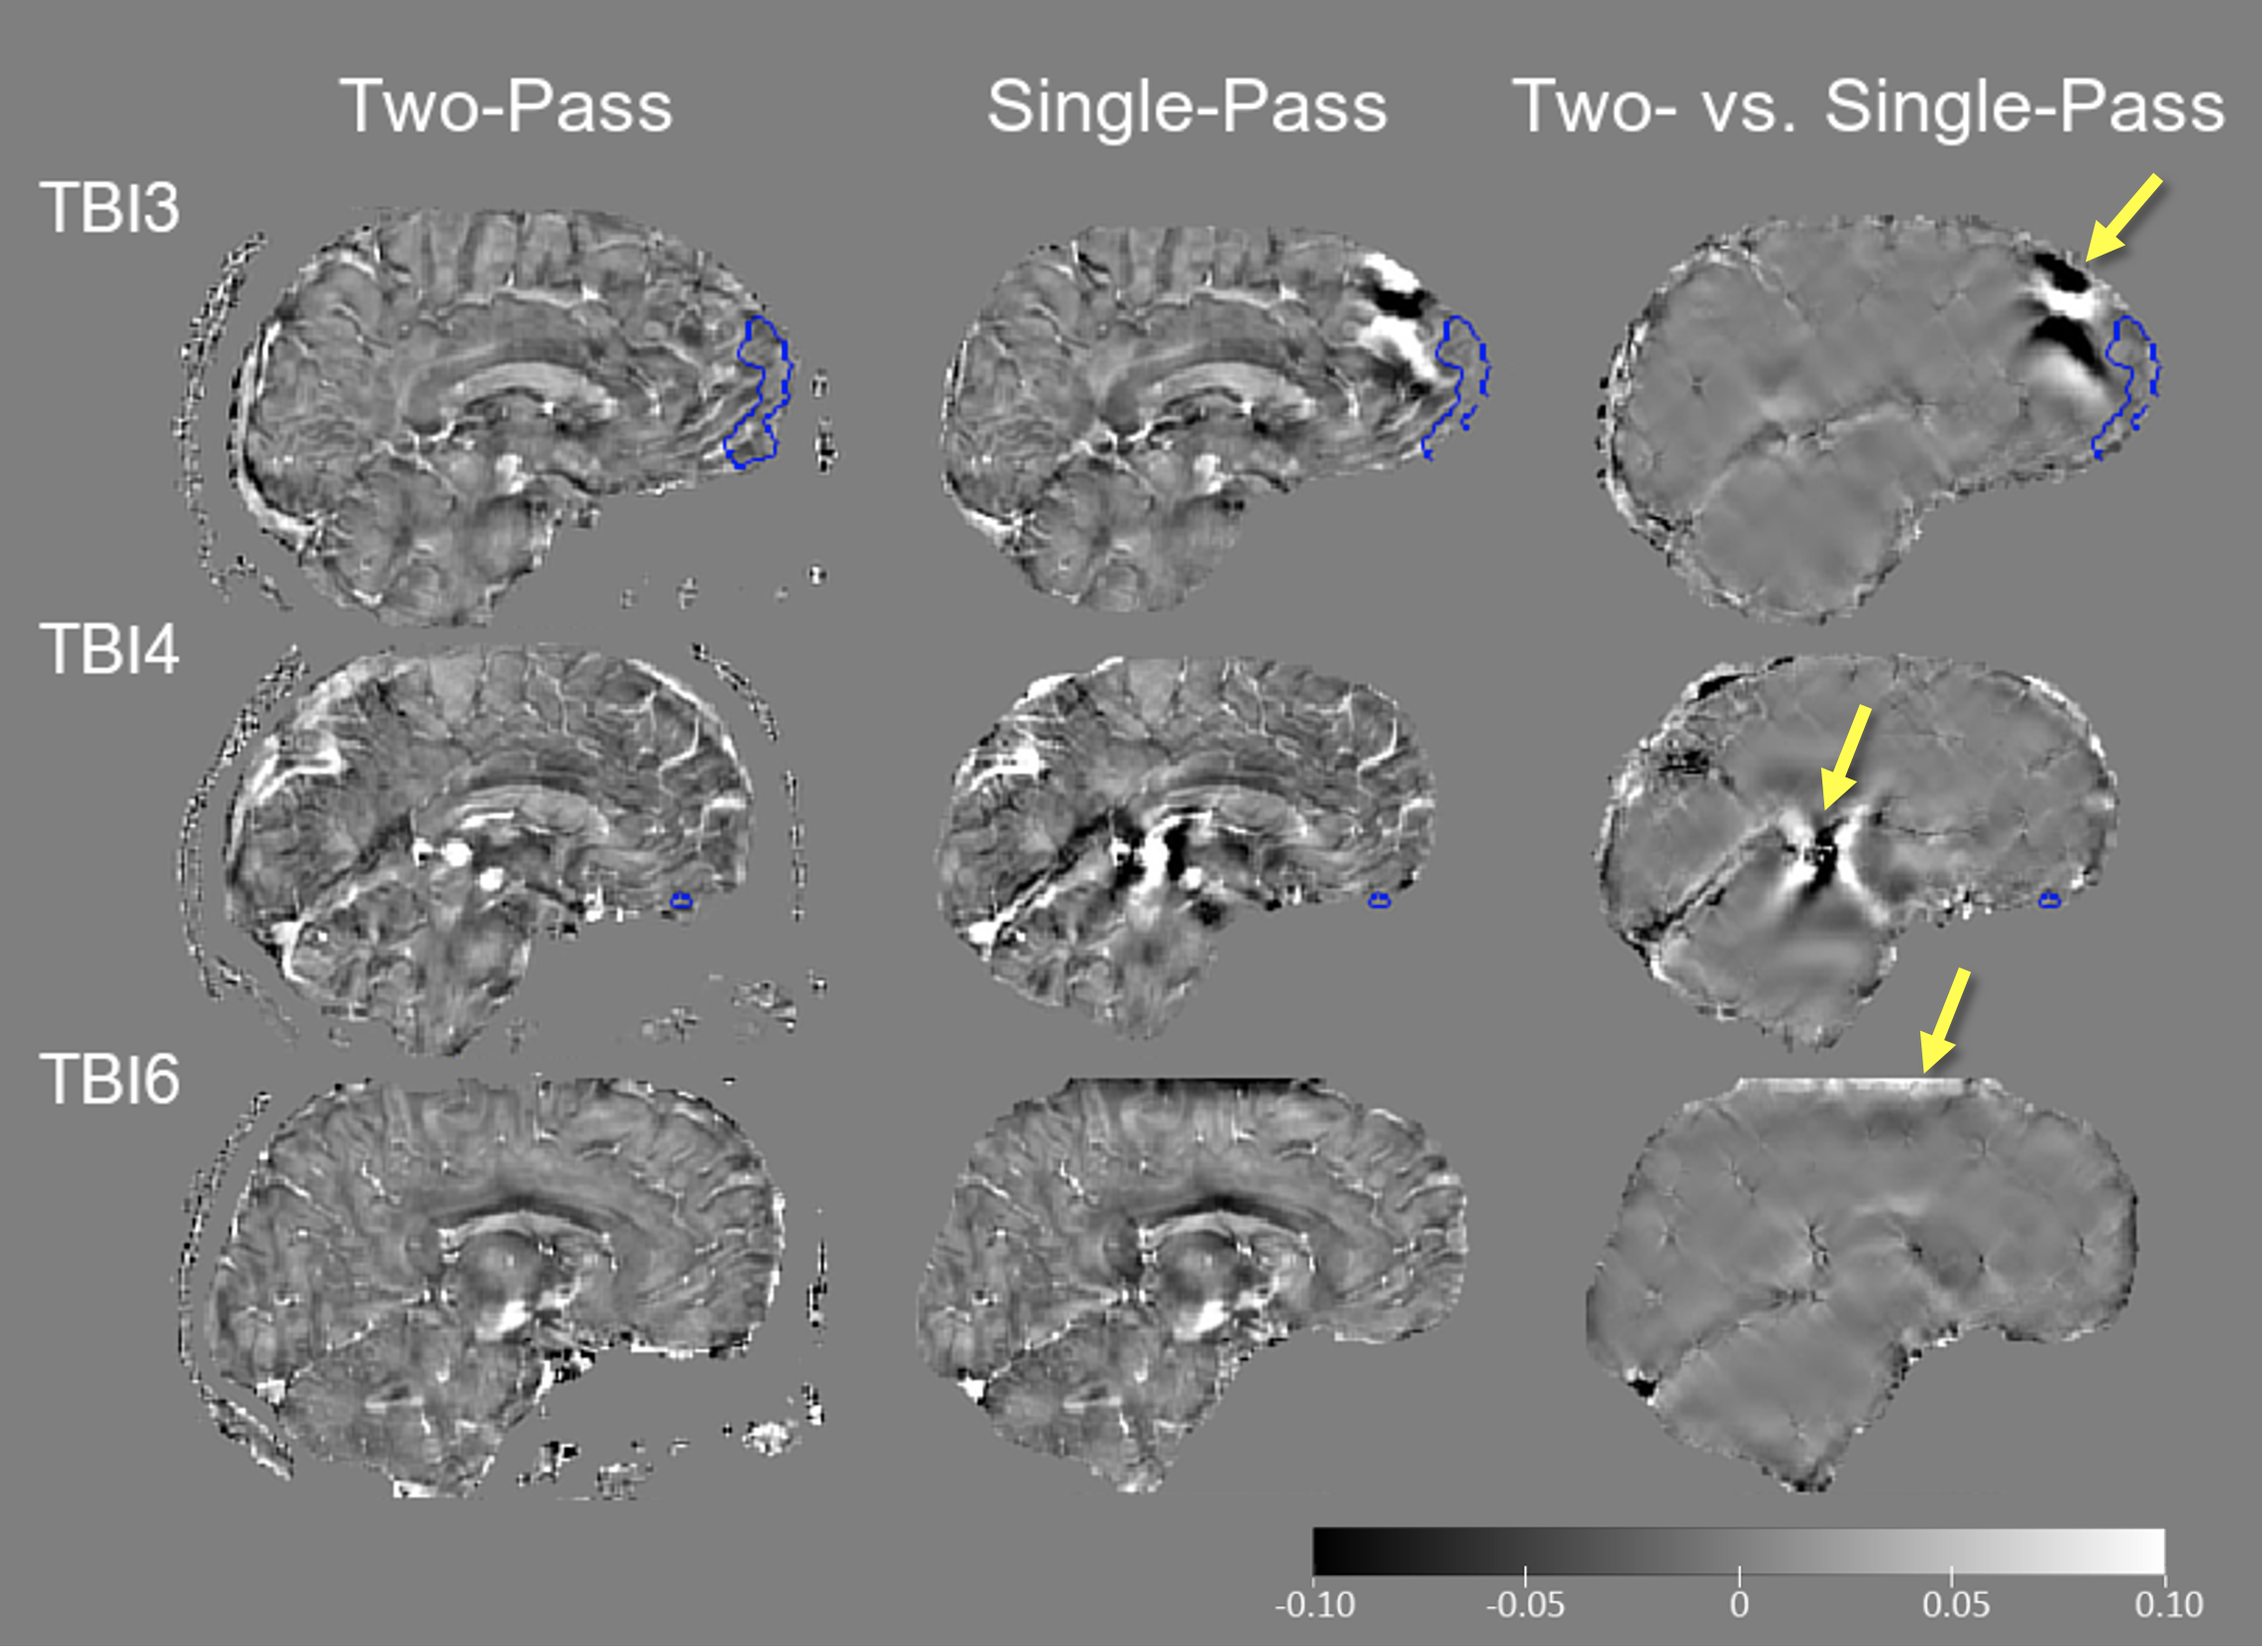
Figure 3. Additional examples illustrating reduction in streaking/dark artefacts (including where an image was clipped) in two- vs. single-pass QSM (yellow arrows) as implemented in QSMxT (lesions outlined in blue).
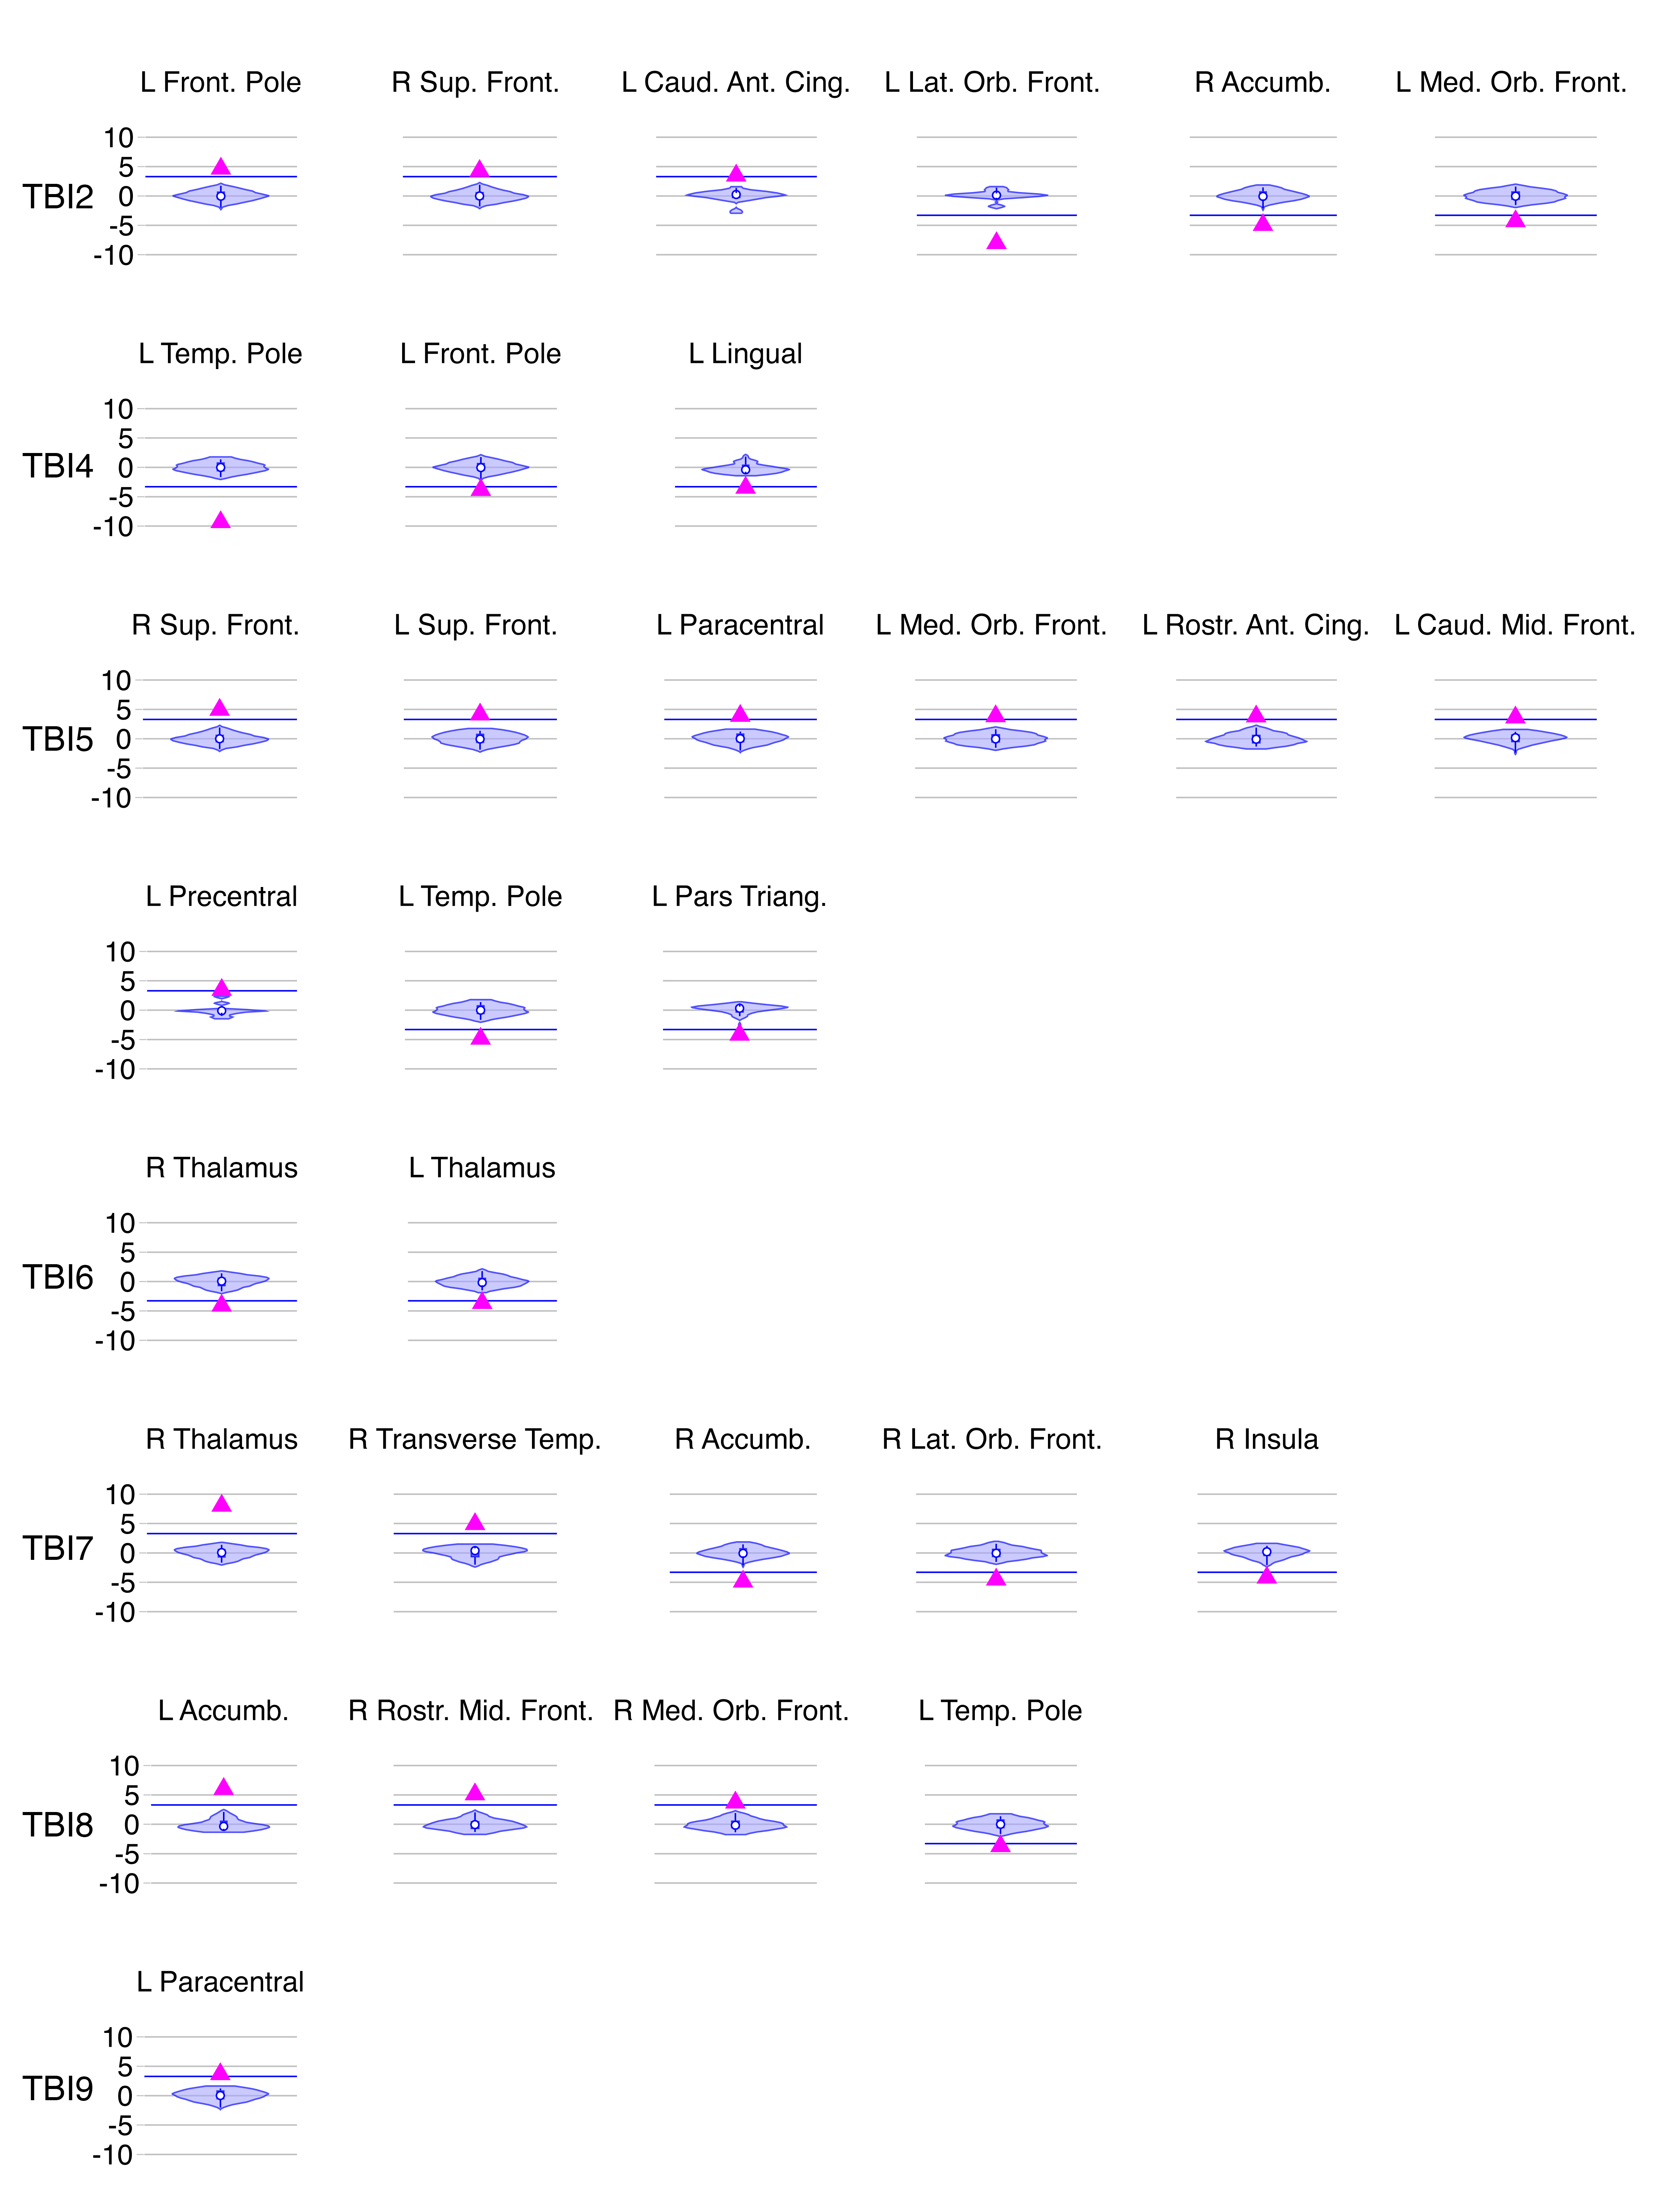
Figure 4. Personalised QSM profiles for all TBI patients. The violin plots display Z-scores of residual (age-corrected) magnetic susceptibility values in the HC sample, with the magenta triangles ▲ indicating the Z-score of the selected region in the patient and the blue line showing the Z threshold (±3.43. This is the deviation from the control mean, which corresponds to Z = 0).