1613
Functional MRI and diffusion tractography correlates of functional recovery after a penetrating cephalic injury: A longitudinal case study1Imaging and pathology, translational MRI, KU Leuven, Leuven, Belgium, 2Neurosurgery, UZ Leuven, Leuven, Belgium, 3Department of Neurosciences, Research Group Experimental Neurosurgery and Neuroanatomy, KU Leuven, Leuven, Belgium, 4Neurosciences, KU Leuven, Leuven, Belgium, 5Radiology, UZ Leuven, Leuven, Belgium
Synopsis
Keywords: Traumatic Brain Injury, Traumatic brain injury, functional MRI, diffusion MRI, tractometry
Motivation: Understanding brain changes occurring during recovery from a sword-inflicted head injury.
Goal(s): To detect longitudinal changes in diffusion and functional MRI accompanying the patient’s functional recovery after the trauma.
Approach: Diffusion MRI and tractometry to assess white matter tract changes and task-based and resting-state functional MRI to monitor changes in brain function.
Results: Reduced diffusion metrics were found in the affected white matter tracts, which seemed to partially recover over time. Task-based fMRI showed significantly (p < 0.05) increased functional activity over time for the right-hand and language scans reflecting gradual clinical improvement in right hand, and language functions.
Impact: This longitudinal case study reveals significant brain recovery post-penetrating trauma, which is less common in clinical practice, and highlights the value of diffusion and functional MRI in tracking brain changes that parallel rehabilitation progress.
Introduction
A 22-year-old male incurred a penetrating head injury during a medieval reenactment when an errant sword thrust penetrated his helmet, his eyelid, the roof of his left orbit, and then the frontal and parietal lobes, terminating at the inner cortex of the skull. At the emergency department, he presented with right-sided hemiparesis and motor aphasia. After a two-week hospitalisation, he was discharged to a rehabilitation facility with some improvement in motor function. Three months post-injury, the patient had made significant motor improvements but still exhibited motor aphasia, sensory loss, and minor right-hand clumsiness. At six months, his recovery was substantial, with only slight language impairment and fine motor coordination deficits. One year after the injury, the patient showed almost no language deficits and near-normal hand function. This case study follows the patient's recovery and utilises multimodal MRI to assess changes over time in dMRI tractography of his corticospinal tracts, arcuate, and uncinate fasciculi, along with functional activity and connectivity changes in hand movement and language.Material and Methods
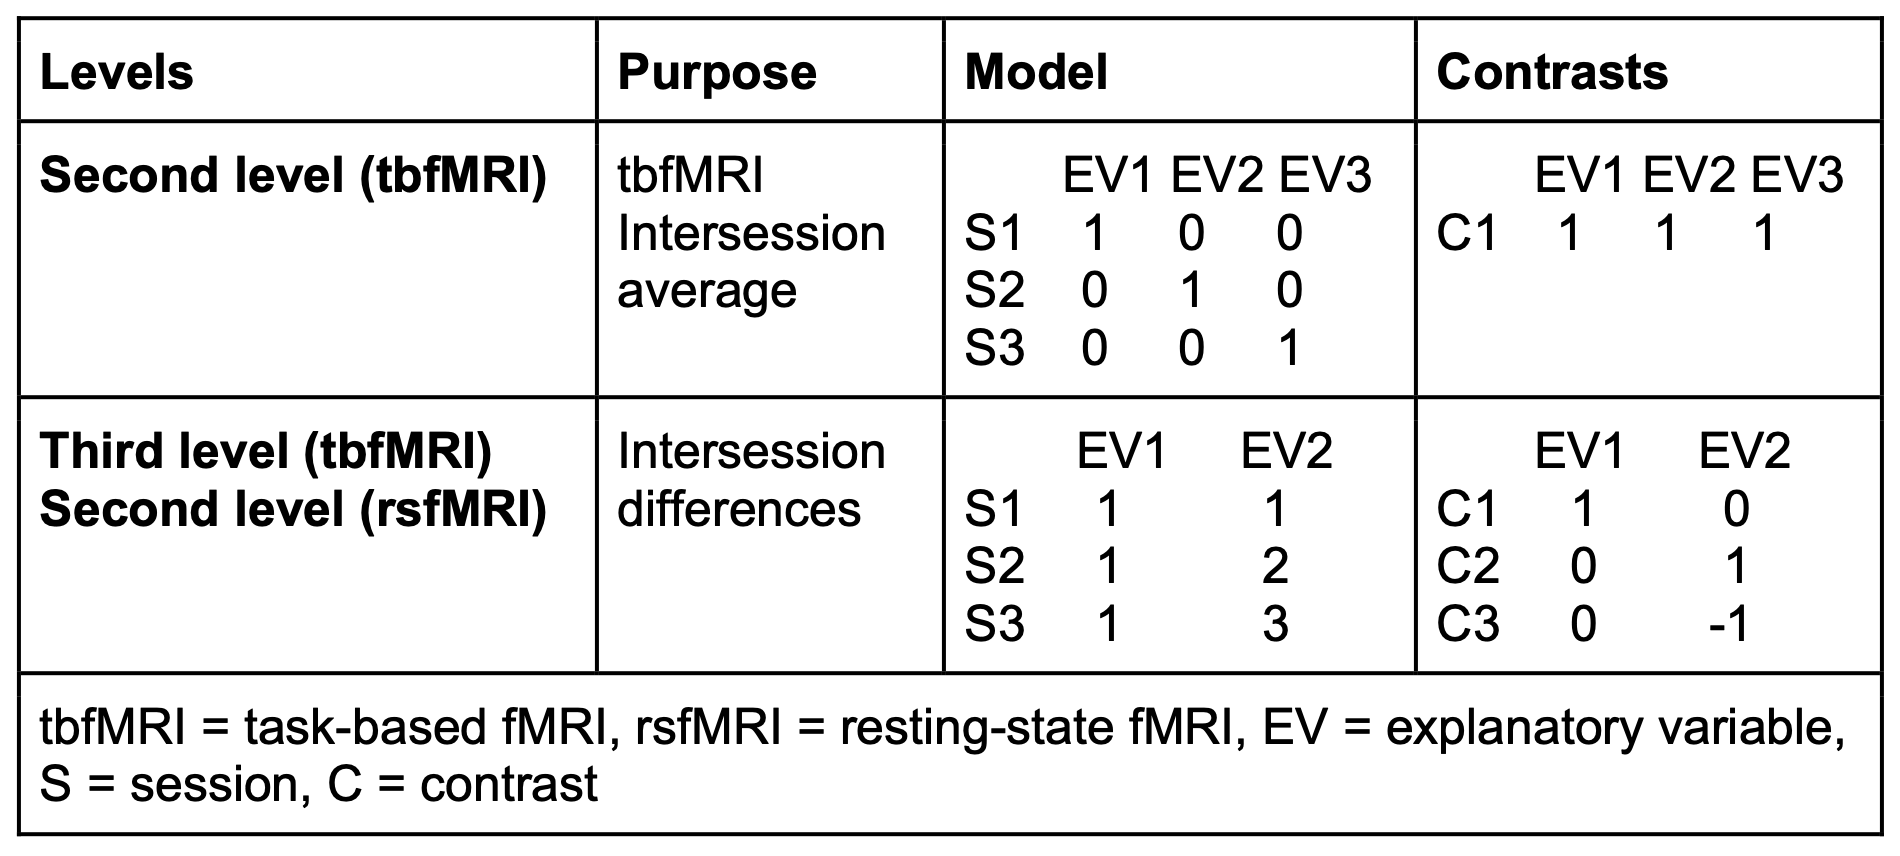
Multimodal imaging was acquired at about 3, 6, and 12 months following the injury using a 3 Tesla MRI scanner with a 32-channel phased-array receive head coil (Achieva dStream, Philips healthcare, Best, The Netherlands). MRI acquired 3D T1 (voxel size: 0.8x0.8x0.8mm3), T2, FLAIR, SWIp, MRA images, as well as multishell dMRI (voxel size: 2.14x2.14x.2.2mm3, TR/TE = 3590/87msec, b-values = 0,700,2000s/mm2, 112 directions, AP and PA phase encoding) tbfMRI (voxel size: 2.14x2.14x.3.2mm3, TR/TE = 1500/33msec, 160 volumes) for both hands, right and left hand separately, feet, lips, language, using a symmetrical 30-seconds block-design paradigm, and rsfMRI (voxel size: 2x2x2mm3, TR/TE = 840/32 msec, 160 volumes). Preprocessing used KUL_NIS1, which relies on FSL2, MRtrxi33, fmriprep4, FreeSurfer5, and KUL_VBG6. Probabilistic tractography with constrained spherical deconvolution (CSD) was done with KUL_FWT7, and quantitative tract-based analyses evaluated inter-session differences in tract profiles. FSL general linear model (GLM)-based analysis was used for the tbfMRI data, and resulting second level inter-session average activation maps were used to derive masks to constrain third level tbfMRI inter-session comparisons and GLM-based rsfMRI functional connectivity (FC) analysis. Linear trends of inter-session differences were modelled in FSL, see table 1, and evaluated using a fixed-effects analysis with FSL FEAT for tbfMRI and fsl_glm for rsfMRI, significance was set at puncorrected < 0.05.Results & Discussion
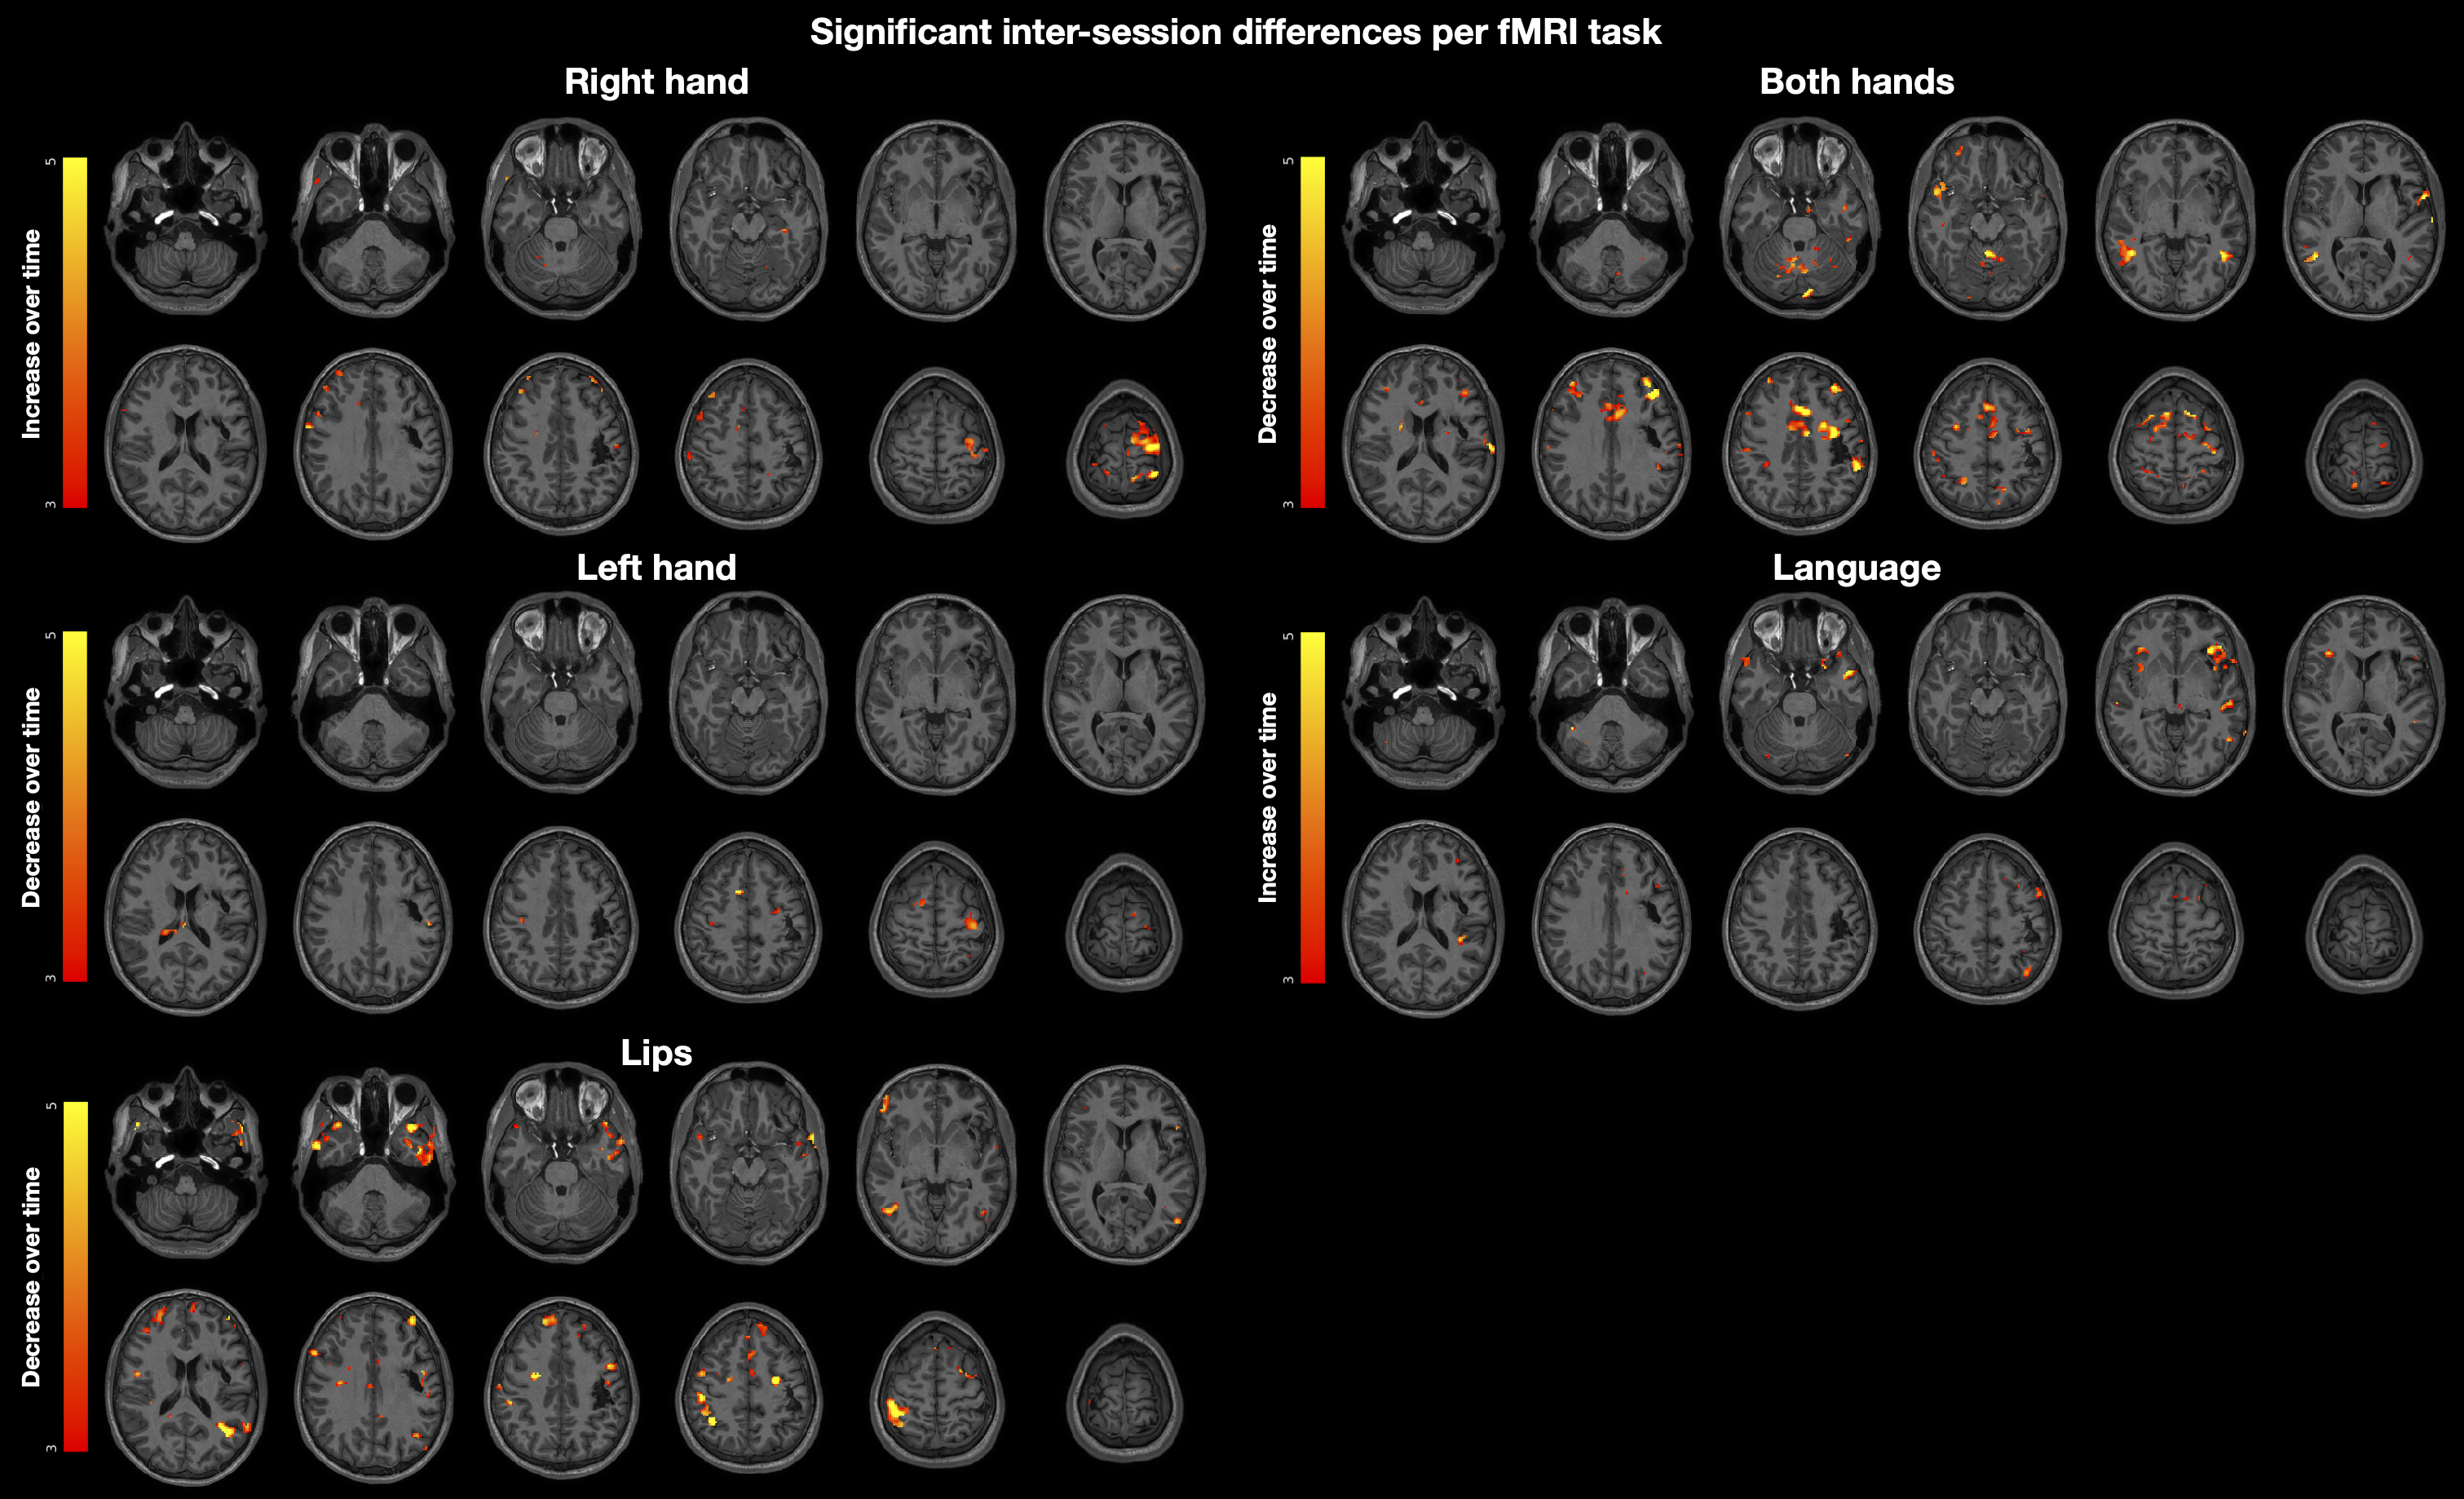
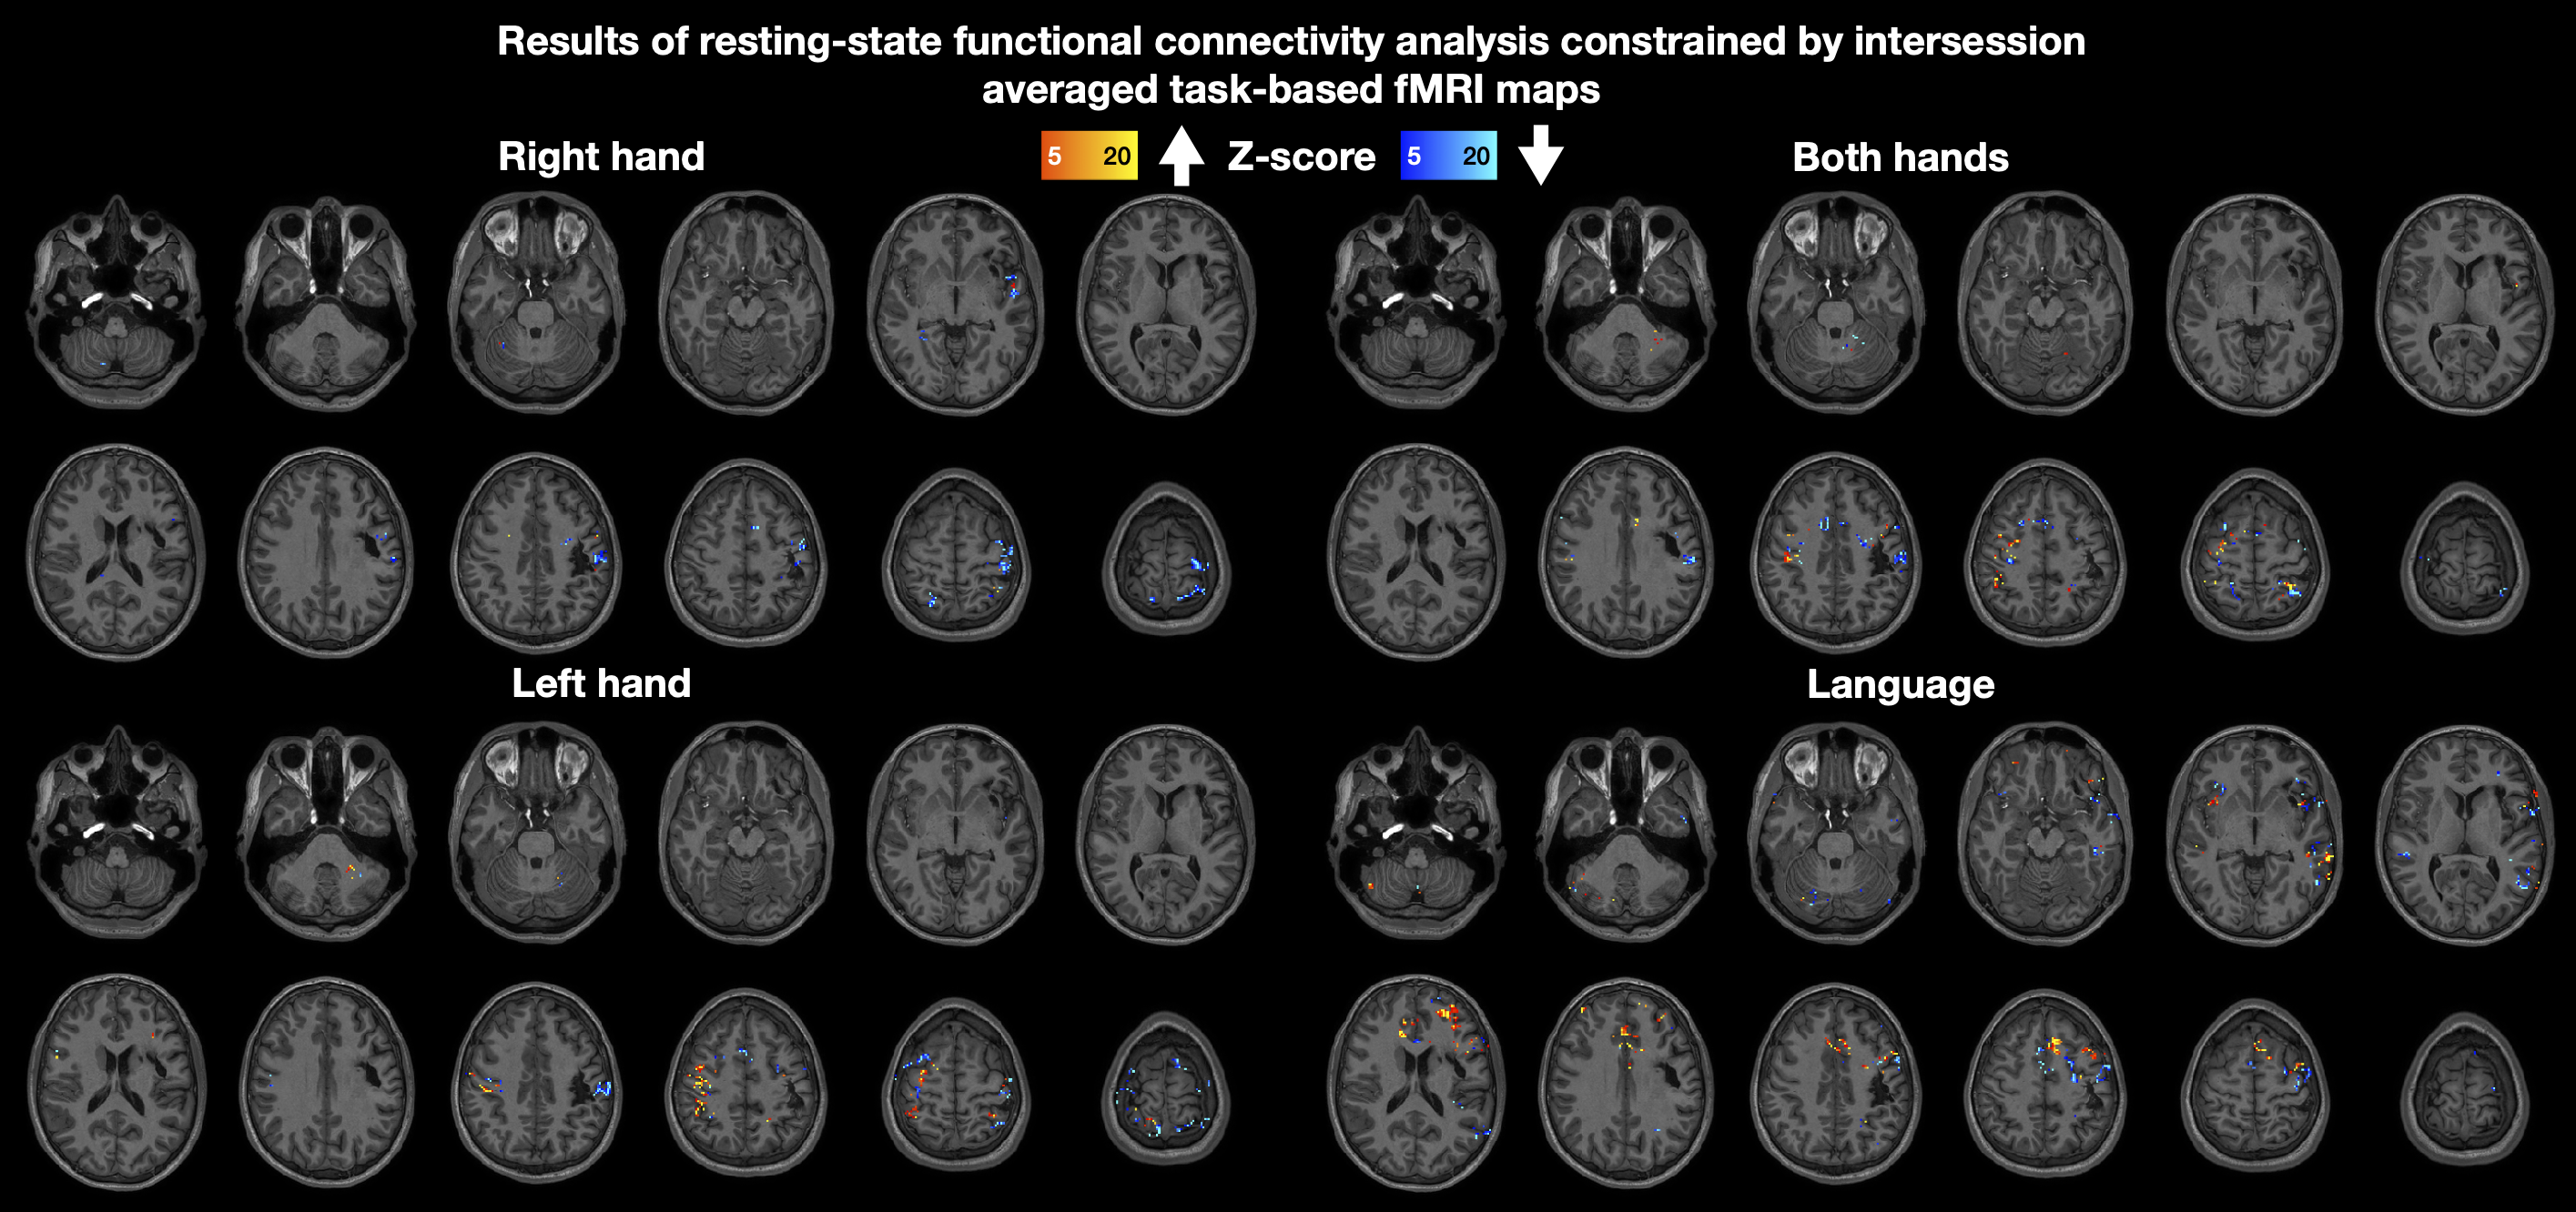
Tract-profiles of fractional anisotropy (FA) and apparent fibre density by cross-section (FDC)8 were plotted and evaluated for temporal changes, as depicted in figure 1. FA and FDC values in the injured left arcuate fasciculus (AF) and left corticospinal tract (CST) were lower than their right-sided counterparts. Over time, both metrics displayed a trend towards increase suggesting a gradual partial recovery of diffusion properties within these tracts. Notably, the opercular fibres of the left CST and the vertical segment of the left AF were not reconstructable in any scan, correlating with the macroscopic lesion seen on conventional imaging and initial profound right-sided hemiparesis and motor aphasia.Inter-session average tbfMRI activity maps per task were generated from second level analyses, see figure 2, and used to derive binary masks to constrain third level tbfMRI and first- and second level rsfMRI FC analyses. Inter-session tbfMRI comparisons, see figure 3, showed increased activation over time in the left primary sensory-motor cortex (SM1) during right-hand finger tapping (FT) scans. Bilateral FT revealed a widespread decrease in functional activity over time. Left-hand FT showed decreased activation over time in the left SM1, suggesting a reduction in post-traumatic mirror activity, which correlated with the clinical presentation of mirror movements that diminished over time.The verb-to-noun language task fMRI showed increasing activation in the bilateral inferior frontal gyri, more on the left side, and in the left superior temporal gyrus, superior parietal, and middle frontal cortices over time, paralleled by a significant clinical improvement of motor aphasia.The GLM -based resting-state functional connectivity (rs-FC) analysis yielded complex results, see figure 4, requiring further scrutiny. Briefly, we observed a decrease in rs-FC in the left SM1 within the right-hand FT mask, a generally increasing FC pattern in the right SM1 and premotor cortex (PMC), and bilateral supplementary motor and posterior parietal cortex (PPC) within the left-hand FT, and bilateral FT masks, and variable FC changes within the language task mask.Subsequent analyses should incorporate connectomic approaches to dMRI and rsfMRI data, assess additional fibre tracts such as the FAT, SLF, ML, MdLF, and IFOF, and investigate the applications of combined structural-functional assessment methods such as tract-weighted dynamic function connectivity (tckdfc)9 for comprehensive evaluation of post-traumatic recovery trajectories.Acknowledgements
No acknowledgement found.References
1. KULeuven Neuro Imaging Suite (KUL_NIS). (2022), https://github.com/treanus/KUL_NIS.
2. Jenkinson, M., Beckmann, C. F., Behrens, T. E. J., Woolrich, M. W. & Smith, S. M. FSL. NeuroImage 62, 782–790 (2012).
3. Tournier, J.-D. et al. MRtrix3: A fast, flexible and open software framework for medical image processing and visualisation. NeuroImage 202, 116137–116137 (2019).
4. Esteban, O. et al. fMRIPrep: a robust preprocessing pipeline for functional MRI. Nat. Methods 16, 111–116 (2019).
5. Fischl, B. FreeSurfer. NeuroImage 62, 774–781 (2012).
6. Radwan, A. M. et al. Virtual brain grafting: Enabling whole brain parcellation in the presence of large lesions. NeuroImage 229, 117731 (2021).
7. Radwan, A. M. et al. An atlas of white matter anatomy, its variability, and reproducibility based on constrained spherical deconvolution of diffusion MRI. NeuroImage 254, 119029 (2022).
8. Raffelt, D. A. et al. Investigating white matter fibre density and morphology using fixel-based analysis. NeuroImage 144, 58–73 (2017).
9. Calamante, F., Smith, R. E., Liang, X., Zalesky, A. & Connelly, A. Track-weighted dynamic functional connectivity (TW-dFC): a new method to study time-resolved functional connectivity. Brain Struct. Funct. 222, 3761–3774 (2017).
Figures
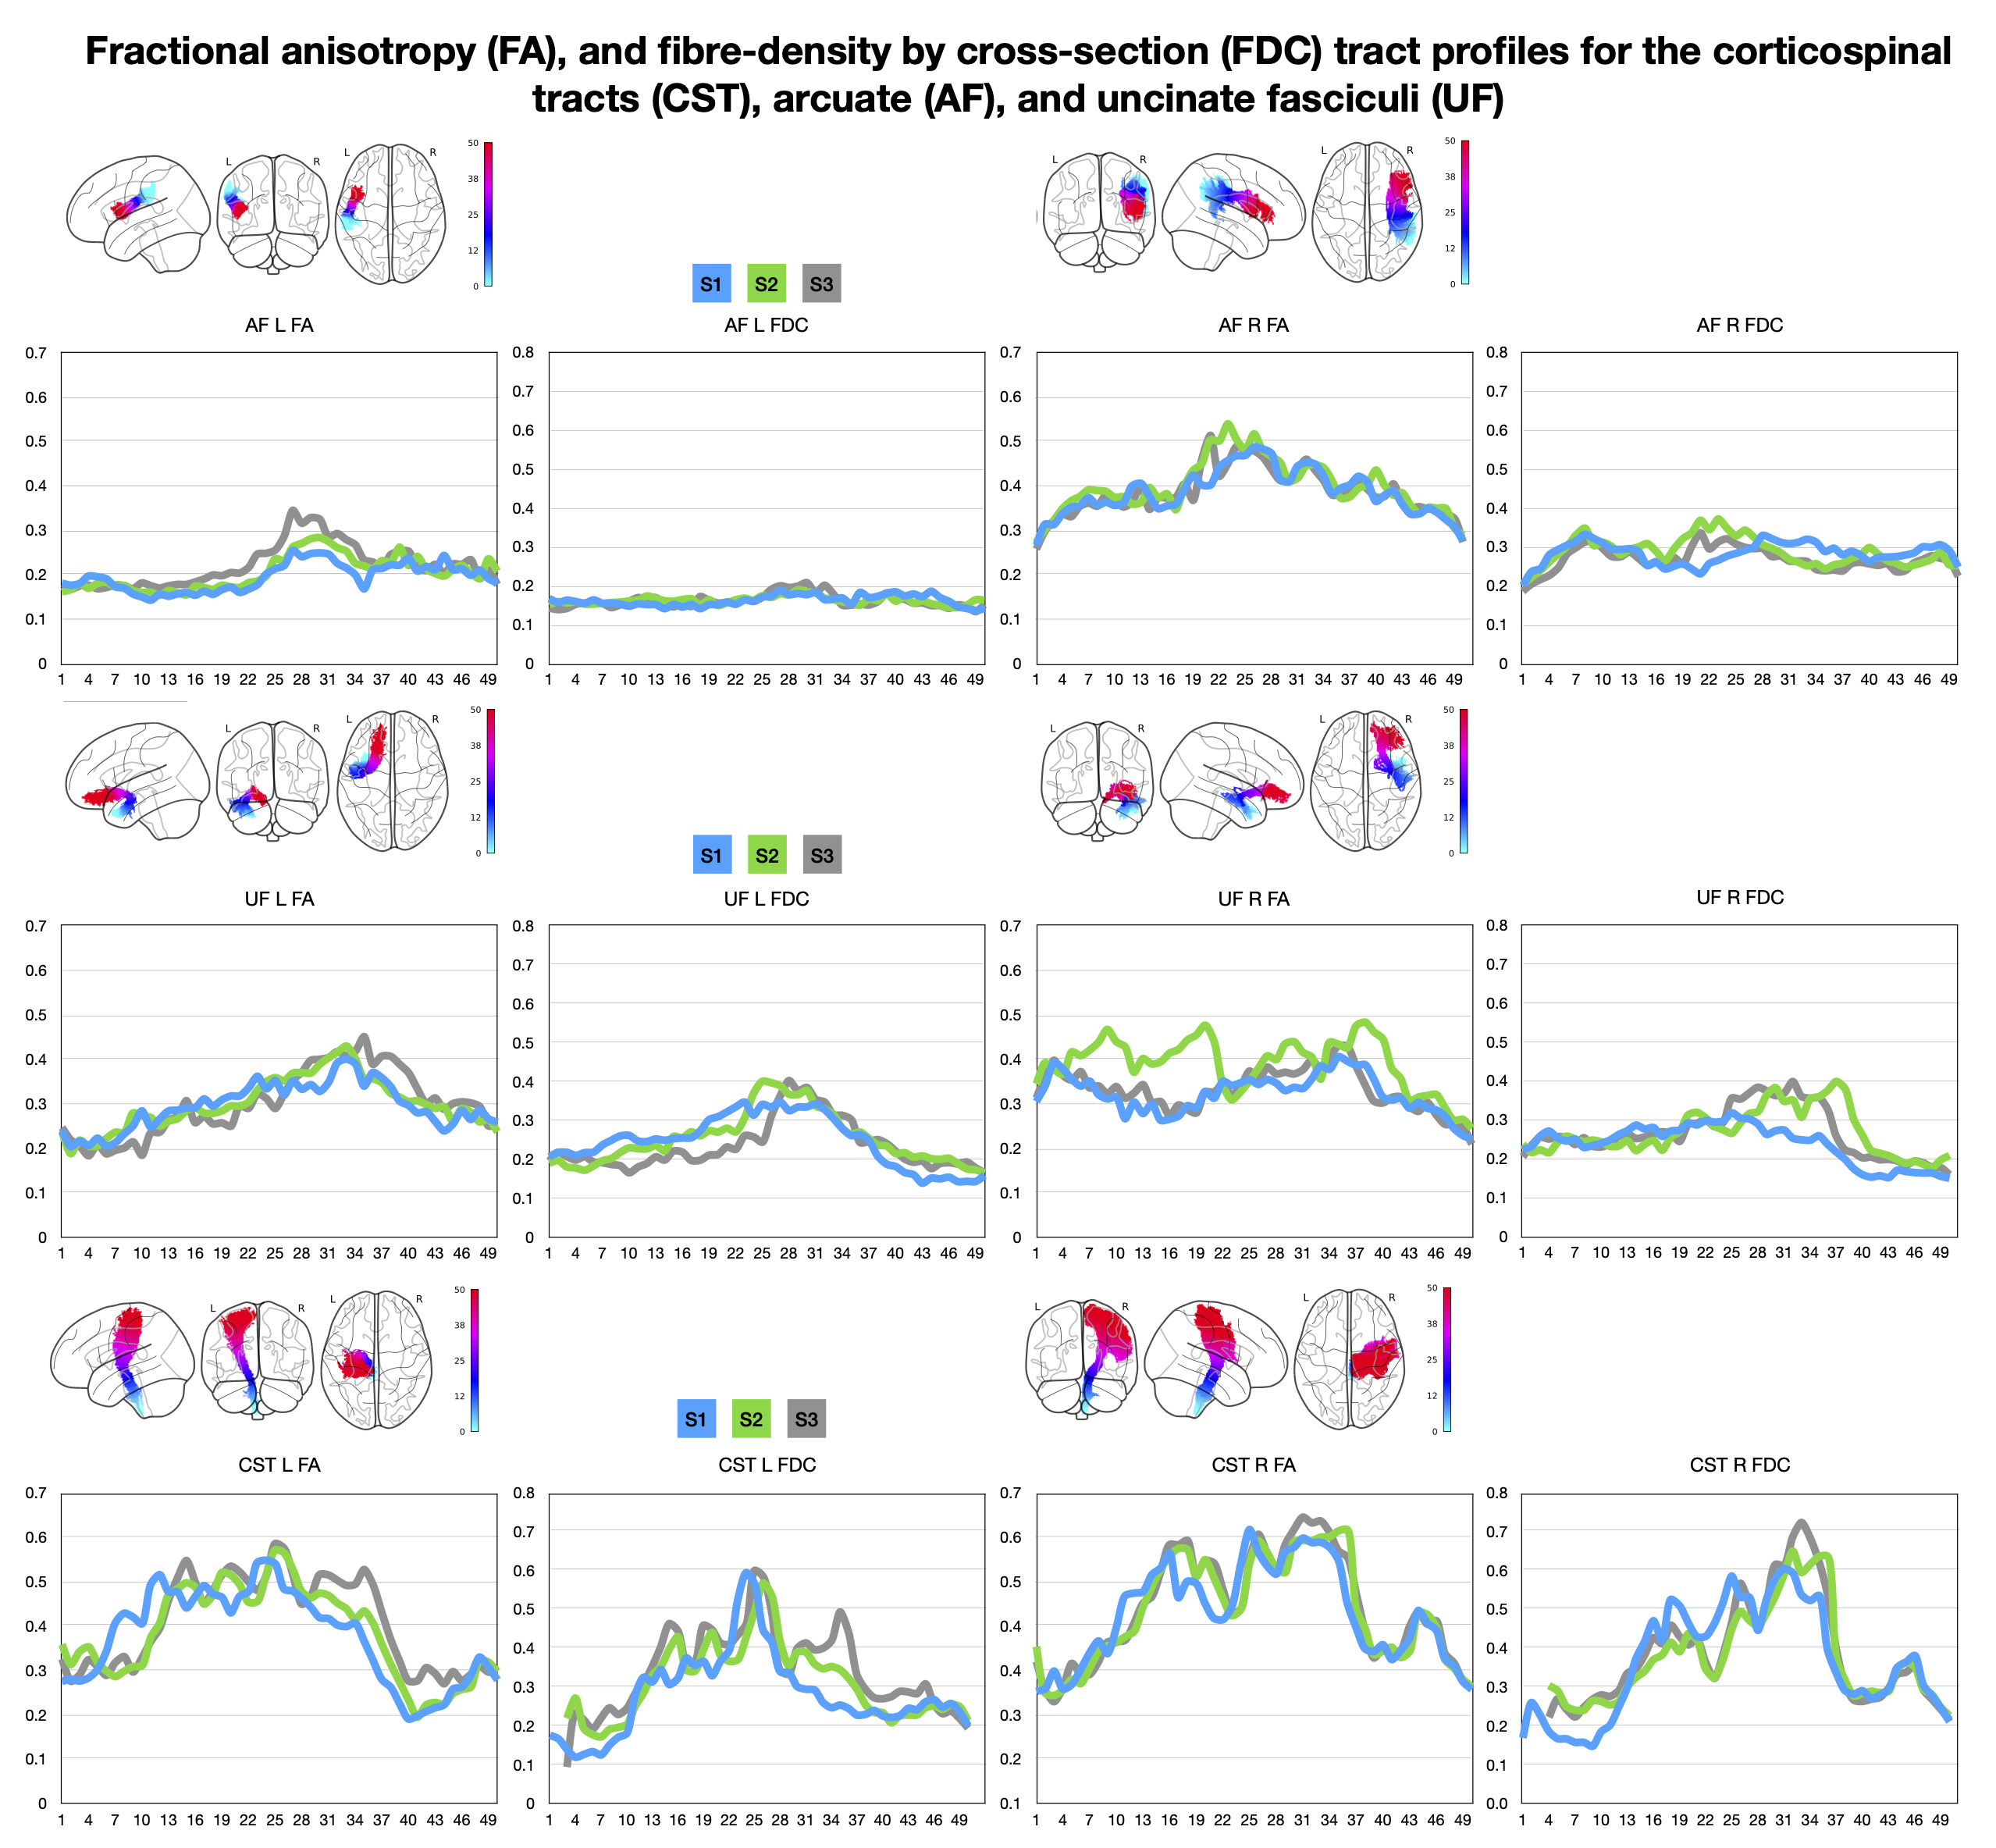
Figure 1. Results of tract-based dMRI analysis showing bundle profiles for qualitative comparisons, bundle segments (0 - 50) are depicted on the x-axis and metric of interest on the y-axis. AF = arcuate fasciculus, L = left, R = right, FA = fractional anisotropy, FDC = fiber density by cross-section, UF = uncinate fasciculus, CST = corticospinal tract, S = session.
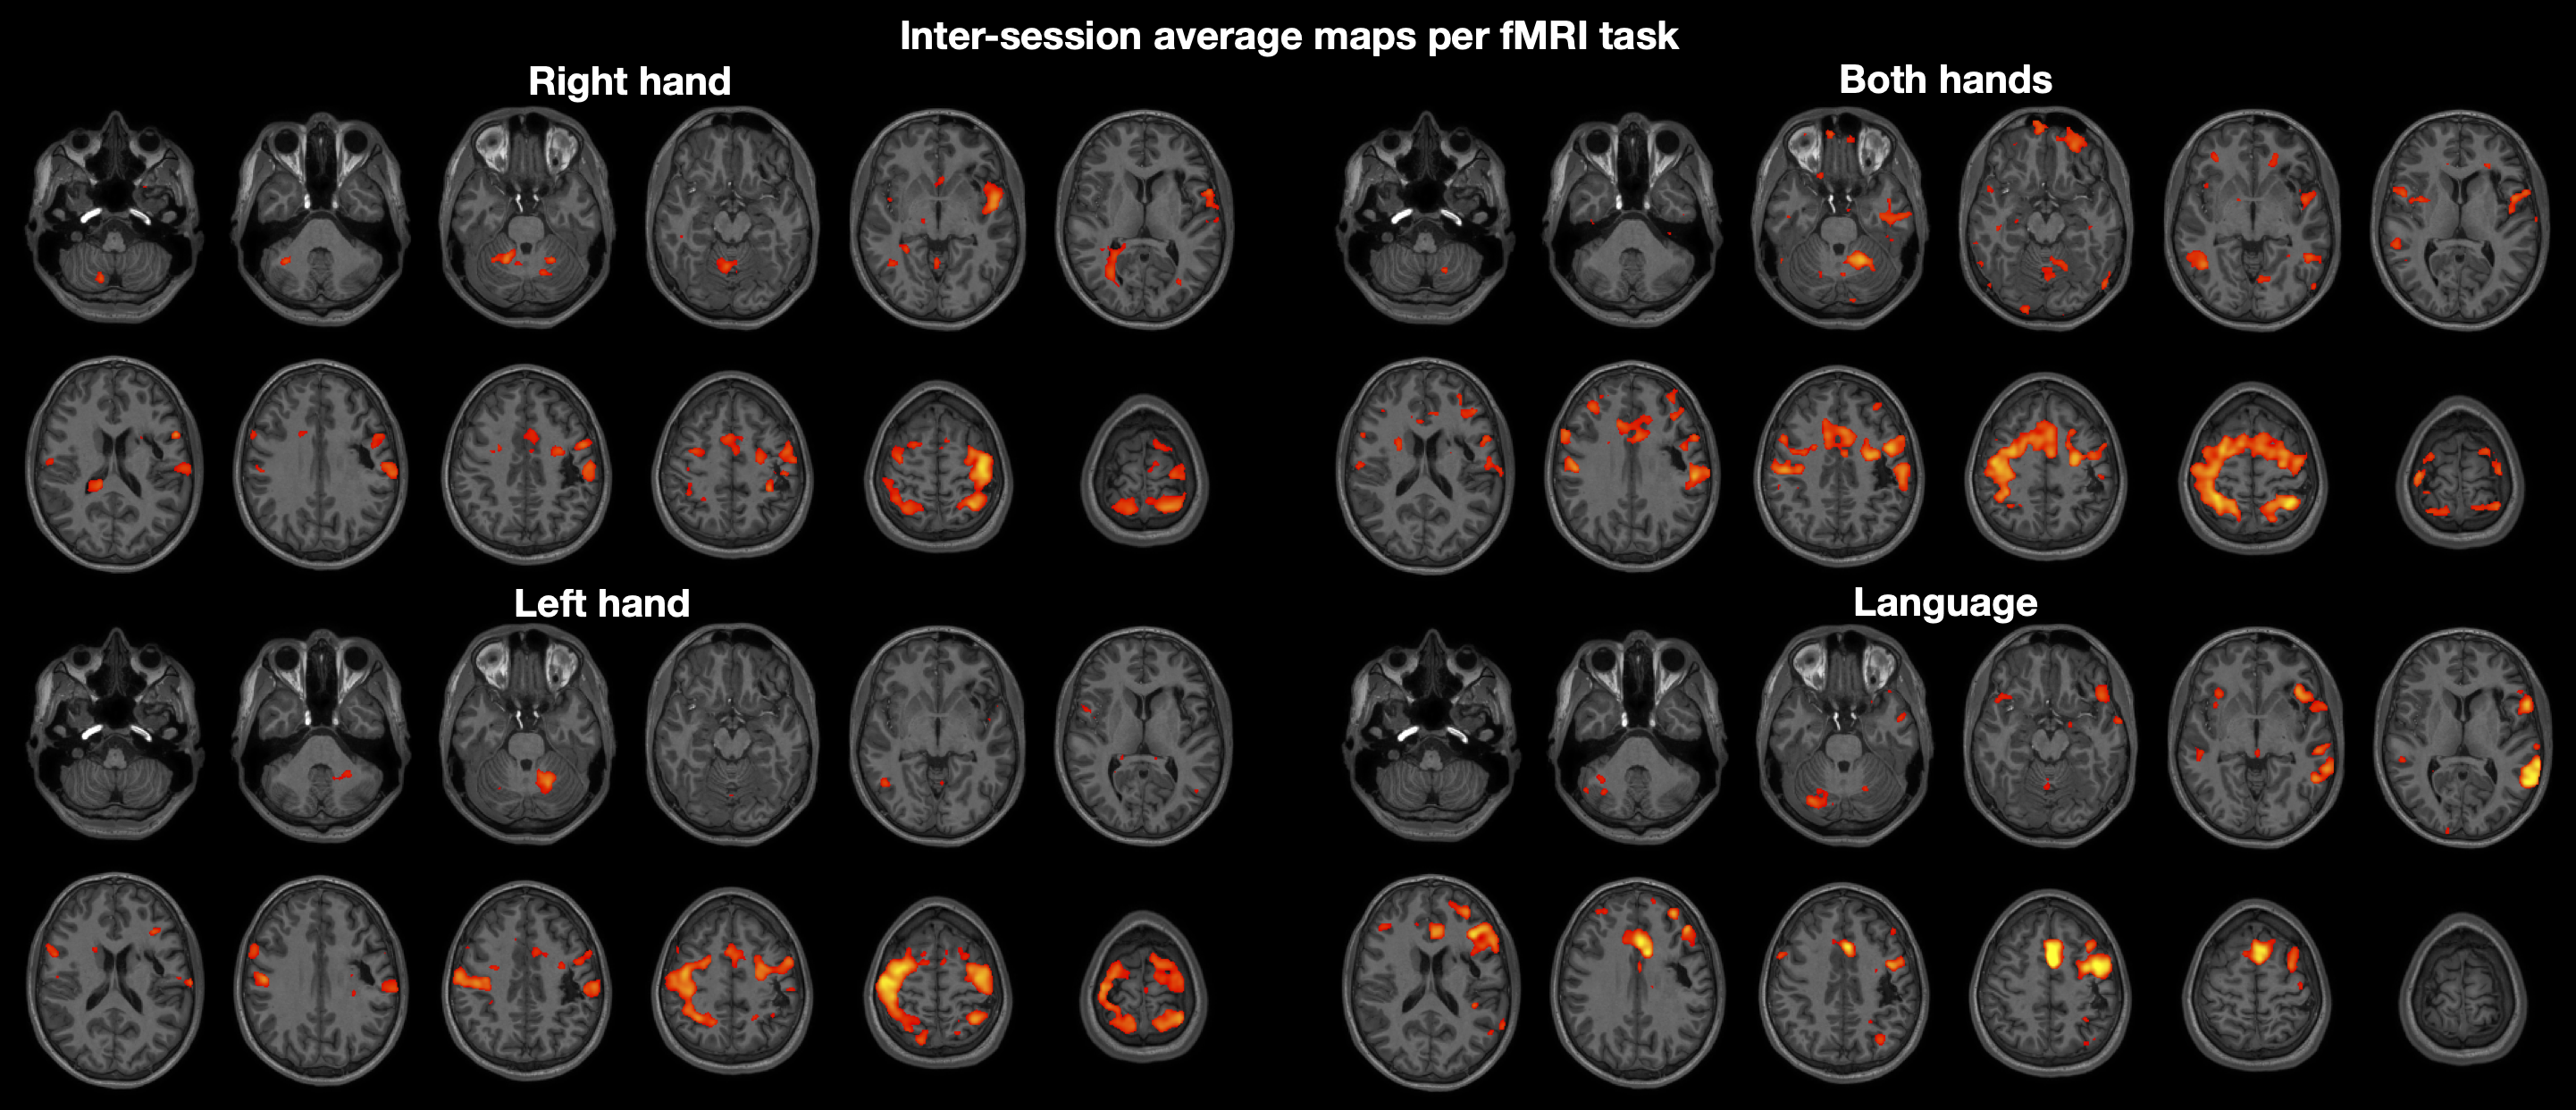
Figure 2. Results of fMRI second level analysis showing inter-session averaged tbfMRI z-score maps overlaid on serial axial T1 weighted image slices.