1579
A Solenoidal Dipole for Human Finger/Small Sample Imaging at 7T MR Imaging: A Comparison Study1Biomedical Engineering, The State University of New York at Buffalo, Buffalo, NY, United States
Synopsis
Keywords: High-Field MRI, High-Field MRI, Small-Sample Imaging
Motivation: Investigate potential uses for solenoidal dipoles, such as in human finger imaging.
Goal(s): The purpose is to evaluate how well the solenoidal dipole works for imaging the finger.
Approach: Comparison to alternative coil configurations for finger imaging.
Results: Evaluate the inter-element coupling, Q-factor, H-field, E-field efficiency, and SNR of the solenoidal dipole in relation to the solenoid coil and LC loop.
Impact: The proposed solenoidal dipole design, despite less efficient H-fields, holds substantial potential for ultra-high-field MRI. It reduces crosstalk, enhances SNR distribution, and improves field homogeneity, making it a promising choice for high-resolution imaging of small samples.
Introduction
Higher SNR at ultra-high field strength improves spatial resolution, enabling more precise and detailed imaging of smaller samples. In clinical ultra-high-field MR imaging applications, enhanced contrast helps distinguish tissue types. The development of new MR hardware, especially RF coils, is essential to improve imaging performance. Our recently proposed solenoidal dipole designs have numerous potential applications. If made into a longer and more compact dipole structure, it could be used in a multi-channel array. The B1 flux from solenoidal turns used to tune the coil to a frequency has another use. The proposed design of solenoidal dipole for small subject imaging1-4 combines the high frequency operation capability of dipole and strong and uniform B1 field of solenoid for improved imaging performance at ultrahigh fields. The design produces inner B1 fields that follow the flux direction of a solenoid coil but have more turns, which a solenoid coil can't accomplish at higher frequencies. The design's higher number of turns and a possibly smaller gap between turns would produce a more homogeneous B1 field than a conventional solenoid. To test the hypothesis that solenoidal dipoles can improve small sample imaging, a solenoidal dipole wrapped around a human finger was designed and compared to a similar-sized conventional solenoid and a conventional LC loop in terms of inter-element coupling, Q-factor evaluations, H and E field efficiency, and SNR distribution using electromagnetic numerical simulations at 7T.Method
A conventional solenoid, LC loop, and solenoidal dipole structure were 3D modeled and simulated in CST Studio Suite. Dimensions and simulation setup are in Figures1B–D. The simulation setup included a human hand phantom of average adult size, with material properties of Ɛr:40, σ:0.4 S/m. Free-space/unloaded and loaded coils were simulated with a human hand phantom. The Q-factor was calculated from scattering reflection coefficient plots in unloaded and loaded conditions at 3dB bandwidth and center frequency. The simulation model in Figure2C was used to test each coil for coupling. Inter-element coupling simulations used two identical coils 1cm apart and cylindrical phantoms with the same material properties near each coil. Each coil was 70mm long, and the other dimensions were adjusted for 300MHz tuning. LC loops were 22.06mm wide and had three evenly distributed tuning capacitors. The solenoid coil had two turns, a length of 70mm, and a diameter of 25.90mm. A small tuning capacitor fine-tuned the frequency to 300MHz. Finally, the solenoidal dipole had 6 turns, the same length and diameter as the solenoid coil, and no tuning lumped element. Shunt-matching capacitors were connected to the feed port to match coil impedance at 50 in each design.Results
Figure2A shows all evaluated coil types’ unloaded/free-space and loaded reflection coefficient S-parameters. The figure also shows each coil's calculated Q-factor in both conditions. Although the solenoidal dipole has a lower Q-factor in both tested conditions, its unloaded-to-loaded Q-factor exceeds the conventional solenoid and LC loop. In a simulation with two sets of identical coils 1cm apart, the solenoidal dipole had -10.67dB crosstalk, compared to the solenoid's -7.09dB and the LC loop's -1.29dB. Figures3A and B show each coil's H-field flux direction and distribution in the arrow and contour plots. The solenoidal dipole's field distribution is perpendicular to the loop and similar to the solenoid. Higher turns and tighter gaps homogenize and target solenoidal dipole H-fields to the sample center.H-field and E-field efficiency plots normalized to input power are in Figures4A and 4B. The solenoidal dipole had the lowest peak H-field (24.1dB) and the highest LC loop (39.8dB). The solenoidal dipole had the lowest peak E-field (508.2(V/(m√W))) compared to the LC loop (564.7(V/(m√W))) and solenoid (728(V/(m√W)) Normalized SNR maps for all imaging sample coils in the central sagittal and axial plane are shown in Figure5. Maximum LC loop SNR was in the sagittal plane and solenoid in the axial plane. The solenoidal dipole produced the lowest, most consistent sagittal and axial values, improving homogeneity.
Conclusion
The utility of the solenoidal dipole for small sample imaging was quantitatively compared to that of conventional solenoid and LC loop designs in this study. The solenoidal dipole achieved a higher unloaded-to-loaded Q-ratio, lower electric fields in the sample, and more uniform H-fields and SNR distribution. Although the H-field efficiency and SNR were lower, the central region's homogeneity makes it ideal for high-detail imaging of smaller samples. Furthermore, when compared to other designs, lower crosstalk allows for more efficient simultaneous imaging of smaller samples.Acknowledgements
No acknowledgement found.References
1. Laistler E, Dymerska B, Sieg J, Goluch S, Frass-Kriegl R, Kuehne A, Moser E. In vivo MRI of the human finger at 7 T. Magn Reson Med. 2018 Jan;79(1):588-592. doi: 10.1002/mrm.26645. Epub 2017 Mar 10. PMID: 28295563; PMCID: PMC5763334.
2. Wong EC, Jesmanowicz A, Hyde JS. High-resolution, short echo time MR imaging of the fingers and wrist with a local gradient coil. Radiology. 1991 Nov;181(2):393-7. doi: 10.1148/radiology.181.2.1924778. PMID: 1924778.
3. Clavero JA, Alomar X, Monill JM, Esplugas M, Golanó P, Mendoza M, Salvador A. MR imaging of ligament and tendon injuries of the fingers. Radiographics. 2002 Mar-Apr;22(2):237-56. doi: 10.1148/radiographics.22.2.g02mr11237. PMID: 11896215.
4. Laistler E, Kuehne A, Goluch S, Dymerska B, Sieg J, Moser E. Micro‐imaging of finger tendons in vivo using a dedicated solenoidal finger coil at 7 T. In Proceedings of the 22nd Annual Meeting of ISMRM Meeting & Exhibition in Milan, Italy, 2014. p. 4310.
Figures
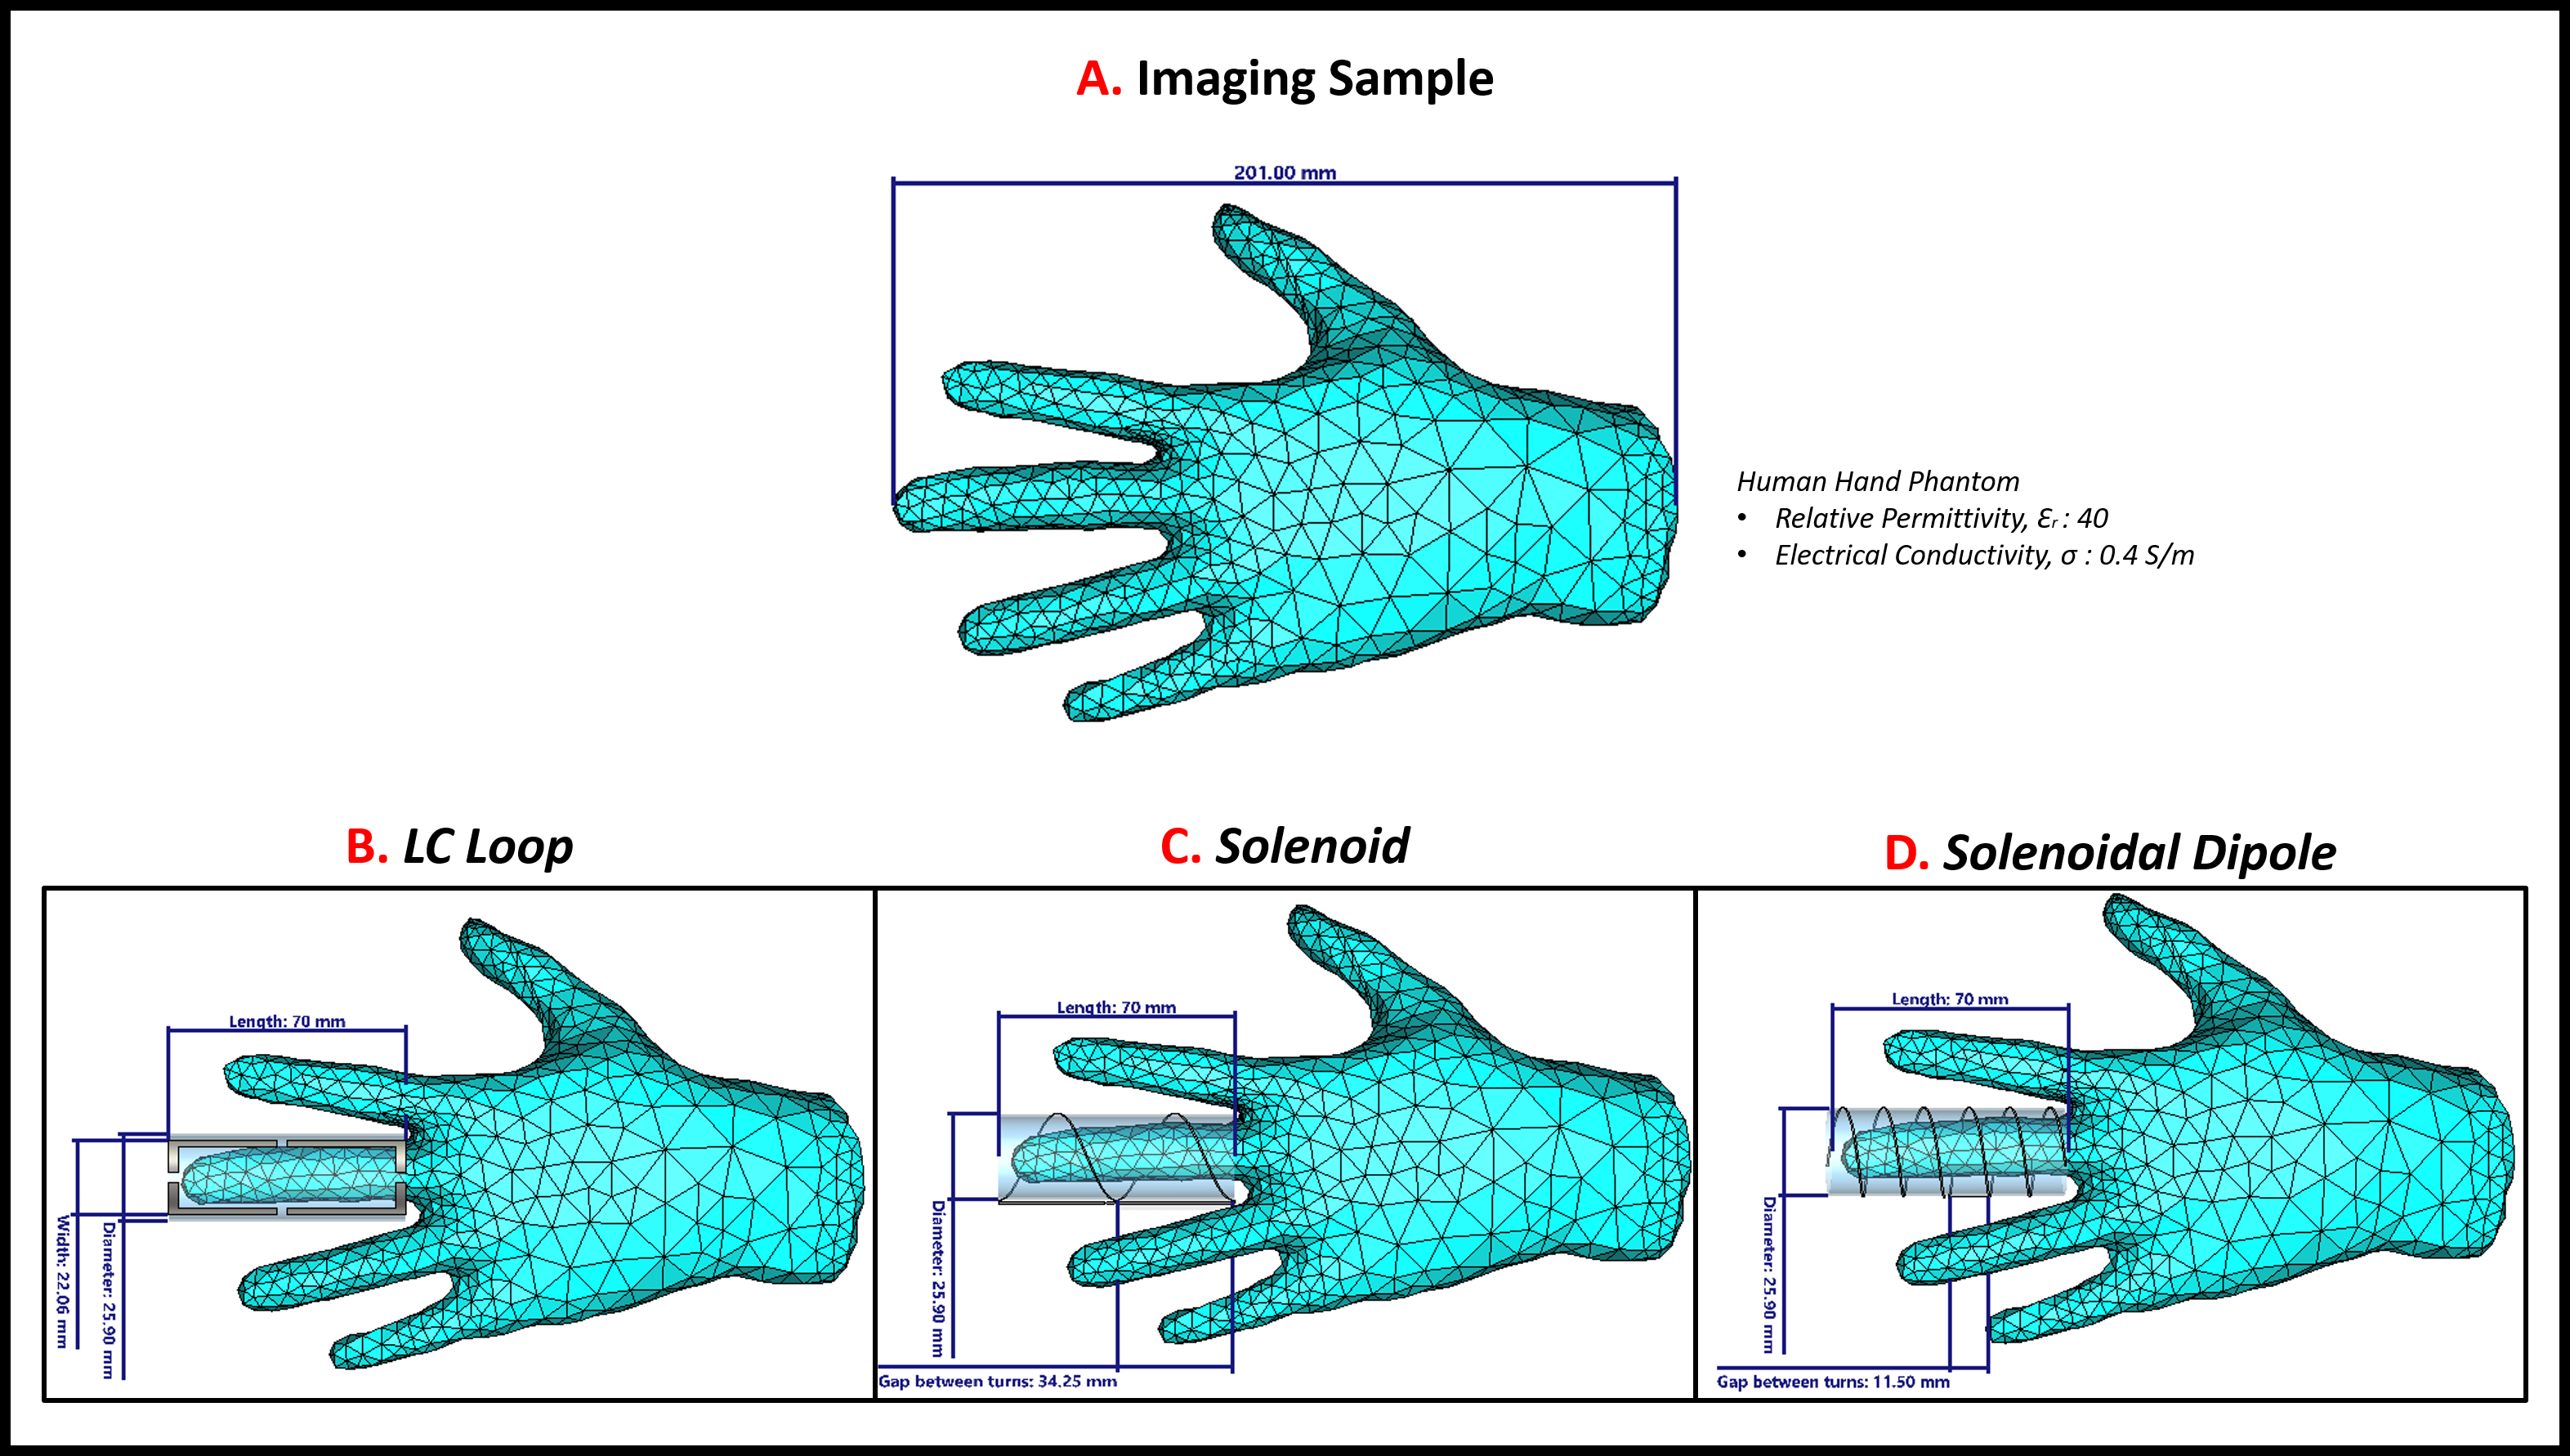
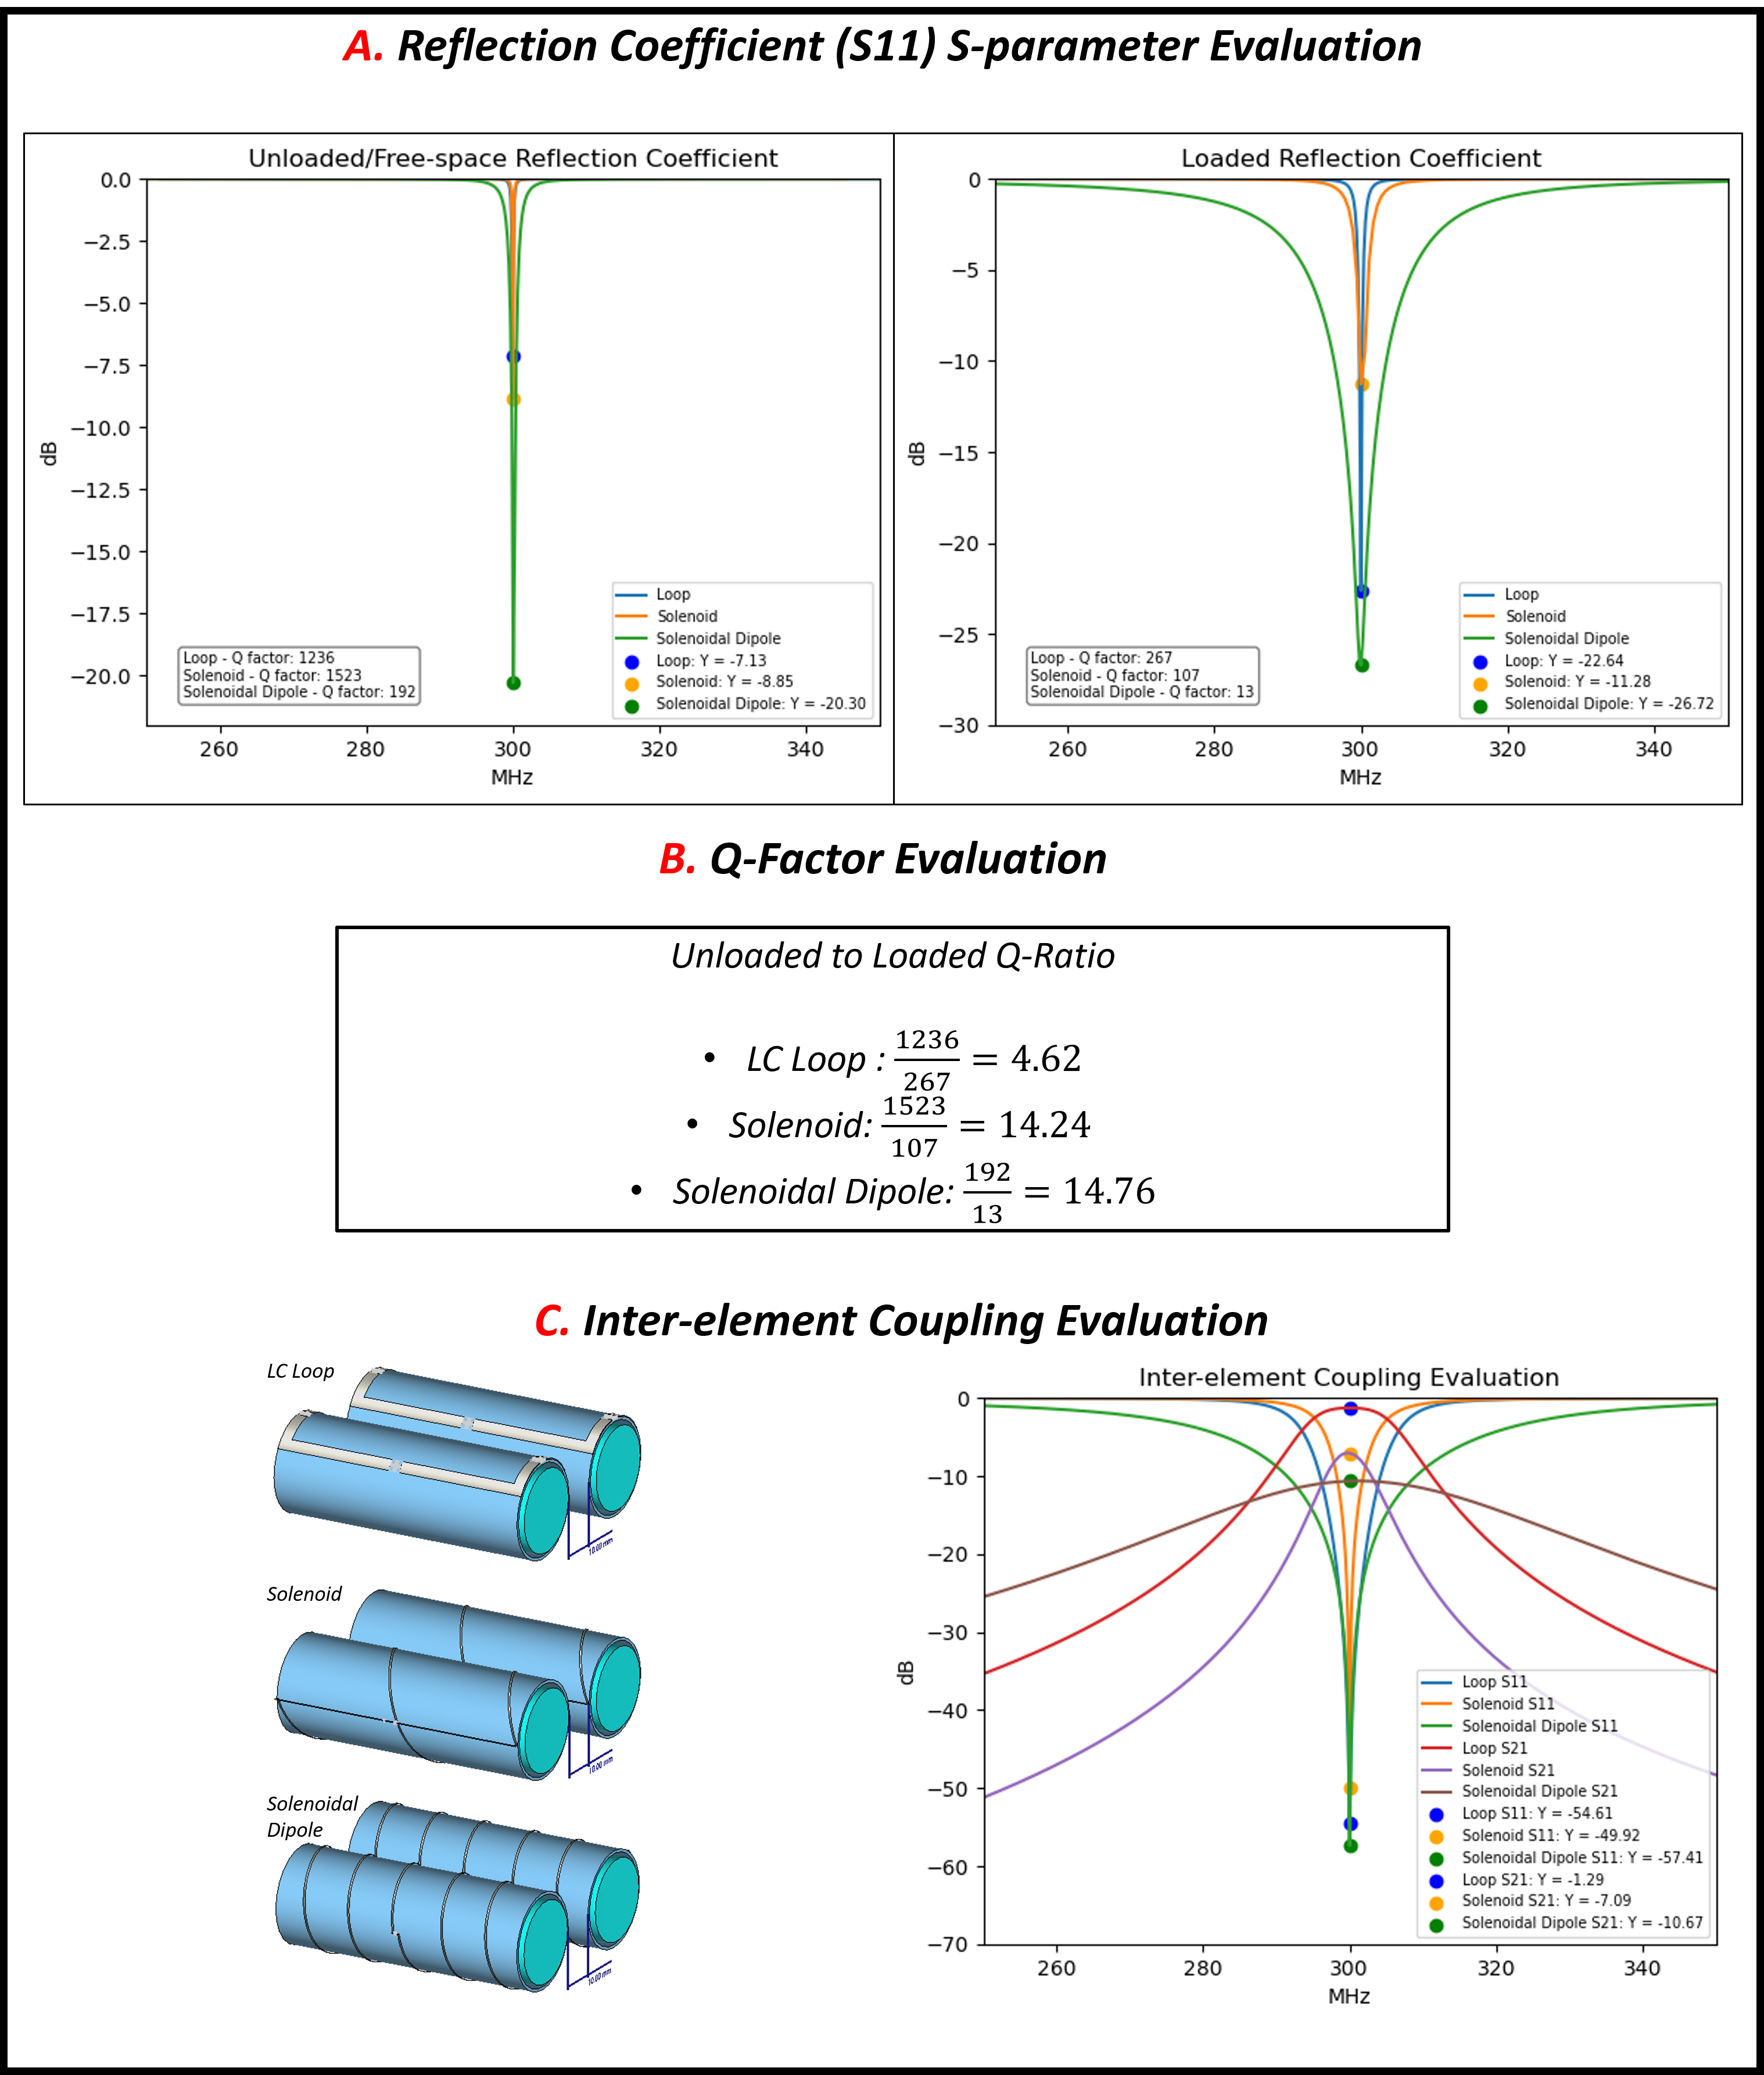
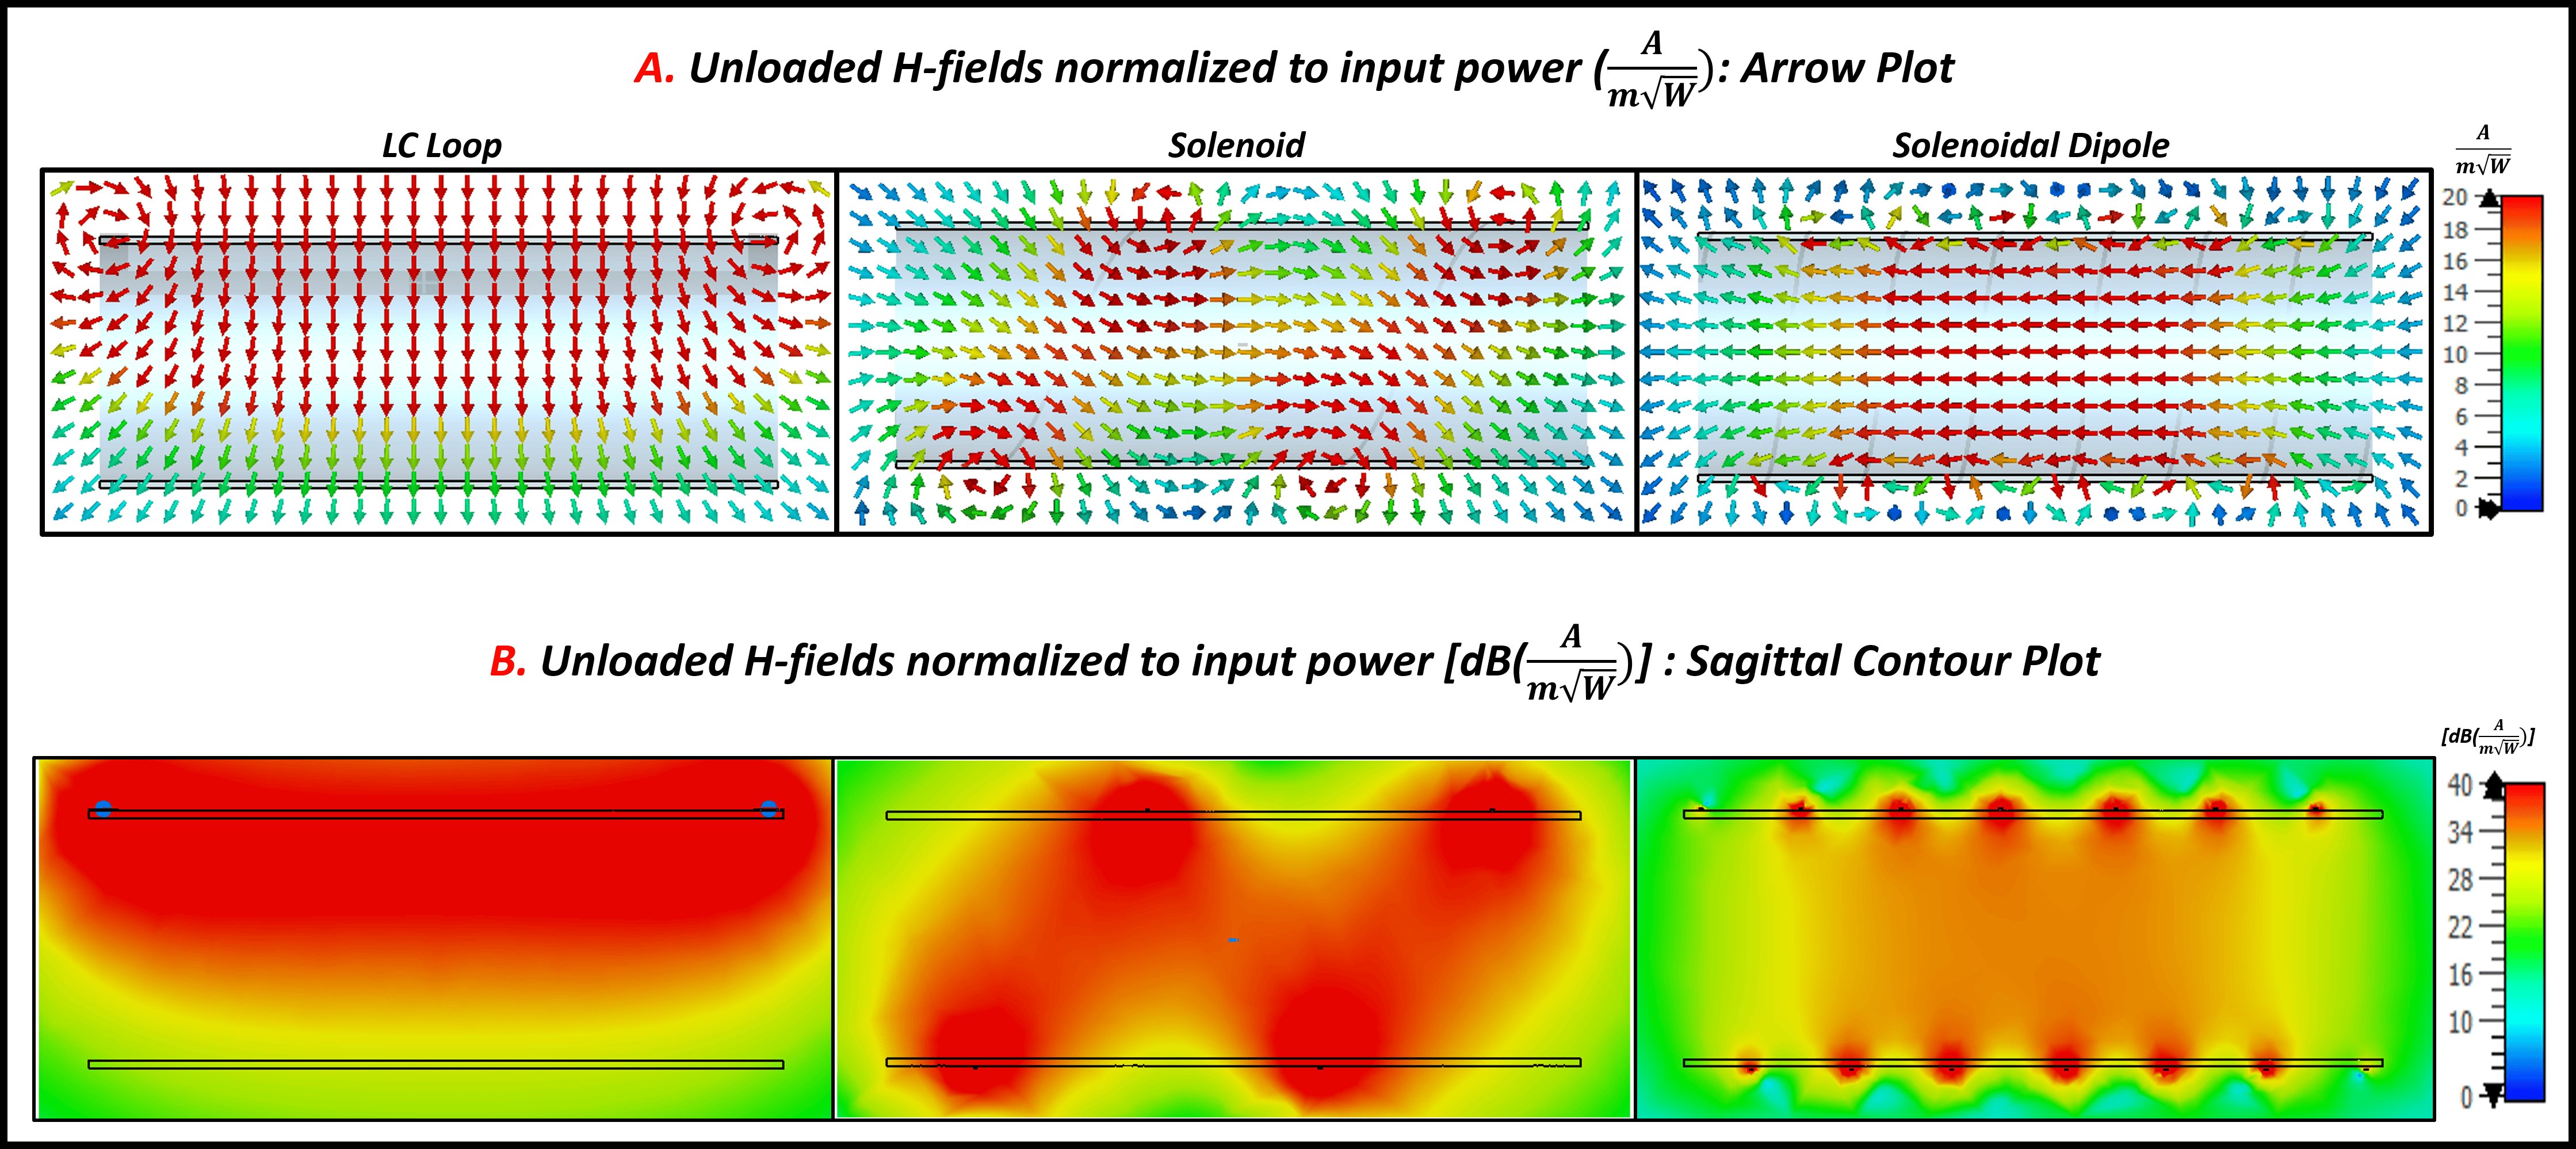
Figure3. Unloaded/Free-space H-field evaluations. (A) The H-field arrow plot depicting the flux directions and uniformity for each coil design. (B) The H-field contour plot displaying the field distribution and coverage for the respective coil design.
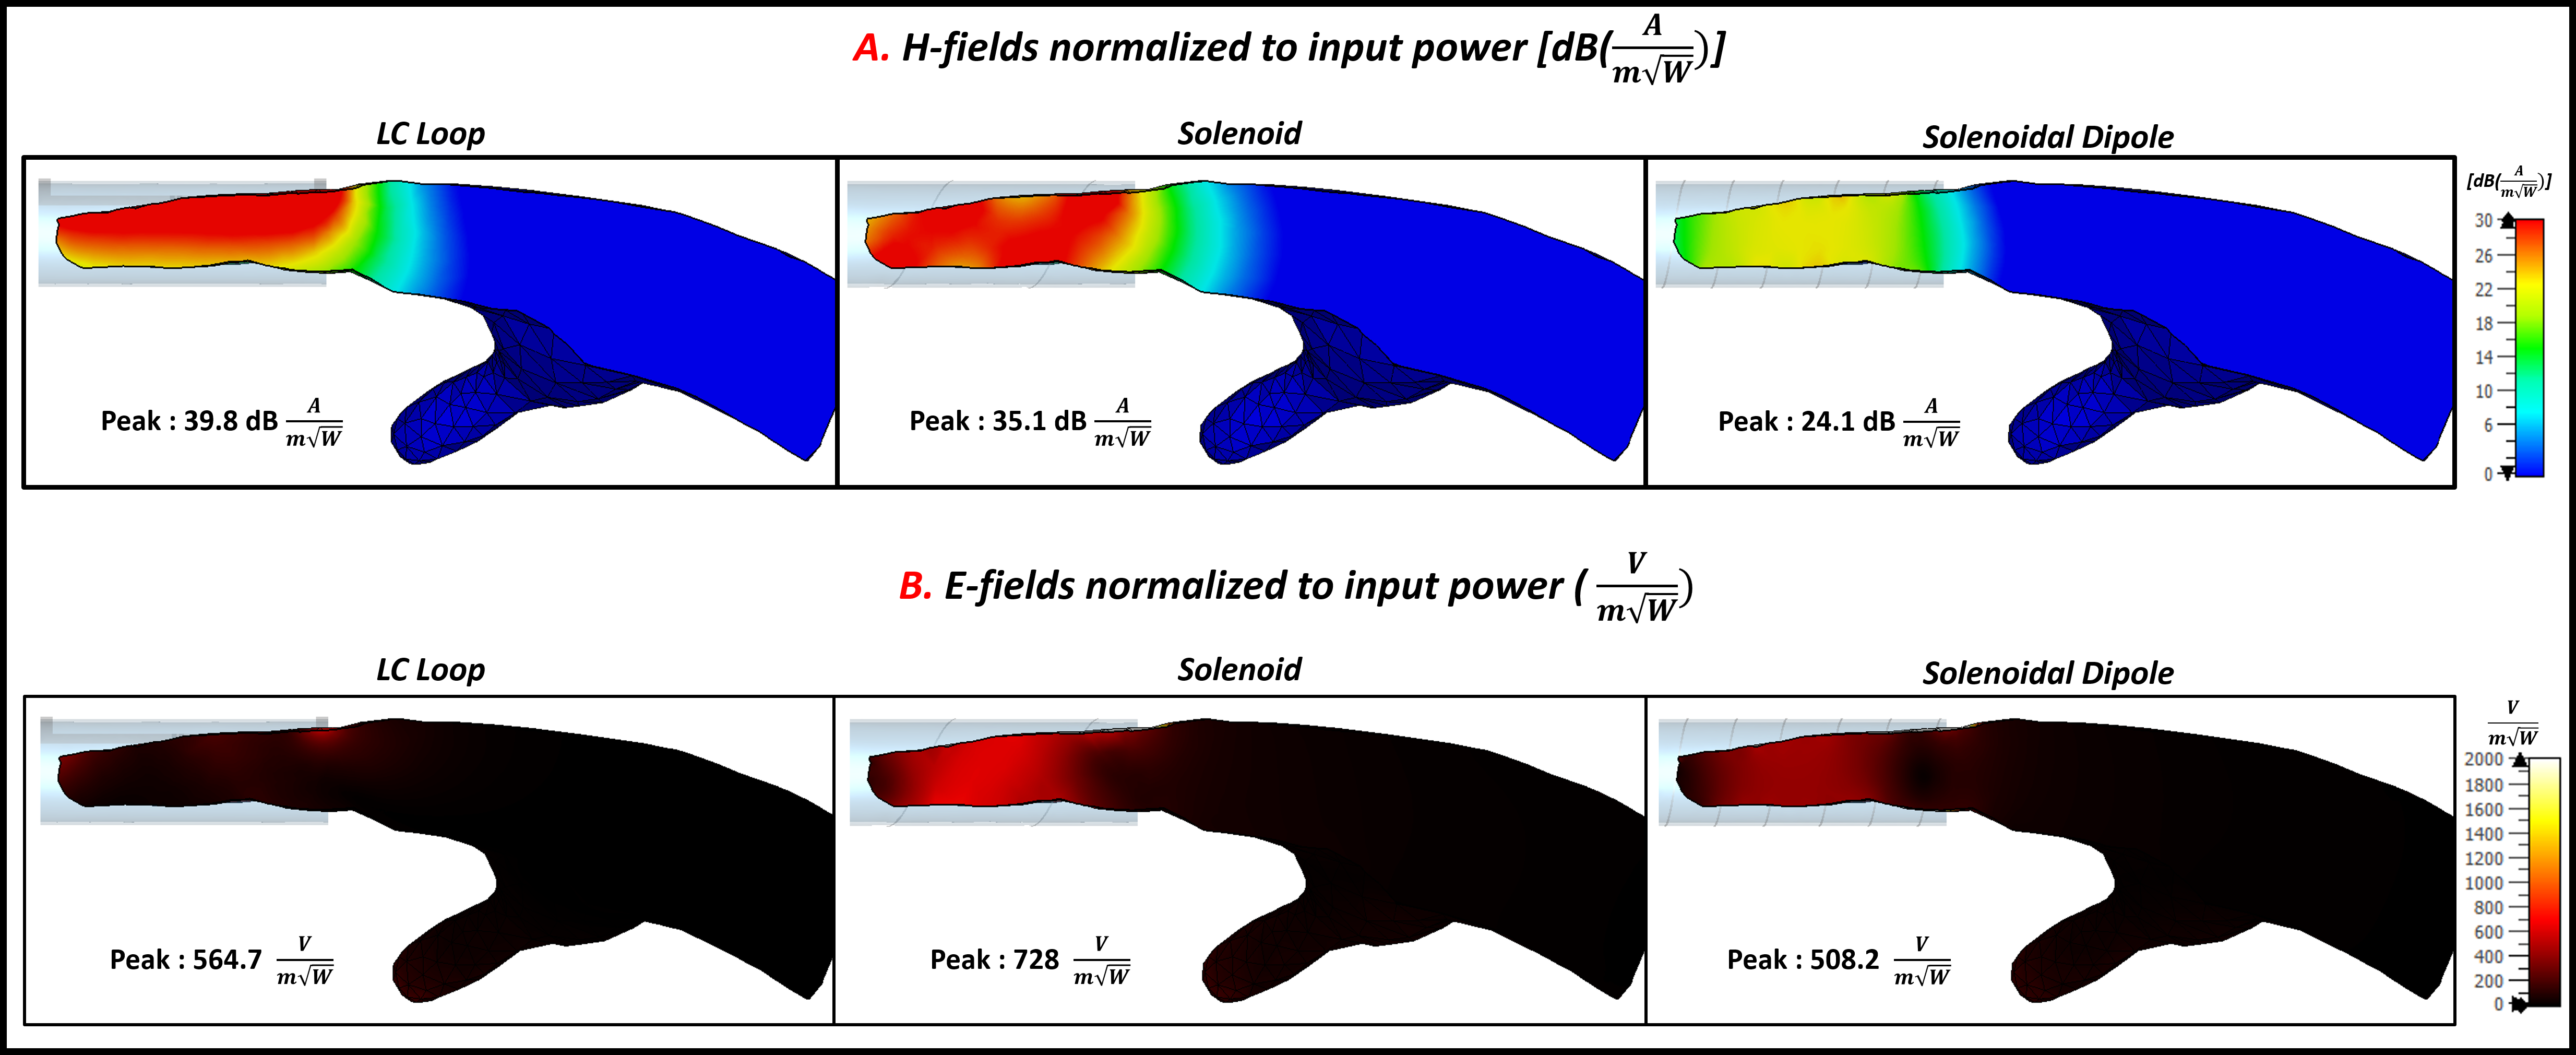
Figure4. The H-field and E-field efficiency evaluations in the human hand imaging sample under the loaded condition evaluation. (A) Normalized H-field distribution in the phantom's central sagittal plane, with peak values on the plane labeled for each design. (B) Normalized E-field distribution in the phantom's central sagittal plane and peak values on the plane labeled for each design.
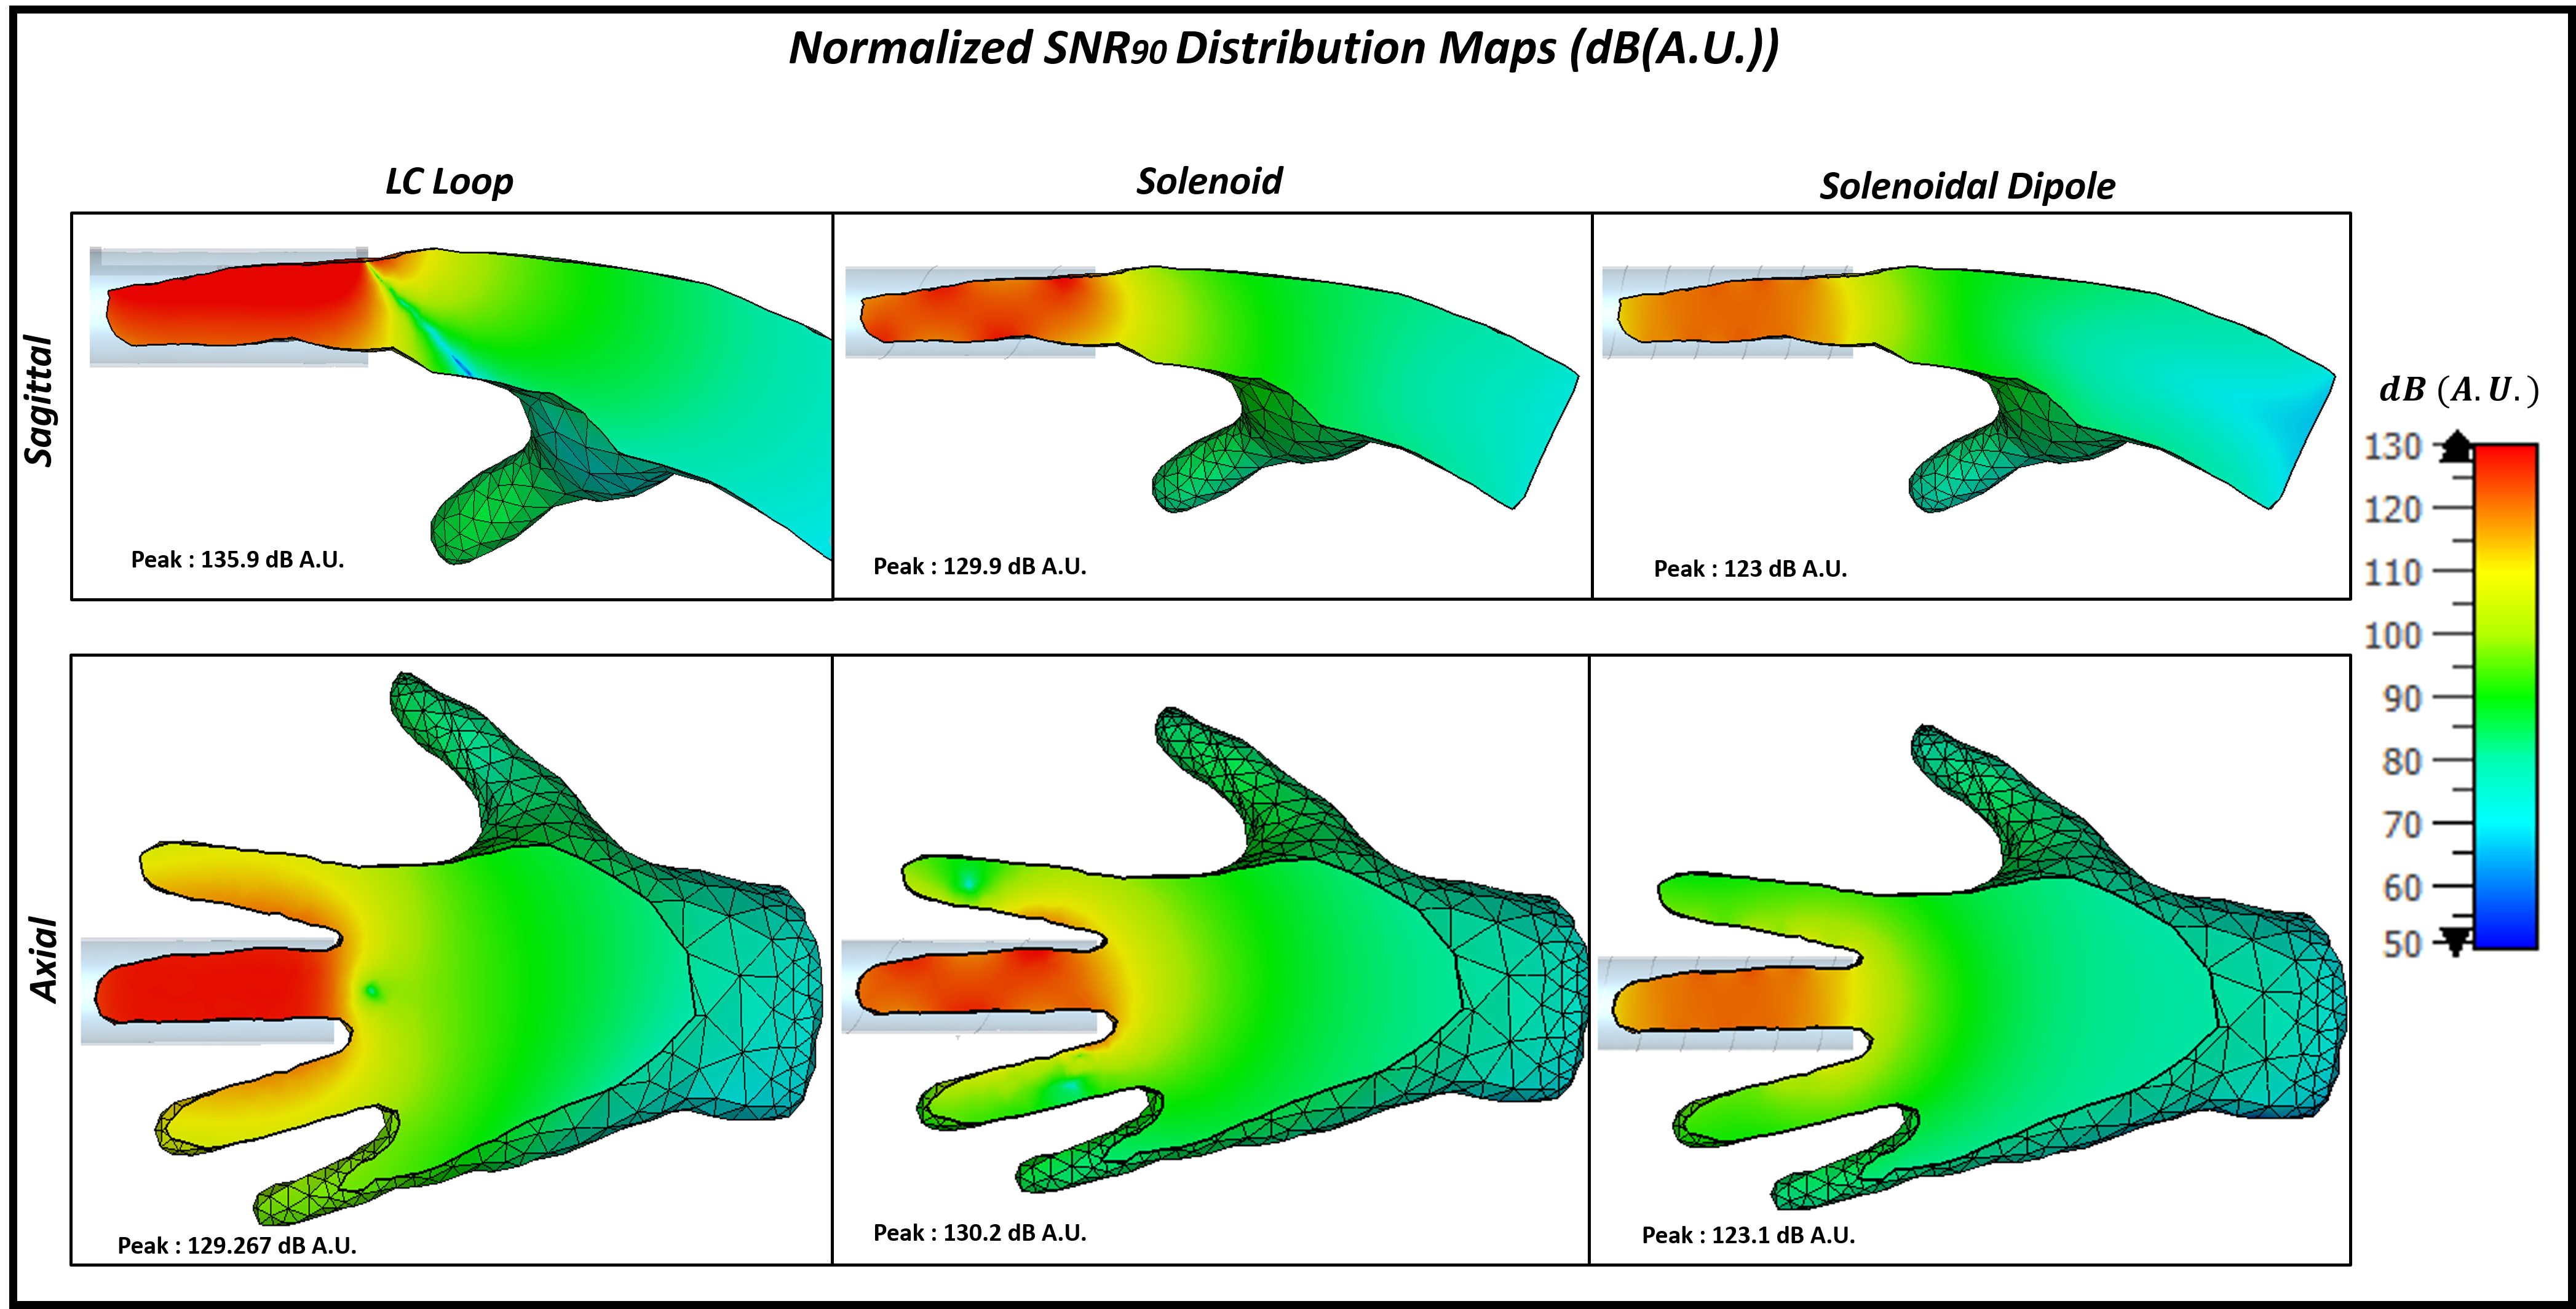
Figure5. The SNR distribution in the human hand imaging sample. The figures show the SNR maps in the human hand phantom's central sagittal and axial planes, as well as the peak SNR values recorded on each plane for the respective coil labeled in the figure.