1561
Relationship between lumbar disc degeneration and bone mineral density in middle-aged and elderly population with non-specific low back pain1Chengdu Sport University, Chengdu, China, 2Sichuan Province Orthopedic Hospital, Chengdu, China, 3GE HealthCare MR Research, Beijing, China
Synopsis
Keywords: Other Musculoskeletal, Degenerative
Motivation: Lumbar disc degeneration (LDD) is a major cause of lower back pain, but the relationship of LDD and adjacent structures, especially bone mineral density (BMD), is unclear, which confuses clinicians in estimating condition.
Goal(s): To investigate the relationship between LDD and BMD in a non-specific low back pain (NSLBP) population.
Approach: We assessed the relationship between the extent of LDD, obtained from MRI, and BMD of vertebral bodies, measured using quantitative CT, in NSLBP patients.
Results: Our results showed that LDD was negatively correlated with vertebra BMD in NSLBP patients, with L2/3 disc degeneration serving as an independent influencing factor for vBMD.
Impact: L2/3 intervertebral disc degeneration is an independent influencing factor for vBMD. Further investigation can explore if the degree of L2/3 intervertebral disc degeneration through MRI can predict OP, thereby reducing the occurrence of complications such as osteoporotic fractures.
Introduction
Nonspecific low back pain (NSLBP) refers to LBP of unknown origin that is not attributed to specific spinal diseases or radicular pain. It accounts for approximately 90% of patients with LBP and significantly affects people's lives. Age-related lumbar disc degeneration (LDD) and osteoporosis (OP) are both causes of low back pain1. LDD is characterized by biomechanical and structural changes in intervertebral discs, including annular rupture and protrusion of the nucleus pulposus, which can compress the spinal cord and nerve roots, leading to LBP. OP is characterized by low bone mass and microstructural deterioration, making individuals susceptible to low-energy fragility fractures. Both conditions impose a significant health burden on society and individuals. Bone mineral density (BMD) is a reliable and precise surrogate measure for bone strength, commonly utilized to assess the risk of fractures2. However, the relationship between LDD and BMD remains controversial3, and LDD patients may have a higher risk of osteoporotic fractures4. Therefore, studying the relationship between LDD and BMD is of great significance and can provide valuable insights for the clinical prevention and treatment of osteoporotic fractures. Compared to traditional X-ray and CT, magnetic resonance imaging (MRI) is radiation-free and more sensitive in assessing LDD. We selected NSLBP patients from middle-aged and elderly population as the study subjects and investigated the relationship between LDD and OP using MRI and quantitative CT (QCT).Methods
Patients: After IRB-approved written informed consent was obtained, patients with NSLBP were scanned on 3.0 T MRI (SIGNA Architect, GE Healthcare) and CT (Siemens Somatom Definition AS+) to measure the grade of LDD and vBMD, respectively. 308 subjects were enrolled in study.Imaging parameters: The MR scan included axial T2 FSE (0.5×0.8×3.0 mm3, TR=3224 ms, TE=120 ms).
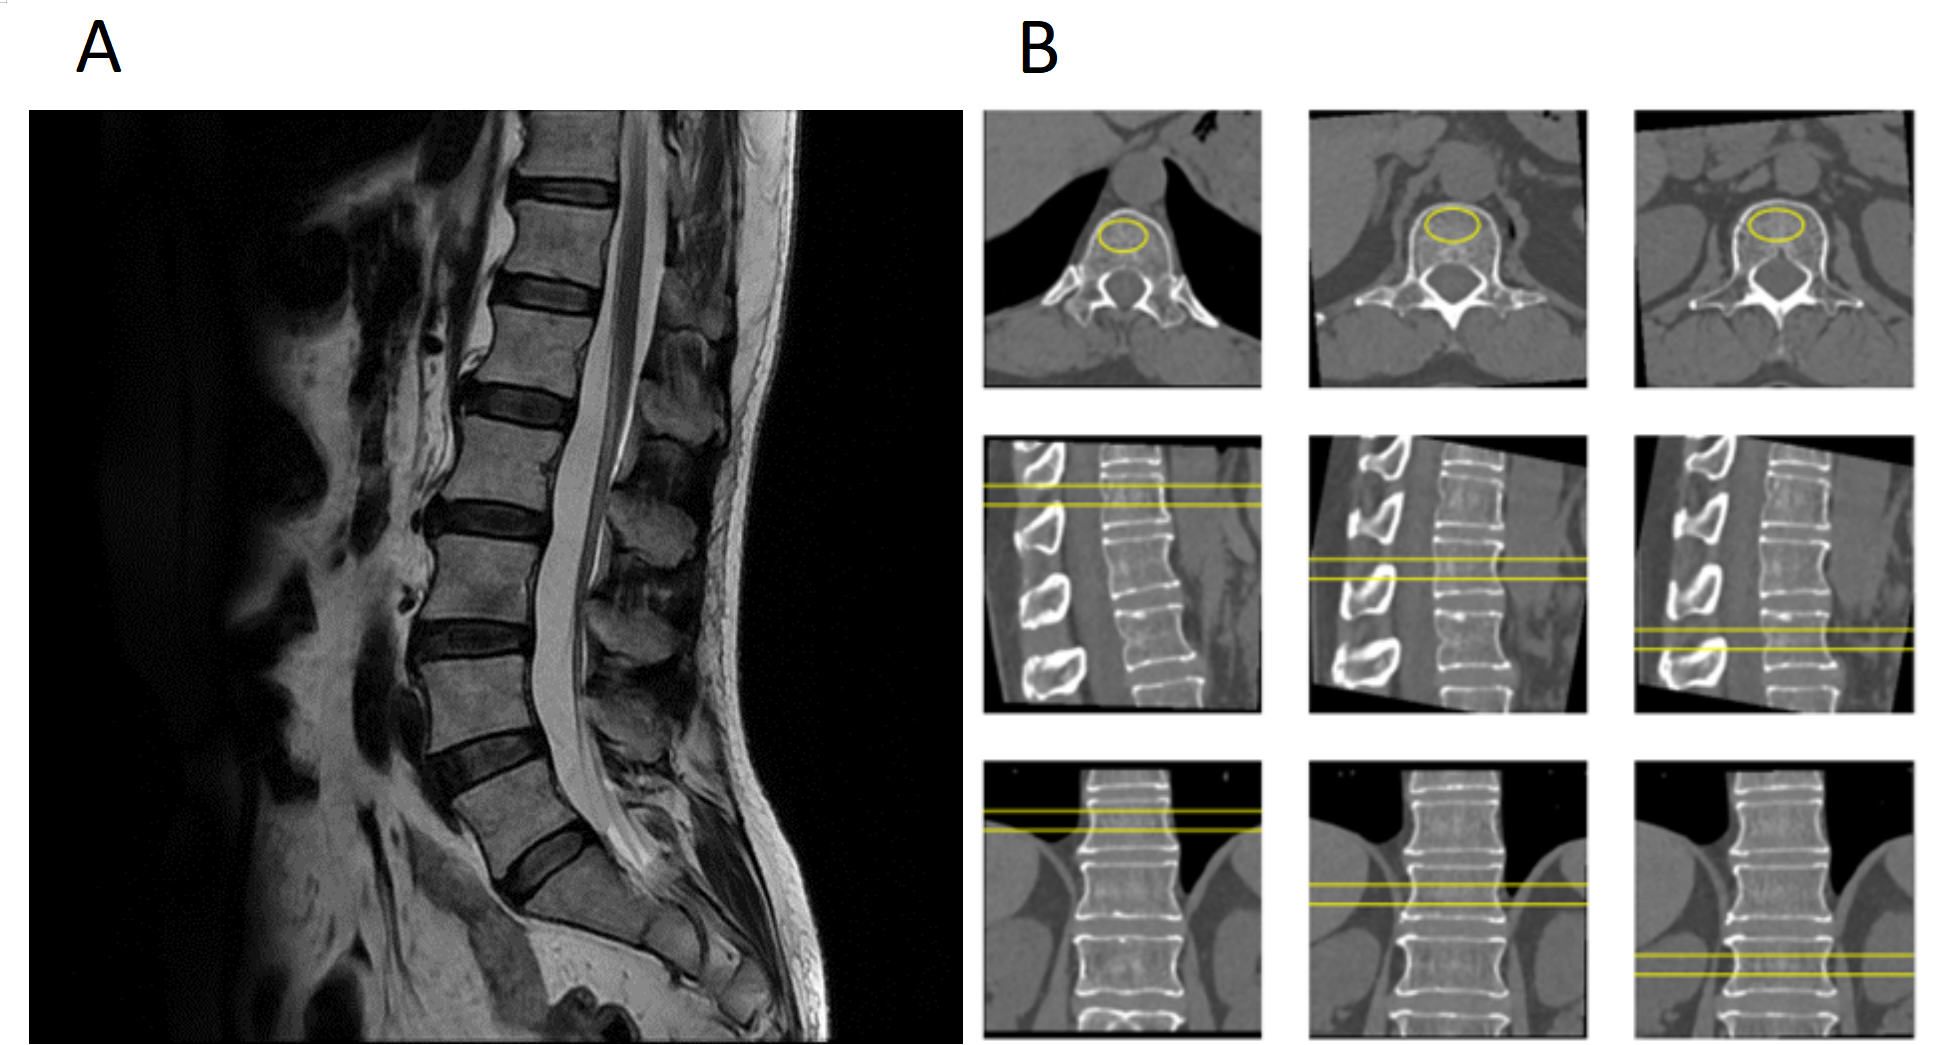
Data processing: The degree of intervertebral disc degeneration at L1/2-L5/S1 was evaluated using the modified 8-grade Pfirrmann classification standard5 on MRI T2W images (Figure 1A). CT Data were transmitted to QCT Pro workstation to measure the mean vBMD of three vertebral bodies at T12, L1, and L2 levels (Figure 1B).The patients were divided into three groups based on the measured BMD values6: 1) bone mass normal group with an absolute BMD value >120 mg/cm3; 2) bone mass reduction group with an absolute BMD value of 80-120 mg/cm3; 3) osteoporosis group with an absolute BMD value <80 mg/cm3.
Statistical analysis: All analyses were performed using SPSS 26.0 software. One-way analysis of variance (ANOVA) was used to compare age, weight, height, BMI among the three groups. Chi-square test was used to compare gender distribution. Kruskal-Wallis H test was used to compare the differences in degeneration grades of intervertebral discs from L1/L2 to L5/S1 and the average intervertebral disc. Spearman's rank correlation was used to evaluate the correlation between LDD and vBMD. Multiple regression analysis was conducted to assess the relationship between vBMD and age, body mass index, and lumbar intervertebral disc degeneration.
Results
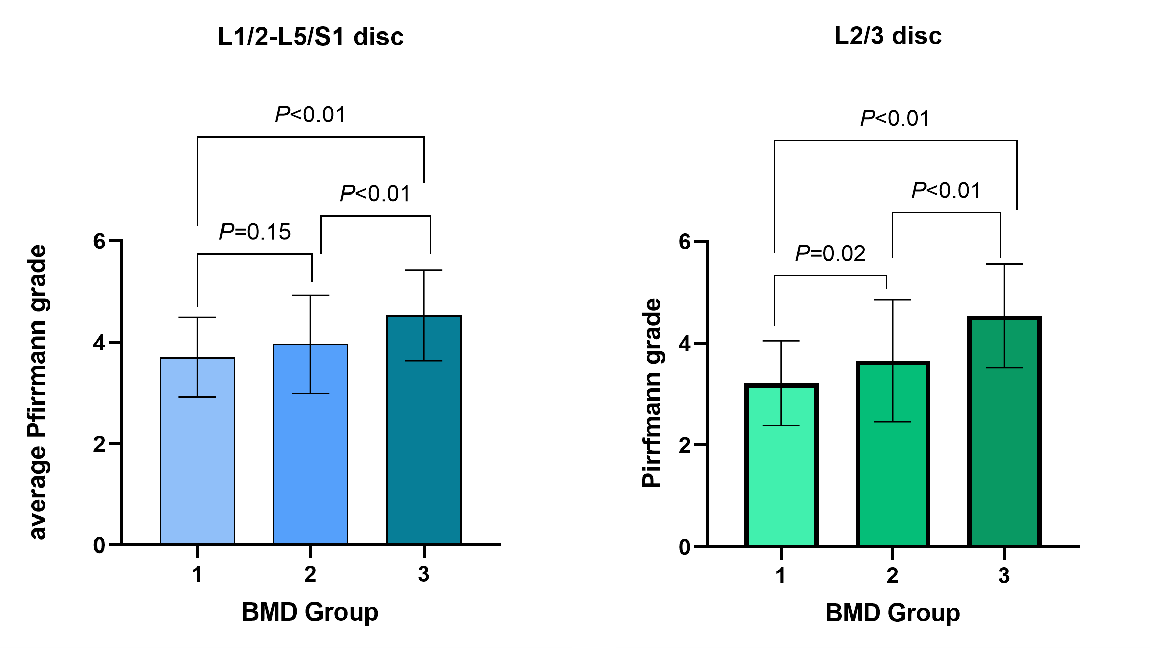
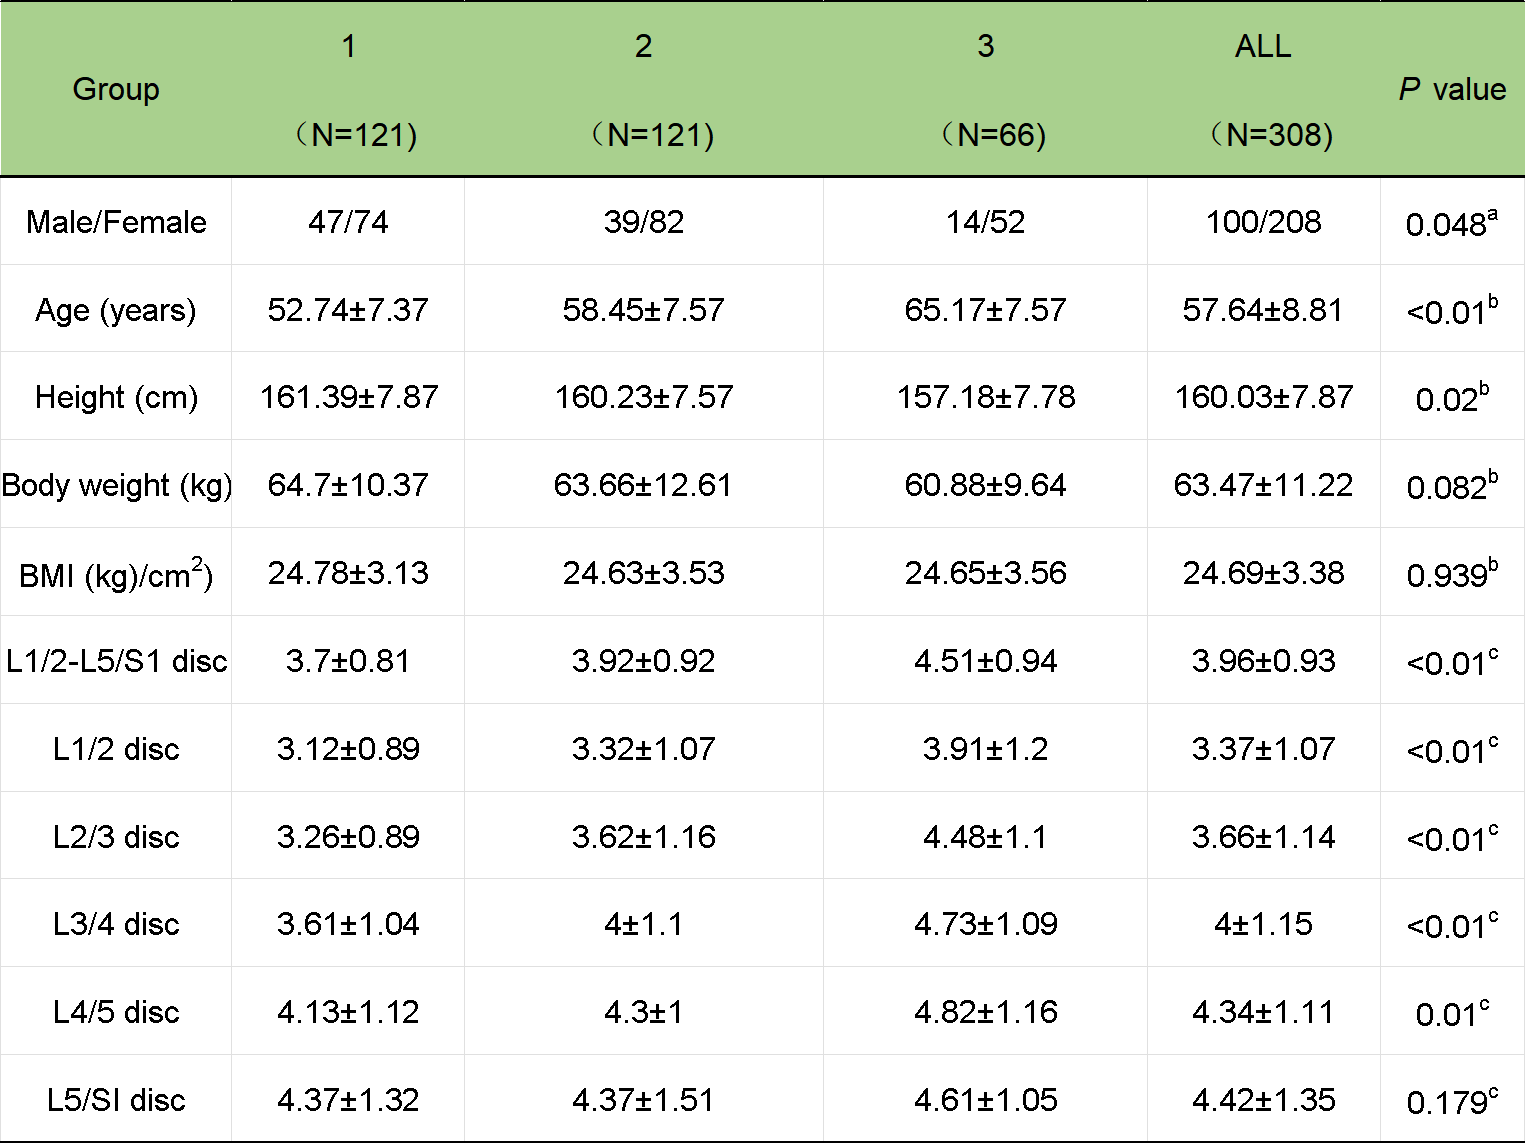
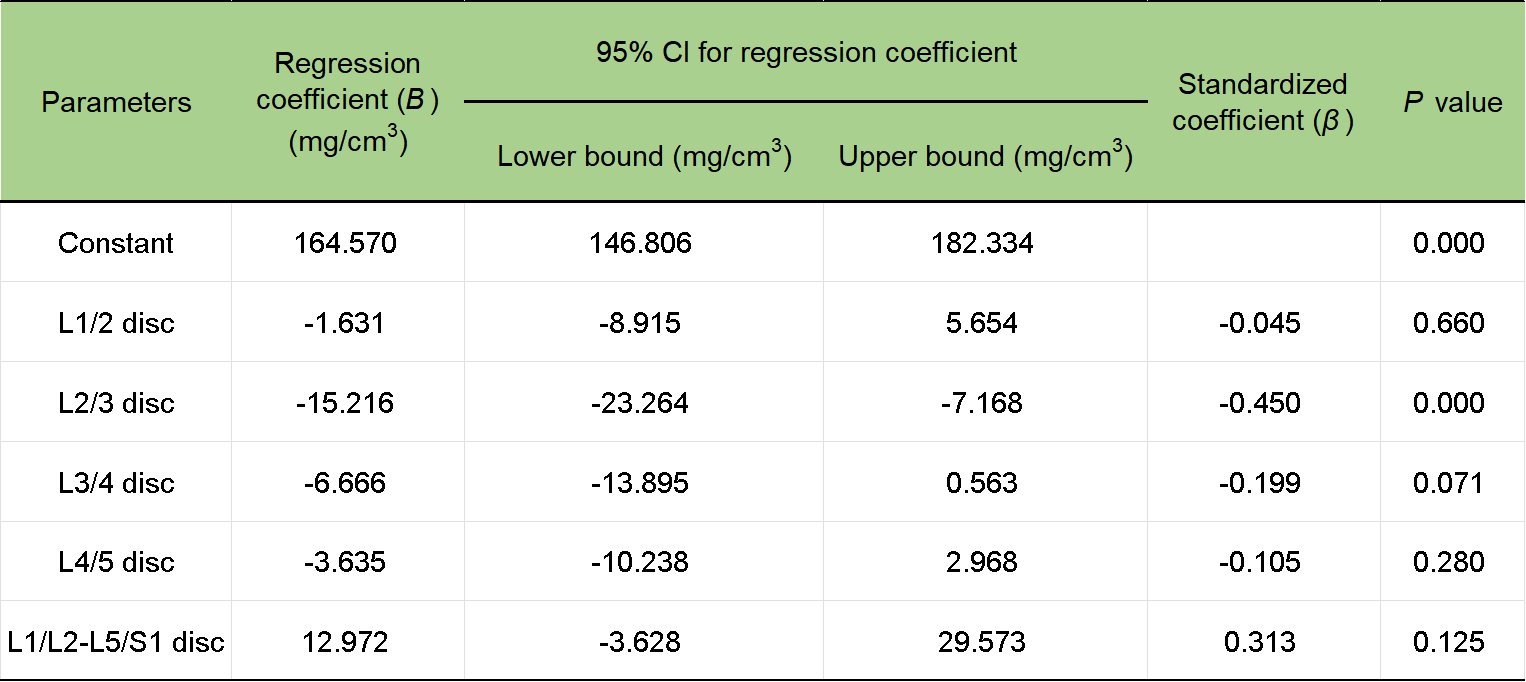
As shown in Table 1 and Figure 2, there were statistically significant differences in age, height, and L1/2-L4/5 intervertebral disc degeneration degree among three groups (P<0.05). Note that OP group showed significantly higher Pfirrmann grade than the other two groups. As shown in Table 2, except for BMI and L5/S1 intervertebral disc, age, and the degree of intervertebral disc degeneration in other segments were negatively correlated with vBMD (P<0.05). As shown in Table 3, in the multiple linear regression analysis, only L2/3 intervertebral disc was an independent influencing factor for vBMD (β= -0.369, P=0.001).Discussion
Our results indicated a negative correlation between LDD and vBMD in middle-aged and elderly NSLBP patients, with L2/3 being an independent influencing factor for vBMD. The possible reason for the negative correlation between LDD and vBMD is that vBMD decrease may lead to vertebral instability, microcirculation disorders, and endplate degeneration, resulting in uneven stress and restricted nutrient absorption in the intervertebral disc, which promotes disc degeneration7. In clinical practice, L1/L2-L3/L4 intervertebral disc degeneration is mostly physiological and less affected by structural and load factors compared to L5/S1, making it more reflective of the physiological degeneration of the spine8 and more closely related to OP. MRI has the advantage of being radiation-free, and our study reveals the potential of using L2/3 intervertebral disc degeneration on MRI to predict the occurrence of OP, which can help prevent osteoporotic fractures from occurring in advance.Conclusions
LDD and vBMD are negatively correlated in the NSLBP population, with L2/3 intervertebral disc being an independent influencing factor for vBMD. This provides important evidence for using MRI to assess the degree of intervertebral disc degeneration in patients and predict the risk of OP.Acknowledgements
No acknowledgement found.References
1. Teraguchi M, Yoshimura N, Hashizume H, et al. Progression, incidence, and risk factors for intervertebral disc degeneration in a longitudinal population-based cohort: the Wakayama Spine Study. Osteoarthritis Cartilage. 2017;25(7):1122-1131. doi:10.1016/j.joca.2017.01.001
2. Compston JE, McClung MR, Leslie WD. Osteoporosis. The Lancet. 2019;393(10169):364-376. doi:10.1016/S0140-6736(18)32112-3
3. Wáng YXJ. Senile osteoporosis is associated with disc degeneration. Quantitative Imaging in Medicine and Surgery. 2018;8(6):55156-55556. doi:10.21037/qims.2018.07.04
4. Castaño-Betancourt MC, Oei L, Rivadeneira F, et al. Association of lumbar disc degeneration with osteoporotic fractures; the Rotterdam study and meta-analysis from systematic review. Bone. 2013;57(1):284-289. doi:10.1016/j.bone.2013.08.004
5. Griffith JF, Wang YXJ, Antonio GE, et al. Modified Pfirrmann grading system for lumbar intervertebral disc degeneration. Spine (Phila Pa 1976). 2007;32(24):E708-712. doi:10.1097/BRS.0b013e31815a59a0
6. Baim S, Binkley N, Bilezikian JP, et al. Official Positions of the International Society for Clinical Densitometry and executive summary of the 2007 ISCD Position Development Conference. J Clin Densitom. 2008;11(1):75-91. doi:10.1016/j.jocd.2007.12.007
7. Geng J, Huang P, Wang L, et al. The association of lumbar disc degeneration with lumbar vertebral trabecular volumetric bone mineral density in an urban population of young and middle-aged community-dwelling Chinese adults: a cross-sectional study. J Bone Miner Metab. 2023;41(4):522-532. doi:10.1007/s00774-023-01422-1
8. Sabnis AB, Chamoli U, Diwan AD. Is L5-S1 motion segment different from the rest? A radiographic kinematic assessment of 72 patients with chronic low back pain. Eur Spine J. 2018;27(5):1127-1135. doi:10.1007/s00586-017-5400-4
Figures