1560

AutoML Radiomics-Based Classification for Opportunistic Osteoporosis Screening with Lumbar Fat and Water using IDEAL-IQ MRI
Yung-Yin Cheng1,2, Chun-Wen Chen3, Chun-Han Liao1,4,5, Ming-Cheng Liu1,6, Shao-Chieh Lin1, Pin-Sian Lyu7, Tzu-Yu Chiu7, Chen Chung Ou7, and Yi-Jui Liu7
1Ph.D. program in Electrical and Communication Engineering in Feng Chia University, Taichung, Taiwan, taichung, Taiwan, 2Department of Medical Imaging, Chung Shan Medical University Hospital,Taichung, Taiwan, taichung, Taiwan, 3Department of Radiology, School of Medicine, National Defense Medical Center, Taipei, Taiwan, taichung, Taiwan, 4Department of Medical Imaging, Yuanlin Christian Hospital, Changhua, Taiwan, taichung, Taiwan, 5Department of Medical Imaging, Changhua Christian Hospital, Changhua, Taiwan, taichung, Taiwan, 6Department of Radiology, Taichung Veterans General Hospital, Taichung, Taiwan, taichung, Taiwan, 7Department of Automatic Control Engineering, Feng Chia University, Taichung, Taiwan, taichung, Taiwan

Synopsis

Keywords: Skeletal, Skeletal

Motivation: Could lumbar fat and water MRI be as an opportunistic screening tool?

Goal(s): To develop autoML radiomics-Based Classification for osteoporosis prediction using lumbar fat and water MRI.

Approach: A TPOP-radiomics classification model was trained using lumbar fat and water images obtained through the IDEAL-IQ method in normal and osteoporosis patients identified by DeXA. Three datasets of radiomics features were used, categorized based on their dimension (2D, 3D, and projection map)

Results: Our results indicate that the best model from the AutoML process demonstrated mean sensitivity of 0.745 and mean specificity of 0.758 in distinguishing between normal and osteroporosis.

Impact: Because osteoporosis is often considered a 'silent' disease, routine IDEAL-IQ lumbar scans have the potential to serve as an opportunistic screening tool for reducing the risk of fragility fractures, which are associated with morbidity and mortality.

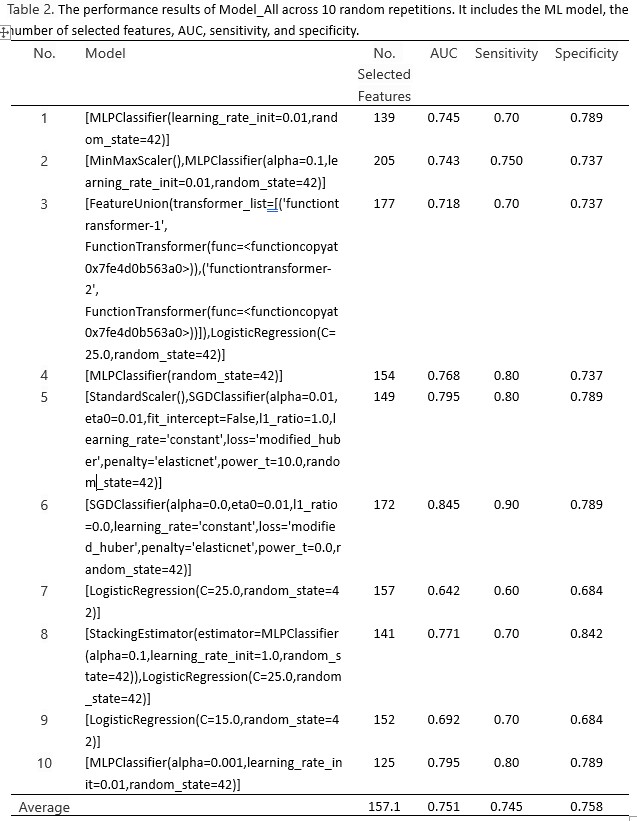
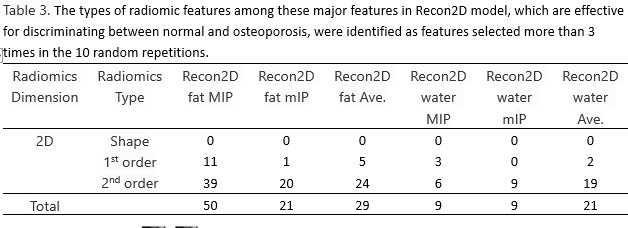
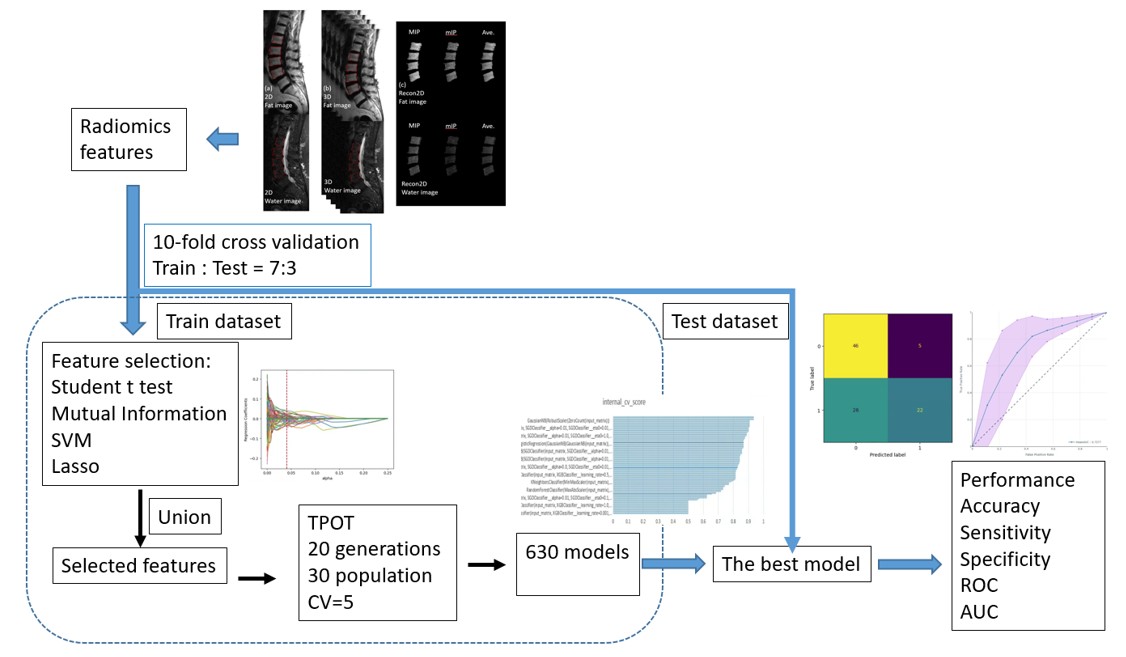
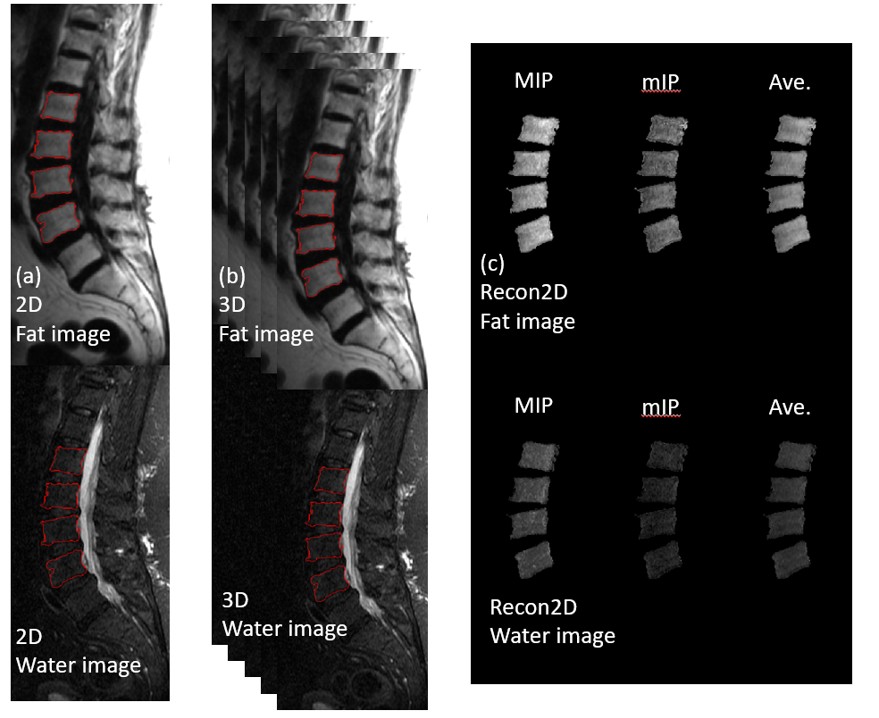
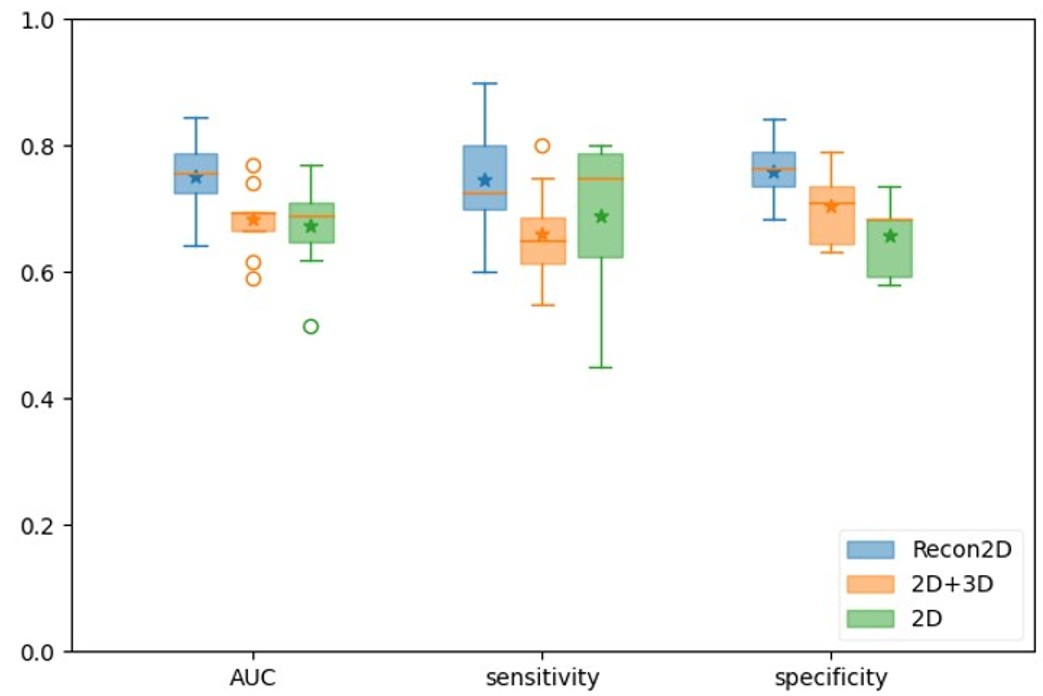
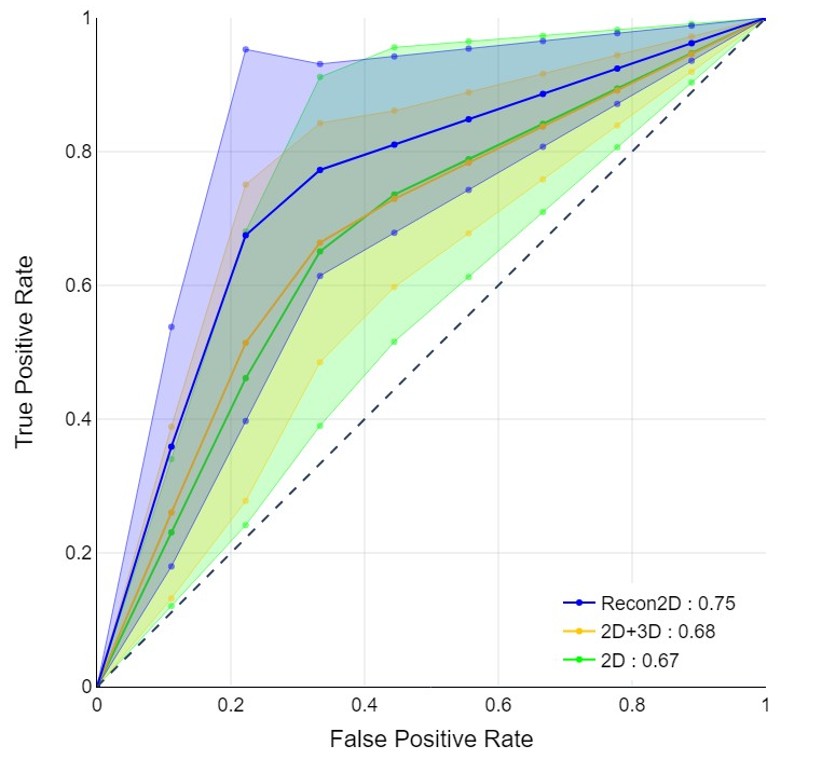
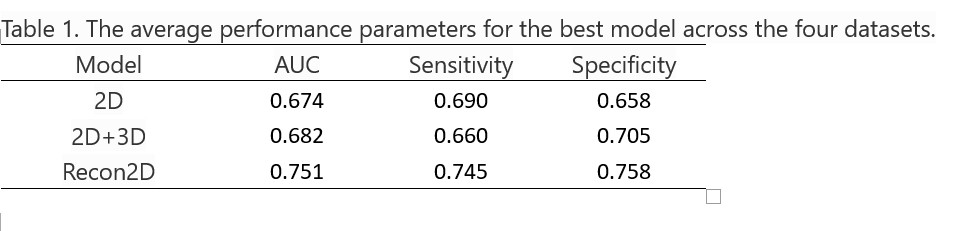
Introduction Osteoporosis, characterized by reduced bone mass and microarchitectural deterioration [1], is typically identified by declines in bone mineral density (BMD) scores measured through dual-energy X-ray absorptiometry (DXA) [2]. It's associated with an increased risk of fragility fractures, including hip and vertebral fractures, which carry significant morbidity and a 25–35% mortality rate at 1 year post-hip fracture [3]. Osteoporosis is often considered a "silent" disease due to the absence of obvious symptoms. Spine MRIs are a routine part of daily MRI scans. Using daily lumbar MRI evaluations as an opportunistic osteoporosis screening tool can aid in early detection. Recent studies have reported reduced osteogenesis and increased adipogenesis in aging bone [4], increased adipose tissue and reduced bone formation in osteoporosis [5]. The state-of-the-art MRI technique, IDEAL-IQ, offers precise fat and water mapping capabilities [6]. Therefore, IDEAL-IQ can be applied opportunistically for screening lumbar vertebral osteoporosis. Radiomics-based machine learning (ML) models are an emerging field in clinical medicine, extensively used for precise disease detection, diagnosis, prediction, and prognosis [7].The Tree-based Pipeline Optimization Tool (TPOT), an automated machine learning (AutoML) algorithm, autonomously designs and optimizes ML pipelines for specific problem domains without human intervention [8]. This study aimed to develop a TPOP-radiomics classification model for discriminating between normal and osteoporosis using fat and water MR images. Methods Image Data: We enrolled 65 patients with osteoporosis and 64 normal subjects of corresponding age to the patients, as identified by BMD measures using DeXA. Fat, water, fat fraction, and water fraction images were obtained through quantitative MRI using the IDEAL-IQ method on sagittal images. A total of 10 to 14 slices covered the lumbar spine from the T12 vertebra to the sacrum. The region of interest (ROI) of lumbar vertebra (L1~L4) was segmented and then reviewed with slice-by-slice by a senior radiologist. Figure 1 illustrates the TPOP-radiomics model workflow. Feature Extraction and Selection: We employed Pyradiomics (version 1.3.0) to automatically extract radiomic features. Feature selection involved several steps: First, we retained Radiomics features with significant differences using Student's t-test (p < 0.05). Second, we selected features by combining the results of four optimal screening methods, which included ANOVA, L1 regularized LASSO regression, mutual information, and linear support vector machines (SVM). Finally, the selected features underwent normalization for scaling. TPOT: In this study, we applied TPOT (version 0.12.1), an AutoML tool for Python that leverages scikit-learn to search for the best model using its default configuration, which includes all data operators and machine learning classification models. The TPOT search was set to run for 20 generations and 30 population size sets with five-fold cross-validation. Additionally, we performed 10 random repetitions for the dataset in which the training and test data were split at a ratio of 70% for training and 30% for testing. Three datasets were used to compare the performance of AutoML-radiomics model in discriminating between normal and osteoporosis. These datasets (Figure 2) were generated based on a model with the largest lumbar area slice (2D), a model with whole lumbar and the largest lumbar area slice (2D+3D), and a model with reconstructed 2D map (Recon2D) from whole lumbar volume including max intensity projection (MIP), min intensity projection (mIP), and average. Performance evaluation: In comparing all the models, various performance evaluations were employed, including sensitivity, specificity, and the area under the curve (AUC). Results Table 1 displays the average performance parameters for the best model across the three datasets. Figure 3 presents box plots for the AUC, sensitivity, and specificity of the three models across 10 random repetitions. Figure 4 displays the ROC curves for these models. Among all the models studied, Recon2D demonstrated the best performance with mean sensitivity of 0.745 and mean specificity of 0.758 in distinguishing between normal and osteoporosis. Table 2 displays the performance results of Recon2D across 10 random repetitions. The types of radiomic features among these major features are presented in Table 3. Discussion and Conclusion In this study, we employed a TPOP-radiomics-based model using fat and water MRI for automatic ML model selection to distinguish between normal and osteoporosis. While previous research has shown the effectiveness of fat fraction MRI and clinical data for this discrimination [9], our study focused solely on fat and water MRI, potentially enhancing the scope of osteoporosis opportunistic screening. The Recon2D model exhibited the best performance, which could be attributed to BMD measurements being 2D projections in DeXA. In summary, our study demonstrates that the TPOP-radiomics-based model enables opportunistic osteoporosis screening using fat and water MRI.

Acknowledgements

Supported by Taiwan National Science and Technology Council under grants 111-2314-B-035 -001 -MY3, and by the Taichung Armed Forces General Hospital (Grant no.: 107A42 and 108A16).

References

1. Compston JE, McClung MR, Leslie WD. Osteoporosis. Lancet. 2019 Jan 26;393(10169):364-376. doi: 10.1016/S0140-6736(18)32112-3. PMID: 30696576.

2. Haseltine KN, Chukir T, Smith PJ, Jacob JT, Bilezikian JP, Farooki A. Bone Mineral Density: Clinical Relevance and Quantitative Assessment. J Nucl Med. 2021 Apr;62(4):446-454. doi: 10.2967/jnumed.120.256180. Epub 2020 Dec 11. PMID: 33310738; PMCID: PMC8049374.

3. Rizkallah M, Bachour F, Khoury ME, Sebaaly A, Finianos B, Hage RE, Maalouf G. Comparison of morbidity and mortality of hip and vertebral fragility fractures: Which one has the highest burden? Osteoporos Sarcopenia. 2020 Sep;6(3):146-150. doi: 10.1016/j.afos.2020.07.002. Epub 2020 Aug 8. PMID: 33102809; PMCID: PMC7573502.

4. Hoffman CM, Han J, Calvi LM. Impact of aging on bone, marrow and their interactions. Bone. 2019 Feb;119:1-7. doi: 10.1016/j.bone.2018.07.012. Epub 2018 Jul 17. PMID: 30010082.

5. Verma S, Rajaratnam JH, Denton J, Hoyland JA, Byers RJ. Adipocytic proportion of bone marrow is inversely related to bone formation in osteoporosis. J Clin Pathol. 2002 Sep;55(9):693-8. doi: 10.1136/jcp.55.9.693. PMID: 12195001; PMCID: PMC1769760.

6. Kim HJ, Cho HJ, Kim B, You MW, Lee JH, Huh J, Kim JK. Accuracy and precision of proton density fat fraction measurement across field strengths and scan intervals: A phantom and human study. J Magn Reson Imaging. 2019 Jul;50(1):305-314. doi: 10.1002/jmri.26575. Epub 2018 Nov 14. PMID: 30430684. 7. Chen C, Du X, Yang L, Liu H, Li Z, Gou Z, Qi J. Research on application of radiomics in glioma: a bibliometric and visual analysis. Front Oncol. 2023 Sep 12;13:1083080. doi: 10.3389/fonc.2023.1083080. PMID: 37771434; PMCID: PMC10523166.

8. Olson, R.S., Urbanowicz, R.J., Andrews, P.C., Lavender, N.A., Kidd, L.C., Moore, J.H. (2016). Automating Biomedical Data Science Through Tree-Based Pipeline Optimization. In: Squillero, G., Burelli, P. (eds) Applications of Evolutionary Computation. EvoApplications 2016. Lecture Notes in Computer Science(), vol 9597. Springer, Cham. https://doi.org/10.1007/978-3-319-31204-0_9

9. Chen, CW., Liu, YJ., Lin, SC. et al. Predicting Lumbar Vertebral Osteopenia Using LvOPI Scores and Logistic Regression Models in an Exploratory Study of Premenopausal Taiwanese Women. J. Med. Biol. Eng. 42, 722–733 (2022). https://doi.org/10.1007/s40846-022-00746-z
Figures

Table 1. The average performance parameters for the best model across the four datasets.

Table 2. The performance results of Model_All across 10 random repetitions. It includes the ML model, the number of selected features, AUC, sensitivity, and specificity.

Table 3. The types of radiomic features among these major features in Recon2D model, which are effective for discriminating between normal and osteoporosis, were identified as features selected more than 3 times in the 10 random repetitions.

Figure 1. A workflow of TPOT-radiomic analysis for differentiating osteoporosis from normal.

Figure 2. (a) The largest lumbar area slice, (b) Whole lumbar volume, and (c) Reconstructed 2D map (Recon2D) from whole lumbar volume including max intensity projection (MIP), min intensity projection (mIP), and average.

Figure 3. A box plots for the accuracy, sensitivity, specificity, and AUC of the four models across 10 random repetitions.

Figure 4. Receiver operating characteristic (ROC) curves with 95% confidence interval (CI) on three models across 10 random repetitions.

Proc. Intl. Soc. Mag. Reson. Med. 32 (2024)
1560
DOI: https://doi.org/10.58530/2024/1560