1557
Assessing lower back myofascial interface mobility using MR elastography-based slip interface imaging (SII)1Radiology, Mayo Clinic, Rochester, MN, United States, 2Physiology and Biomedical Engineering, Mayo Clinic, Rochester, MN, United States, 3Orthopedics Research, Mayo Clinic, Rochester, MN, United States, 4Physical Medicine and Rehabilitation, Mayo Clinic, Rochester, MN, United States, 5General Internal Medicine, Mayo Clinic, Rochester, MN, United States
Synopsis
Keywords: Other Musculoskeletal, Elastography, slip interface imaging, myofascial tissue, myofascial mobility, muscle, muscle function
Motivation: Investigating abnormal myofascial adhesion is crucial for understanding chronic low back pain in myofascial pain syndrome (MPS), necessitating objective, non-invasive imaging methods to characterize myofascial mobility in the lower back.
Goal(s): To evaluate the efficacy of MR-Elastography (MRE)-based slip interface imaging (SII) technique for visualizing myofascial mobility in the lower back of healthy volunteers.
Approach: A custom-built MRE driver and a new SII biomarker (Dnorm) were introduced for detecting slip interfaces across thoracolumbar fascia and inter-muscular myofascial interfaces.
Results: The Dnorm map at a lower MRE frequency successfully provided clear visualization of lumbar slip interfaces, indicating unrestricted mobility in healthy volunteers.
Impact: The new SII biomarker enhances visualization of the interface mobility in thoracolumbar fascia and other inter-muscular interfaces in the lower back. This may benefit assessment of myofascial mobility differences between healthy individuals and patients with MPS.
Introduction
The thoracolumbar fascia (TLF) is commonly affected in patients experiencing lower back pain who have myofascial pain syndrome (MPS).1,2 Previous ultrasound studies have shown reduced TLF mobility in patients with chronic low-back pain compared to healthy subjects3, suggesting the need to understand the relationship between fascia mobility and myofascial pain for improved patient care. However, imaging of fascia mobility is still in its early stages, especially in the development of objective, non-invasive biomarkers for MPS-related myofascial function. Slip interface imaging (SII), a recently developed MR Elastography (MRE)-based technique4, quantifies the adherence between two adjacent tissue layers by calculating the normalized octahedral shear strain (NOSS)5 across the interface.6,7 A previous study using the SII-based NOSS map demonstrated the feasibility of assessing mobility of inter-muscular myofascial interfaces in the quadriceps.8 However, clear visualization of the TLF and inter-muscular fascia in the lower back using SII poses challenges, due to the complexity of the deep fascia and trunk muscles. In this feasibility study, we introduce an advanced SII post-processing algorithm to improve myofascial interface visualization in the lower back with healthy volunteers. The investigation qualitatively examined the effects of MRE vibration frequency and a new SII biomarker, the maximal normalized displacement discontinuity map (Dnorm), for slip interface visualization.Methods
MRE/SII acquisition: Nine healthy volunteers were scanned on a 3T MR scanner, including anatomical scans and dual-saturation dual-sensitivity motion encoding (DSDM) SE-EPI MRE scans9, which acquire both water and fat MRE signals in the lower back. A customized belt driver was wrapped around the subjects’ L4-L5 vertebrae regions (Fig.1) to induce vibration at either 30Hz or 90Hz for assessing the effect of vibration frequency for SII.Post-processing: The Dnorm map was developed to enhance detection of displacement discontinuity (i.e. slip) across myofascial interfaces. Unlike NOSS, which uses OSS normalized by the combined x-, y-, and z-wave amplitudes, Dnorm measures displacement gradients to directly capture displacement discontinuity in the x-, y-, and z-directions. It normalizes using amplitudes from directional filtered wave components, addressing the potential wave interferences stemming from multi-directional and multi-layered structures of lower back muscles. Briefly, (1) the 3D displacement gradients are calculated as $$$∇U=(\frac{∂U}{∂x},\frac{∂U}{∂y},\frac{∂U}{∂z})$$$. (2) A 3D spatial-temporal directional filter (DF)10, originally comprising 20 directions, has been modified to merge opposing vectors into 10 bidirectional filters, each separating displacement into 10 directionally filtered wave components $$$(u_{xi},u_{yi},u_{zi}), i$$$=1 to 10. The separately combined x-, y-, and z-displacement amplitudes are given as $$$ DF_j =$$$ $$$ \sqrt{∑_{i=1}^{10} u_{ji}^2}$$$ for $$$j∈(x,y,z)$$$. (3) The magnitude of the normalized displacement gradient in the x-, y-, and z-direction is calculated as $$$D_{norm_k}=$$$$$$ \sqrt{(\frac{∂u_x}{∂k}/DF_x )^2+(\frac{∂u_y}{∂k}/DF_y )^2+(\frac{∂u_z}{∂k}/DF_z )^2}$$$ for $$$k∈(x,y,z)$$$. (4) Dnorm is defined by the maximal intensity projection (MIP) of these magnitudes: $$$MIP(D_{norm_x},D_{norm_y},D_{norm_z})$$$.
Results and Discussion
NOSS maps from 30Hz MRE depicted clearer visualization of slip interfaces (Fig.2B) than 90Hz (Fig.2C). While higher frequencies in MRE provide better resolution for stiffness estimation, they suffer from limited wave penetration, increased attenuation, and more low-amplitude wave nodes from interference. As seen in Fig.2E-F, the motion at 30Hz appears to have a higher wave amplitude and a more uniform distribution compared to 90Hz. Normalizing shear strain to wave amplitude with these low-amplitude nodes at 90 Hz amplifies noise in the NOSS map, as shown in Fig.2C. From the same 30Hz data, the Dnorm map (Fig.2D) provides a clearer and sharper contrast for the three TLF layers and other inter-muscular myofascial interfaces than the NOSS map. These findings were consistent across all volunteers. NOSS quantifies the magnitude of deformation (i.e., OSS) at the interface and normalizes to the unfiltered 3D displacement amplitude to account for wave amplitude variations – a process that is effective for brain tumors6 and thigh muscles8. However, in the lower back, the NOSS image is more confused, likely due to the complicated wave patterns in the densely layered lumbar muscles. The Dnorm map better visualizes the lower-back myofascial layers by focusing on the displacement gradient, a direct reflection of the slip interface, and by normalizing using amplitudes from directional filtered wave components, reducing potential wave superposition effects. The final MIP processing captures the most significant displacement discontinuity across all propagation directions.Conclusion
The study demonstrated that MRE-based SII can visualize the TLF and other inter-muscular interfaces in the lower back. A lower vibration frequency combined with a new SII biomarker, the Dnorm map, facilitates better visualization of slip interfaces compared to the standard NOSS map. This approach could potentially distinguish between healthy and adhesive TLF in MPS patients. Further clinical investigation with a larger cohort is needed to evaluate the potential applications of SII.Acknowledgements
This work was supported by grants from the NIH (R01 EB001981, R61 AT01218, and R01 NS113760).References
1. Chen CK, Nizar AJ. Myofascial pain syndrome in chronic back pain patients. Korean J Pain 2011;24(2):100-104.2. Gerber LH, Sikdar S, Armstrong K, et al. A systematic comparison between subjects with no pain and pain associated with active myofascial trigger points. Pm r 2013;5(11):931-938.
3. Langevin HM, Fox JR, Koptiuch C, et al. Reduced thoracolumbar fascia shear strain in human chronic low back pain. BMC Musculoskelet Disord 2011;12:203.
4. Yin Z, Glaser KJ, Manduca A, et al. Slip Interface Imaging Predicts Tumor-Brain Adhesion in Vestibular Schwannomas. Radiology 2015;277(2):507-517.
5. McGarry MD, Van Houten EE, Perriñez PR, et al. An octahedral shear strain-based measure of SNR for 3D MR elastography. Phys Med Biol 2011;56(13):N153-164.
6. Yin Z, Hughes JD, Trzasko JD, et al. Slip interface imaging based on MR-elastography preoperatively predicts meningioma-brain adhesion. J Magn Reson Imaging 2017;46(4):1007-1016.
7. Yin Z, Lu X, Cohen Cohen S, et al. A new method for quantification and 3D visualization of brain tumor adhesion using slip interface imaging in patients with meningiomas. Eur Radiol 2021;31(8):5554-5564.
8. Yin Z, Sui Y, Zheng K, et al. MR elastography-based slip interface imaging (SII) to assess the mobility of the myofascial interface in extremities: A feasibility study. ISMRM abstract 2023.
9. Yin Z, Sui Y, Trzasko JD, et al. In vivo characterization of 3D skull and brain motion during dynamic head vibration using magnetic resonance elastography. Magn Reson Med 2018;80(6):2573-2585.
10. Manduca A, Lake DS, Kruse SA, Ehman RL. Spatio-temporal directional filtering for improved inversion of MR elastography images. Med Image Anal 2003;7(4):465-473.
Figures
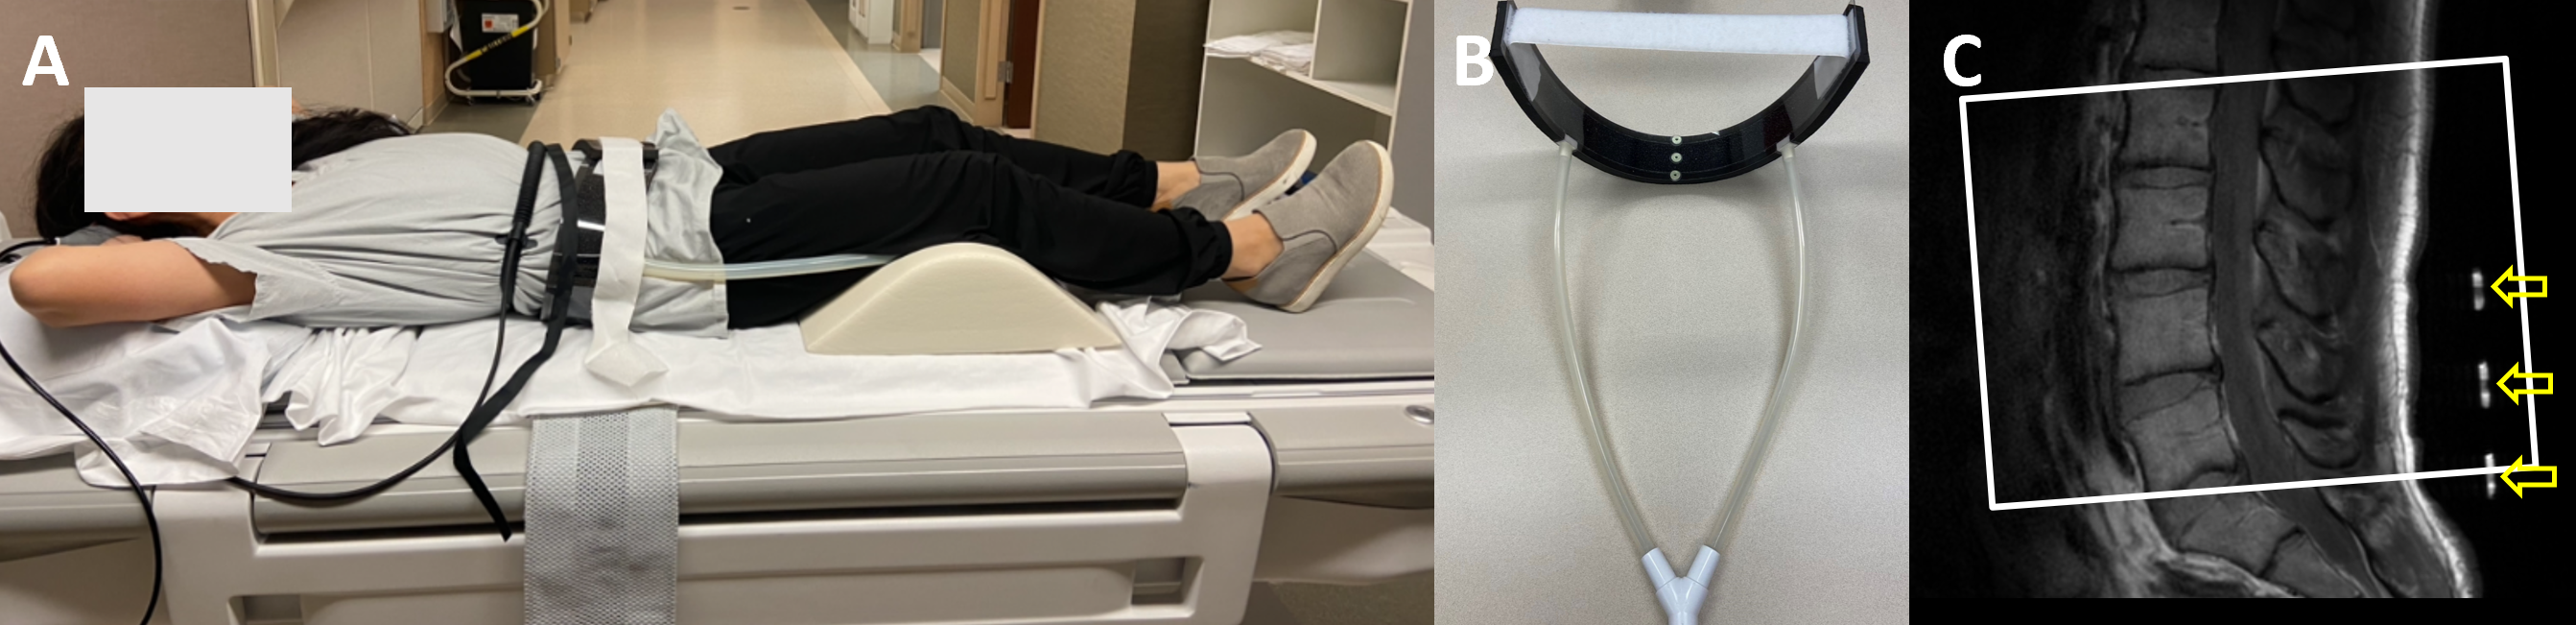
Fig.1: SII acquisition setup for the lower back. A volunteer was in the supine position (A), with a belt driver (B) wrapped around the subjects’ fourth and fifth lumbar vertebrae regions, as indicated by the yellow arrows on the sagittal section of the vertebral column in the anatomical image (C). White outlined rectangle shows slice coverage.
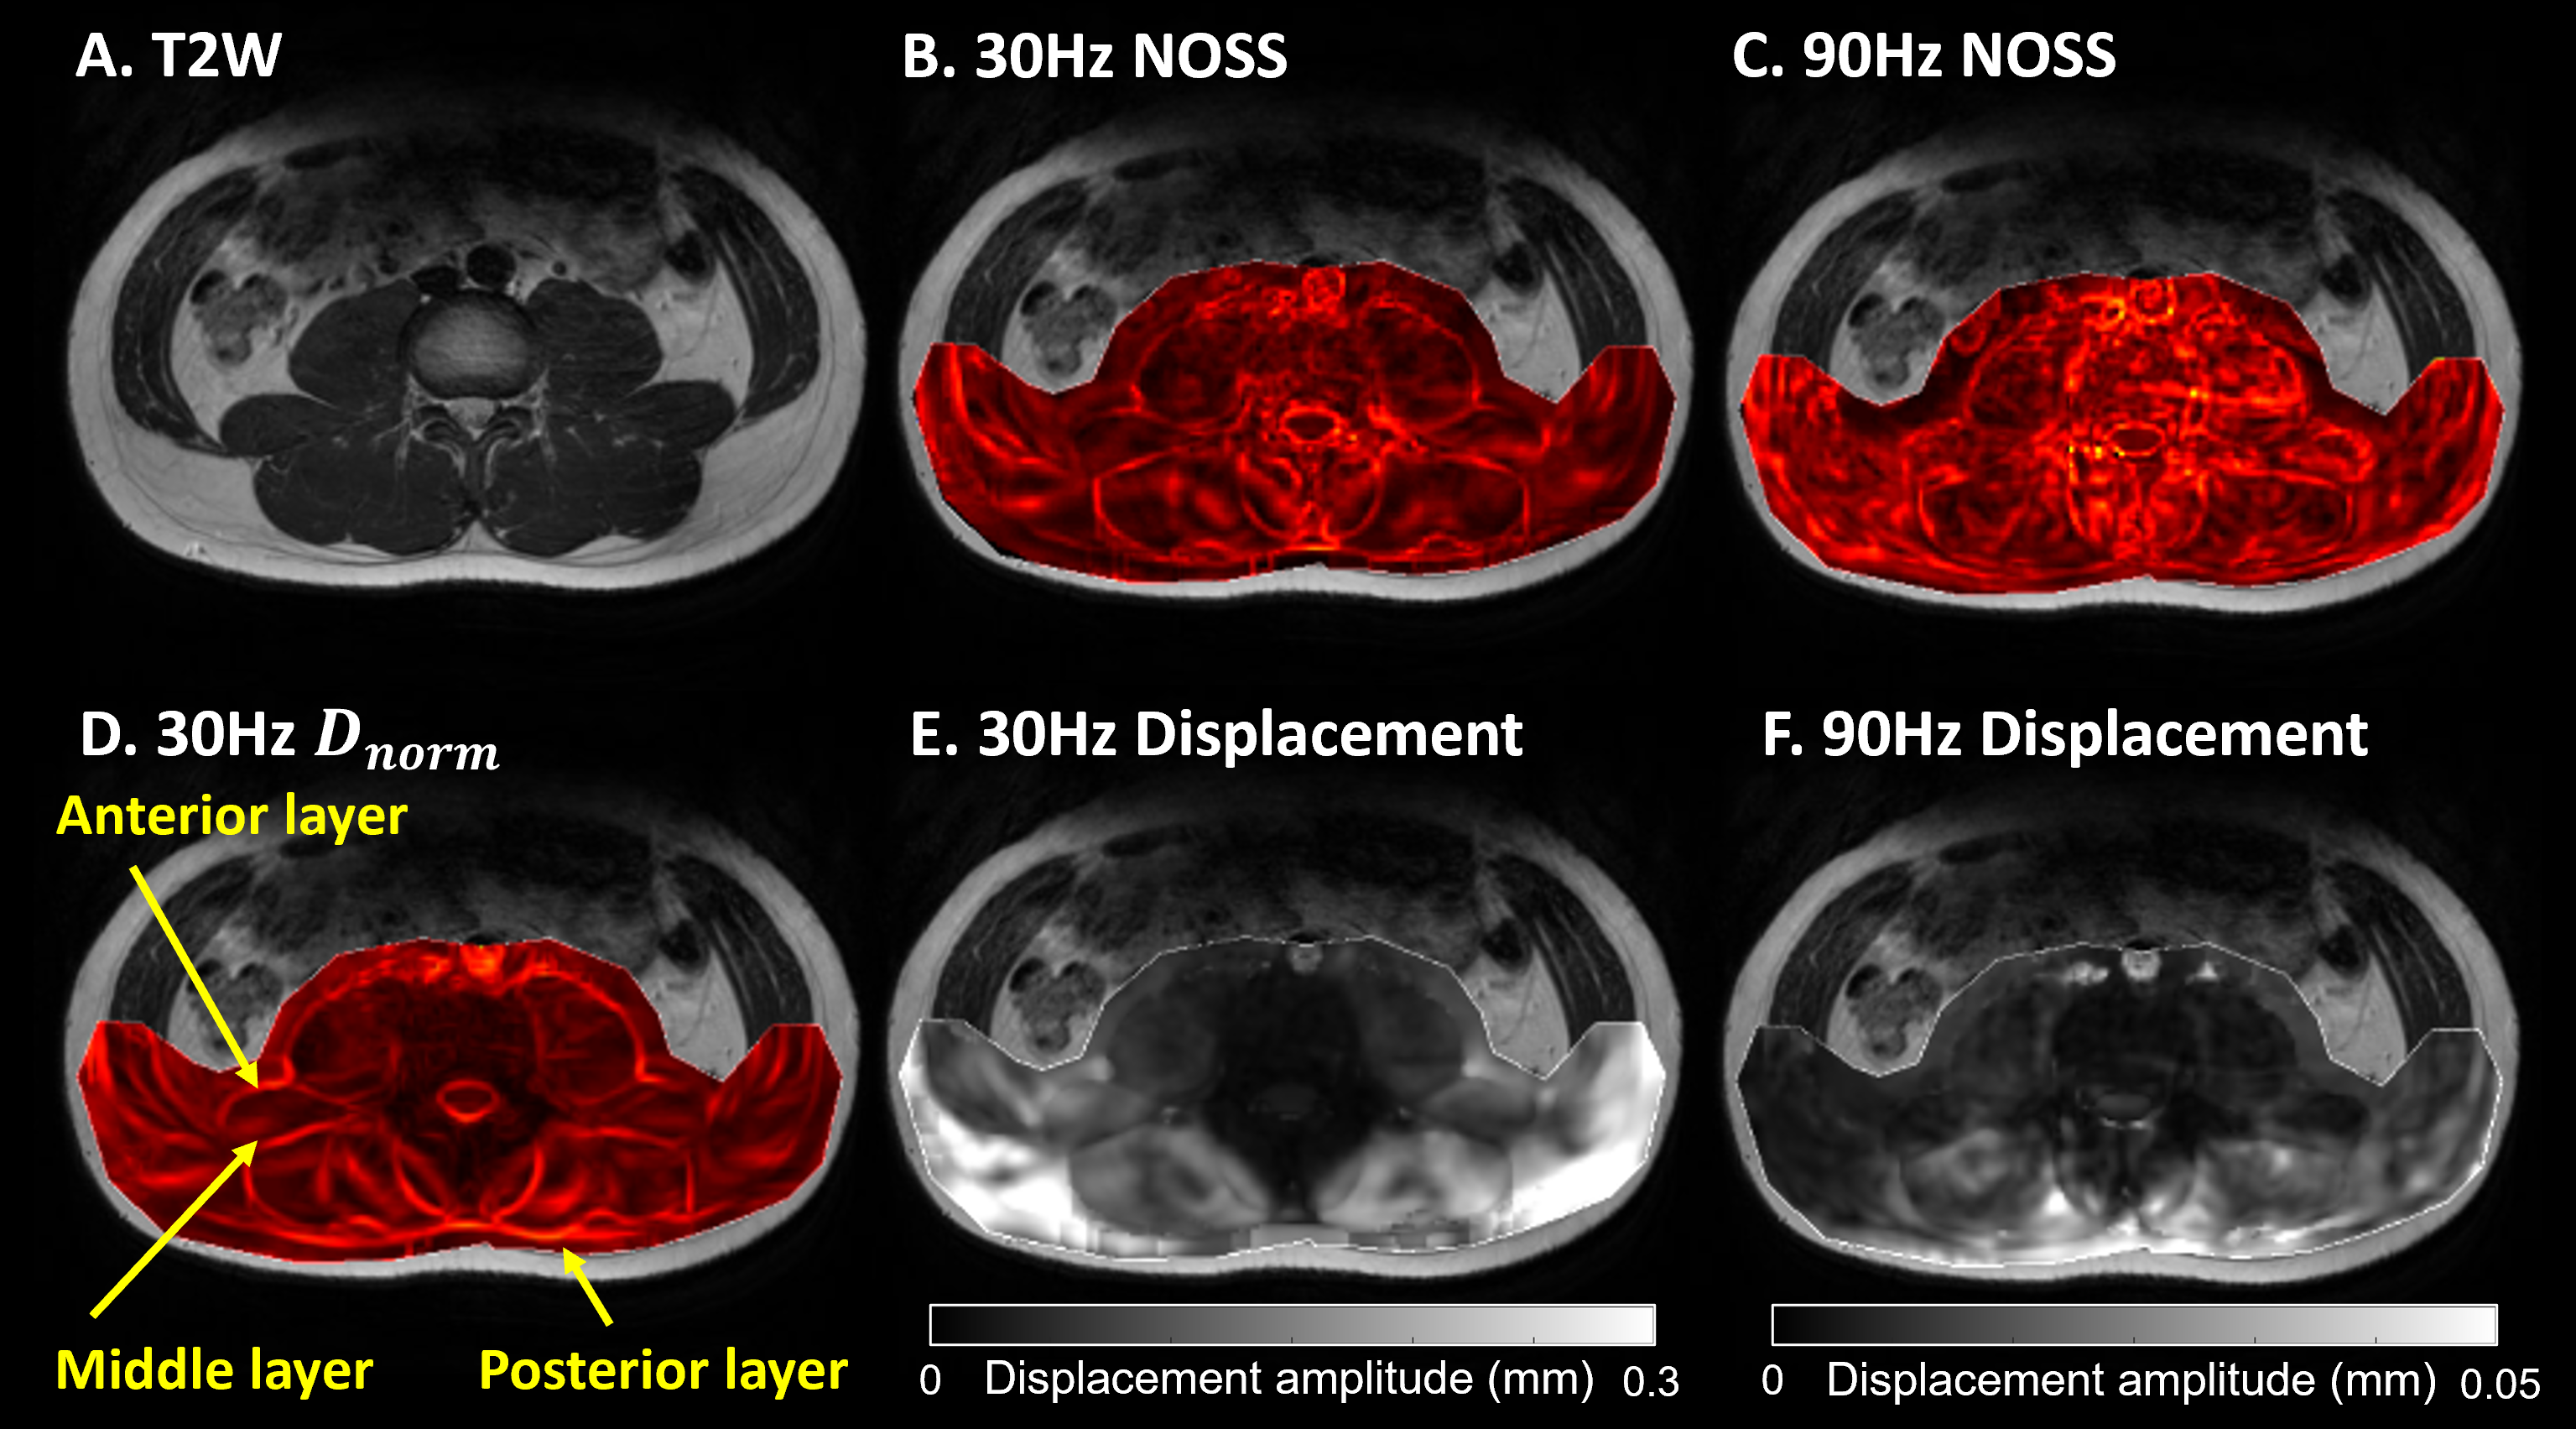
Fig.2: The T2W anatomical image (A) and corresponding NOSS maps obtained from 30Hz (B) and 90Hz (C), as well as Dnorm map from 30Hz (D). The corresponding shear wave amplitude map (a combined amplitude of the first harmonic of complex waves in x-, y-, and z-directions) is shown for 30Hz (E) and 90Hz (F); note the different displaying scales. Yellow arrows indicate the anterior, middle, and posterior layers of TLF.