1556
Unlocking the Secrets of Lumbar Disc Degeneration: Revealing Early Changes using Advanced 23Na MRI1University Hospital Duesseldorf, Duesseldorf, Germany
Synopsis
Keywords: Cartilage, Cartilage, sodium MRI, 23Na, IVD, lumar Spine, lower pack pain, ex vivo, quantitative imaging
Motivation: The global impact of lumbar back pain requires an understanding of degenerative disc disease. Conventional MRI often misses early changes, necessitating a more sensitive technique for accurate detection.
Goal(s): To determine the efficacy of 3T-MRI with 23Na in accurately assessing degeneration to provide a deeper understanding of the correlation between sodium concentrations and proteoglycan levels in intervertebral discs.
Approach: Examination of human lumbar spine samples ex vivo using a 23Na-surface-coil, which enabled accurate determination of 23Na relaxation times and quantification of tissue sodium concentrations (TSCs).
Results: Results showed a significant correlation between decreasing TSC values and progression of Thompson grading.
Impact: This exciting research represents a significant advance in the field of lumbar disc degeneration assessment and promises to be an important part of a paradigm shift in diagnostic approaches and treatment strategies for patients with lumbar back pain.
Introduction
Lumbar back pain (LBP) is a prevalent global health issue primarily attributed to degenerative disc disease (DDD) in the intervertebral disc (IVD). However, conventional MRI often overlooks critical early biochemical changes, hindering timely intervention and accurate prognosis (1, 2, 3). Advanced 23Na MRI, despite challenges such as low sensitivity and the need for specialized coils, allows for the detection of early tissue sodium concentration (TSC) alterations, signaling proteoglycan (PG) loss, a key event in degeneration (4, 5, 6, 7, 8, 9). Our ex vivo study overcomes these obstacles by examining human lumbar spine samples, facilitating precise 23Na surface coil positioning and accurate TSC quantification. This approach yields insights into the relationship between TSCs and IVD degradation, shedding light on early degenerative processes for enhanced diagnostic and therapeutic strategies.Methods
MRI utilized a 3 T scanner with a dual-tuned 23Na/1H coil for optimal sensitivity. Three reference phantoms aided in accurate tissue sodium concentration (TSC) determination, while a sensitivity correction accounted for coil variability. Specific protocols determined the IVDs' 23Na relaxation times and TSCs. ITK-SNAP software defined ROIs, MATLAB processed data, and SPSS analyzed correlations. Agarose phantoms facilitated TSC calculations with relaxation time corrections. Thompson scoring assessed IVD degeneration.Results
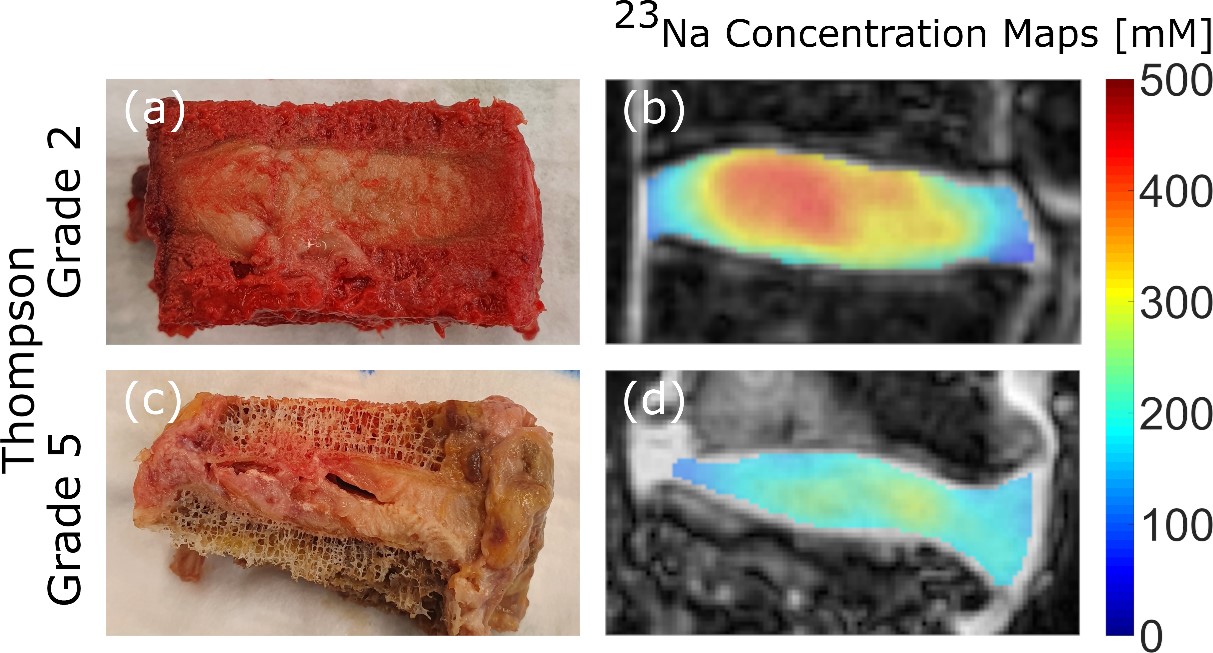
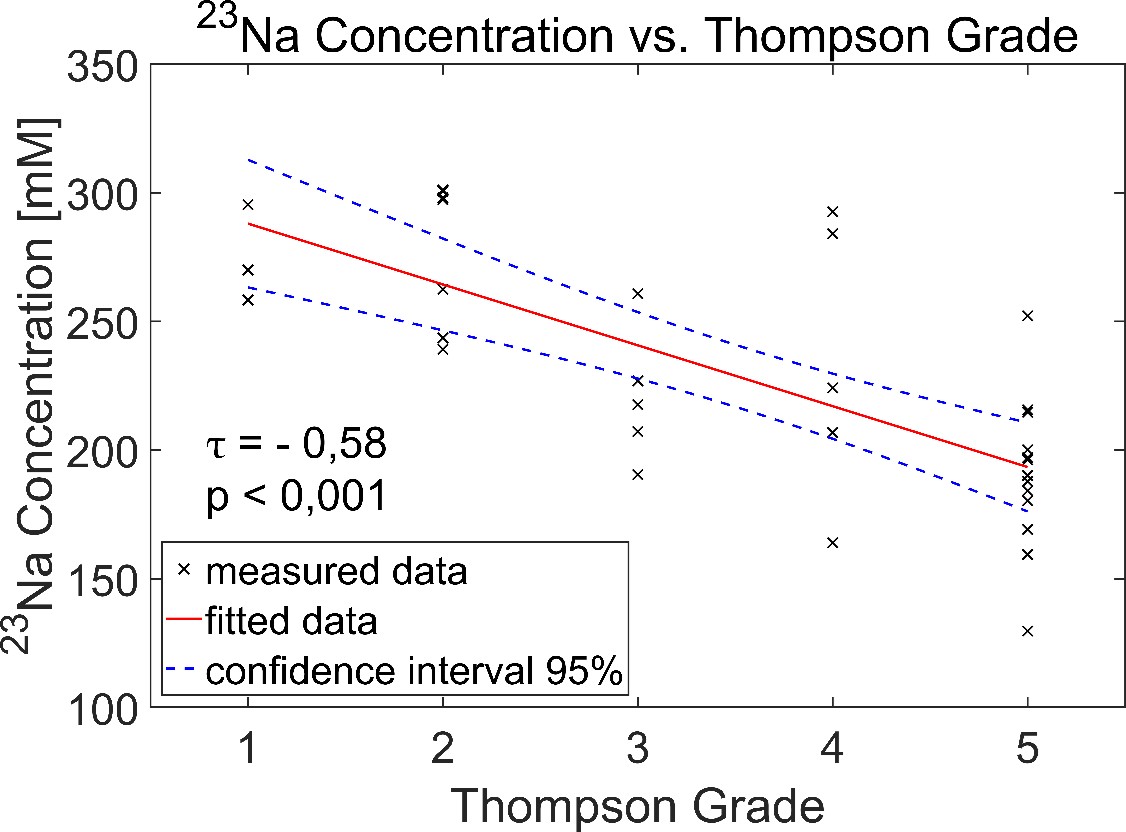
The 23Na relaxation times were successfully determined for all measured IVDs. The mean values for the T1 fit were 23Na T1 = 9.8 ± 1.3 ms and R2 = 0.981 ± 0.018 and for the T2* fit the mean values 23Na T2s* = 0.7 ± 0.1 ms, 23Na T2l* = 7.3 ± 1.1 ms, ps = 32.7 ± 4.0 % and R2 = 0.999 ± 0.001 were calculated. Figure 1 shows the adjustments of the relaxation protocol data of an exemplary IVD. The TSC values of the IVDs decreased with increasing Thompson grade, the only exception being the transition from Thompson grade 3 to 4. The mean TSC values were found to be 274.6 ± 18.9 mM for Thompson grade 1, 261.5 ± 28.2 mM for Thompson grade 2, 220.6 ± 26.2 mM for Thompson grade 3, 234.3 ± 54.0 for Thompson grade 4 and 190.5 ± 29.5 mM for Thompson grade 5. Figure 2 shows example images of Thompson grading and overlays of TSC maps on 1H images. The Kendall tau correlation test revealed a significant (p < 0.001) and strongly negative (τ = - 0.58) correlation. A scatter plot with the corresponding linear regression of the data is shown in Figure 3.Discussion
Publications dealing with 23Na relaxation times of intervertebral discs are rare. Wang et al. carried out measurements on bovine intervertebral discs and determined 23Na-T1 of 22 ms and 23Na-T∗2 of 16 ms (10, 11). These values differ from the results of the present study, possibly due to differences between animal species and measurement conditions. Çavuşoğlu et al. performed an in vivo study and determined 23Na concentrations between 254.6 ± 54mM and 290.1 ± 39mM in healthy intervertebral discs (10, 11). The results are consistent with the 23Na concentrations of the less damaged (Thompson grade 1-2) discs in the present study, while the more severely damaged discs (Thompson grade 3-5) showed lower concentrations. In their ex vivo study, Wang et al. correlated the 23Na concentrations with the histologically determined PG content and found a significant positive correlation. This underlines the suitability of 23Na imaging for assessing the health status of intervertebral discs and links the MRI-determined 23Na concentration to a standardised histological grading scale.Conclusion
This study significantly contributes to enabling future sodium imaging in humans and to more accurately assessing the degree of disc degeneration. By correlating 23Na concentrations with histologically determined PG levels, sodium imaging is established as a promising approach for evaluating disc conditions. The findings support the future application of 23Na MRI in diagnosing disc pathologies and suggest that this technique can contribute to improved classification of degeneration levels in clinical settings.Acknowledgements
No acknowledgement found.References
1. Fatoye, F.; Gebrye, T.; Odeyemi, I. Real-World Incidence and Prevalence of Low Back Pain Using Routinely Collected Data. Rheumatol. Int. 2019, 39 (4), 619–626. https://doi.org/10.1007/s00296-019-04273-0.
2. Hoy, D.; March, L.; Brooks, P.; Woolf, A.; Blyth, F.; Vos, T.; Buchbinder, R. Measuring the Global Burden of Low Back Pain. Best Pract. Res. Clin. Rheumatol. 2010, 24 (2), 155–165. https://doi.org/10.1016/j.berh.2009.11.002.
3. Suthar, P. MRI Evaluation of Lumbar Disc Degenerative Disease. J. Clin. DIAGNOSTIC Res. 2015, 9 (4), TC04–TC09. https://doi.org/10.7860/JCDR/2015/11927.5761. 4. Noebauer-Huhmann, I.-M.; Juras, V.; Pfirrmann, C.W.A.; Szomolanyi, P.; Zbyn, S.; Messner, A.; Wimmer, J.; Weber, M.; Friedrich, K.M.; Stelzeneder, D.; et al. Sodium MR Imaging of the Lumbar Intervertebral Disk at 7 T: Correlation with T2 Mapping and Modified Pfirrmann Score at 3 T—Preliminary Results. Radiology 2012, 265 (2), 555–564. https://doi.org/10.1148/radiol.12111920.
5. Insko, E.K.; Clayton, D.B.; Elliott, M.A. In Vivo Sodium MR Imaging of the Intervertebral Disk at 4 T. Acad. Radiol. 2002, 9 (7), 800–804. https://doi.org/10.1016/S1076-6332(03)80350-1.
6. Gast, L. V.; Platt, T.; Nagel, A.M.; Gerhalter, T. Recent Technical Developments and Clinical Research Applications of Sodium (23Na) MRI. Prog. Nucl. Magn. Reson. Spectrosc. 2023, 138–139, 1–51. https://doi.org/10.1016/j.pnmrs.2023.04.002.
7. Cunningham, C.H.; Pauly, J.M.; Nayak, K.S. Saturated Double-Angle Method for RapidB1+ Mapping. Magn. Reson. Med. 2006, 55 (6), 1326–1333. https://doi.org/10.1002/mrm.20896.
8. Nagel, A.M.; Laun, F.B.; Weber, M.A.; Matthies, C.; Semmler, W.; Schad, L.R. Sodium MRI Using a Density-Adapted 3D Radial Acquisition Technique. Magn. Reson. Med. 2009, 62 (6), 1565–1573. https://doi.org/10.1002/mrm.22157.
9. Kamp, B.; Frenken, M.; Henke, J.M.; Abrar, D.B.; Nagel, A.M.; Gast, L. V.; Oeltzschner, G.; Wilms, L.M.; Nebelung, S.; Antoch, G.; et al. Quantification of Sodium Relaxation Times and Concentrations as Surrogates of Proteoglycan Content of Patellar CARTILAGE at 3T MRI. Diagnostics 2021, 11 (12), 2301. https://doi.org/10.3390/diagnostics11122301.
10. Wang, C.; McArdle, E.; Fenty, M.; Witschey, W.; Elliott, M.; Sochor, M.; Reddy, R.; Borthakur, A. Validation of Sodium Magnetic Resonance Imaging of Intervertebral Disc. Spine (Phila. Pa. 1976). 2010, 35 (5), 505–510. https://doi.org/10.1097/BRS.0b013e3181b32d3b.
11. Wang, C.; Witschey, W.; Elliott, M.A.; Borthakur, A.; Reddy, R. Measurement of Intervertebral Disc Pressure with T1ρ MRI. Magn. Reson. Med. 2010, 64 (6), 1721–1727. https://doi.org/10.1002/mrm.22560.
Figures
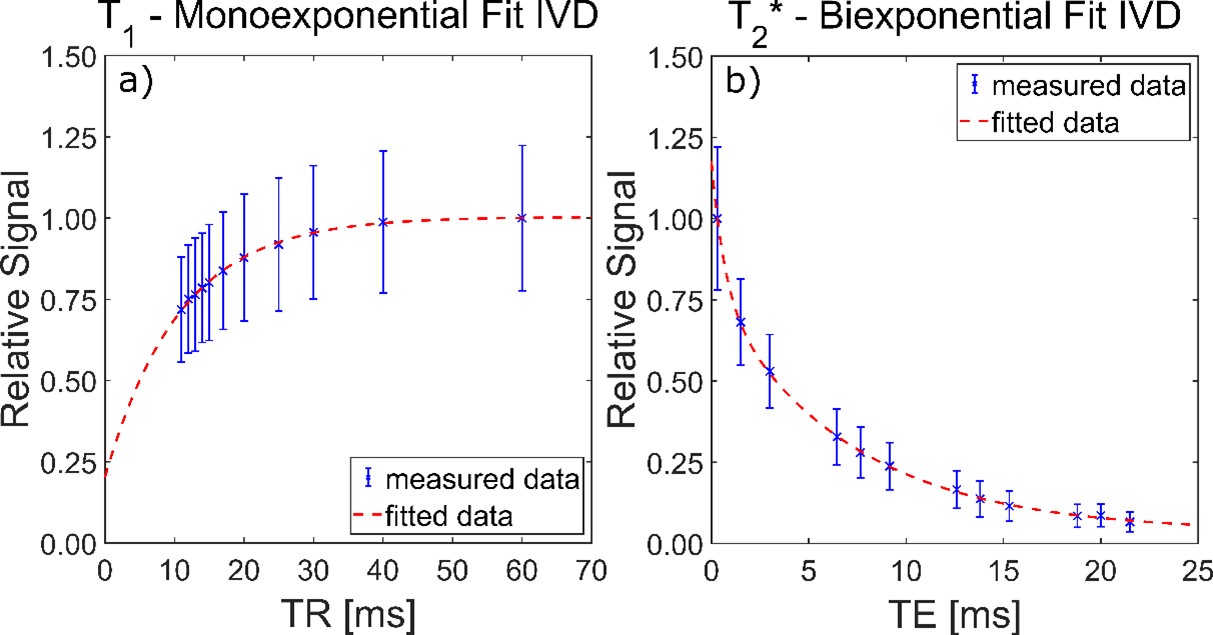
Figure 1. Exemplary fits of the 23Na relaxation time data of an intervertebral disc with a Thompson grade of 2. a) For the determination of T1, a monoexponential fit was performed, resulting in 23Na T1 = 10.7 ms and R2 = 0.998. b) The data for T2* was fitted biexponentially due to the properties of the 23Na nucleus, resulting in the values 23Na T2s* = 0.7 ms, 23Na T2l* = 7.0 ms, ps = 35.2 % and R2 = 0.999.