1553
Prediction of vertebral fracture risk in patients with osteopenia based on MRI texture analysis1Department of Medical Imaging, The Third Affiliated Hospital of Southern Medical University (Academy of Orthopedics· Guangdong Province), Guangzhou, China, 2School of Biomedical Engineering, Southern Medical University, Guangzhou, China, 3Philips Healthcare, Guangzhou, China
Synopsis
Keywords: Bone, Data Analysis
Motivation: Fractures can be highly detrimental for the elderly population. Assessing bone density alone is insufficient in accurately predicting fracture risk in osteopenia patients with and without fragility fracture. MRI can provide additional information on vertebral strength.
Goal(s): To develop and validate a three-dimensional texture analysis method based on MRI for quantifying grayscale and distribution information of vertebrae.
Approach: We extracted MR texture features of the L4 vertebra and selected the most relevant features. A logistic regression model was established for fracture risk prediction.
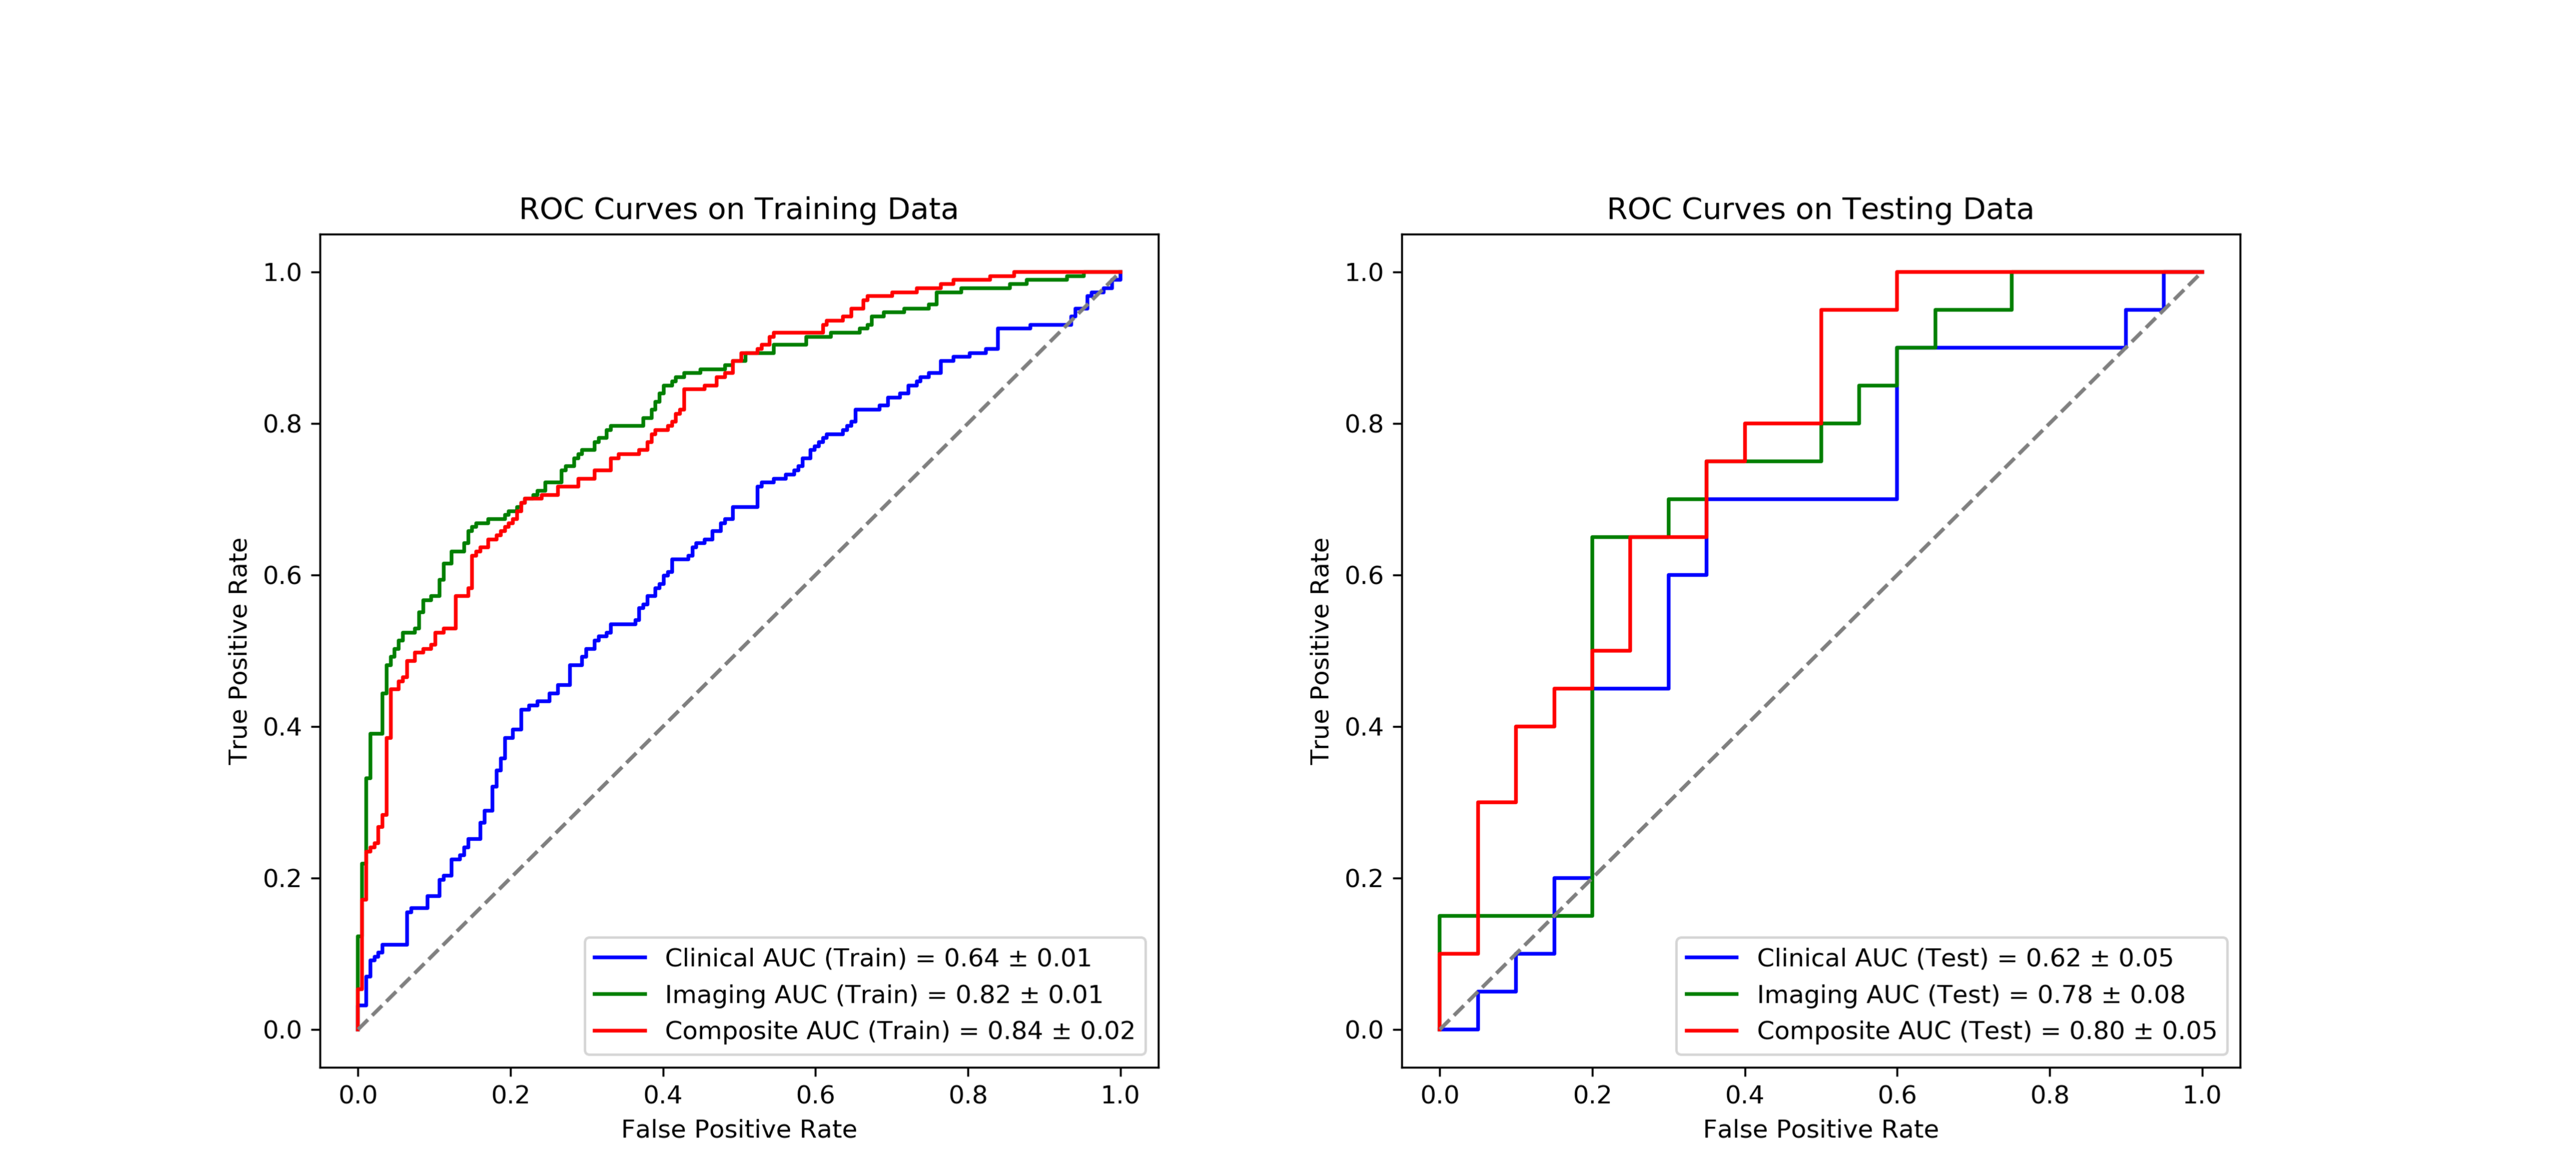
Results: In a comprehensive model, the training and testing set achieved an AUC of 0.84 and 0.80 respectively.
Impact: Detecting subtle texture information that is imperceptible to the naked eye during the osteopenia stage. Analyzing these texture features specifically can help slow down the process of bone loss.
Introduction
Osteoporotic fracture, commonly referred to as fragility fracture, is considered as the most severe complications of osteoporosis[1]. In clinical practice, it has been observed that fragility fracture may occur in osteopenia patients, while not all individuals diagnosed with osteoporosis experience fragility fracture. This suggests that factors beyond bone density, such as the bone microenvironment, also play an important role in bone strength. We assessed the predictive value of vertebral MR texture features in estimating the risk of fragility fractures. Then a comprehensive model based on clinical data and imaging characteristics was established to enhance the predictive performance of fractures in osteopenia.Methods
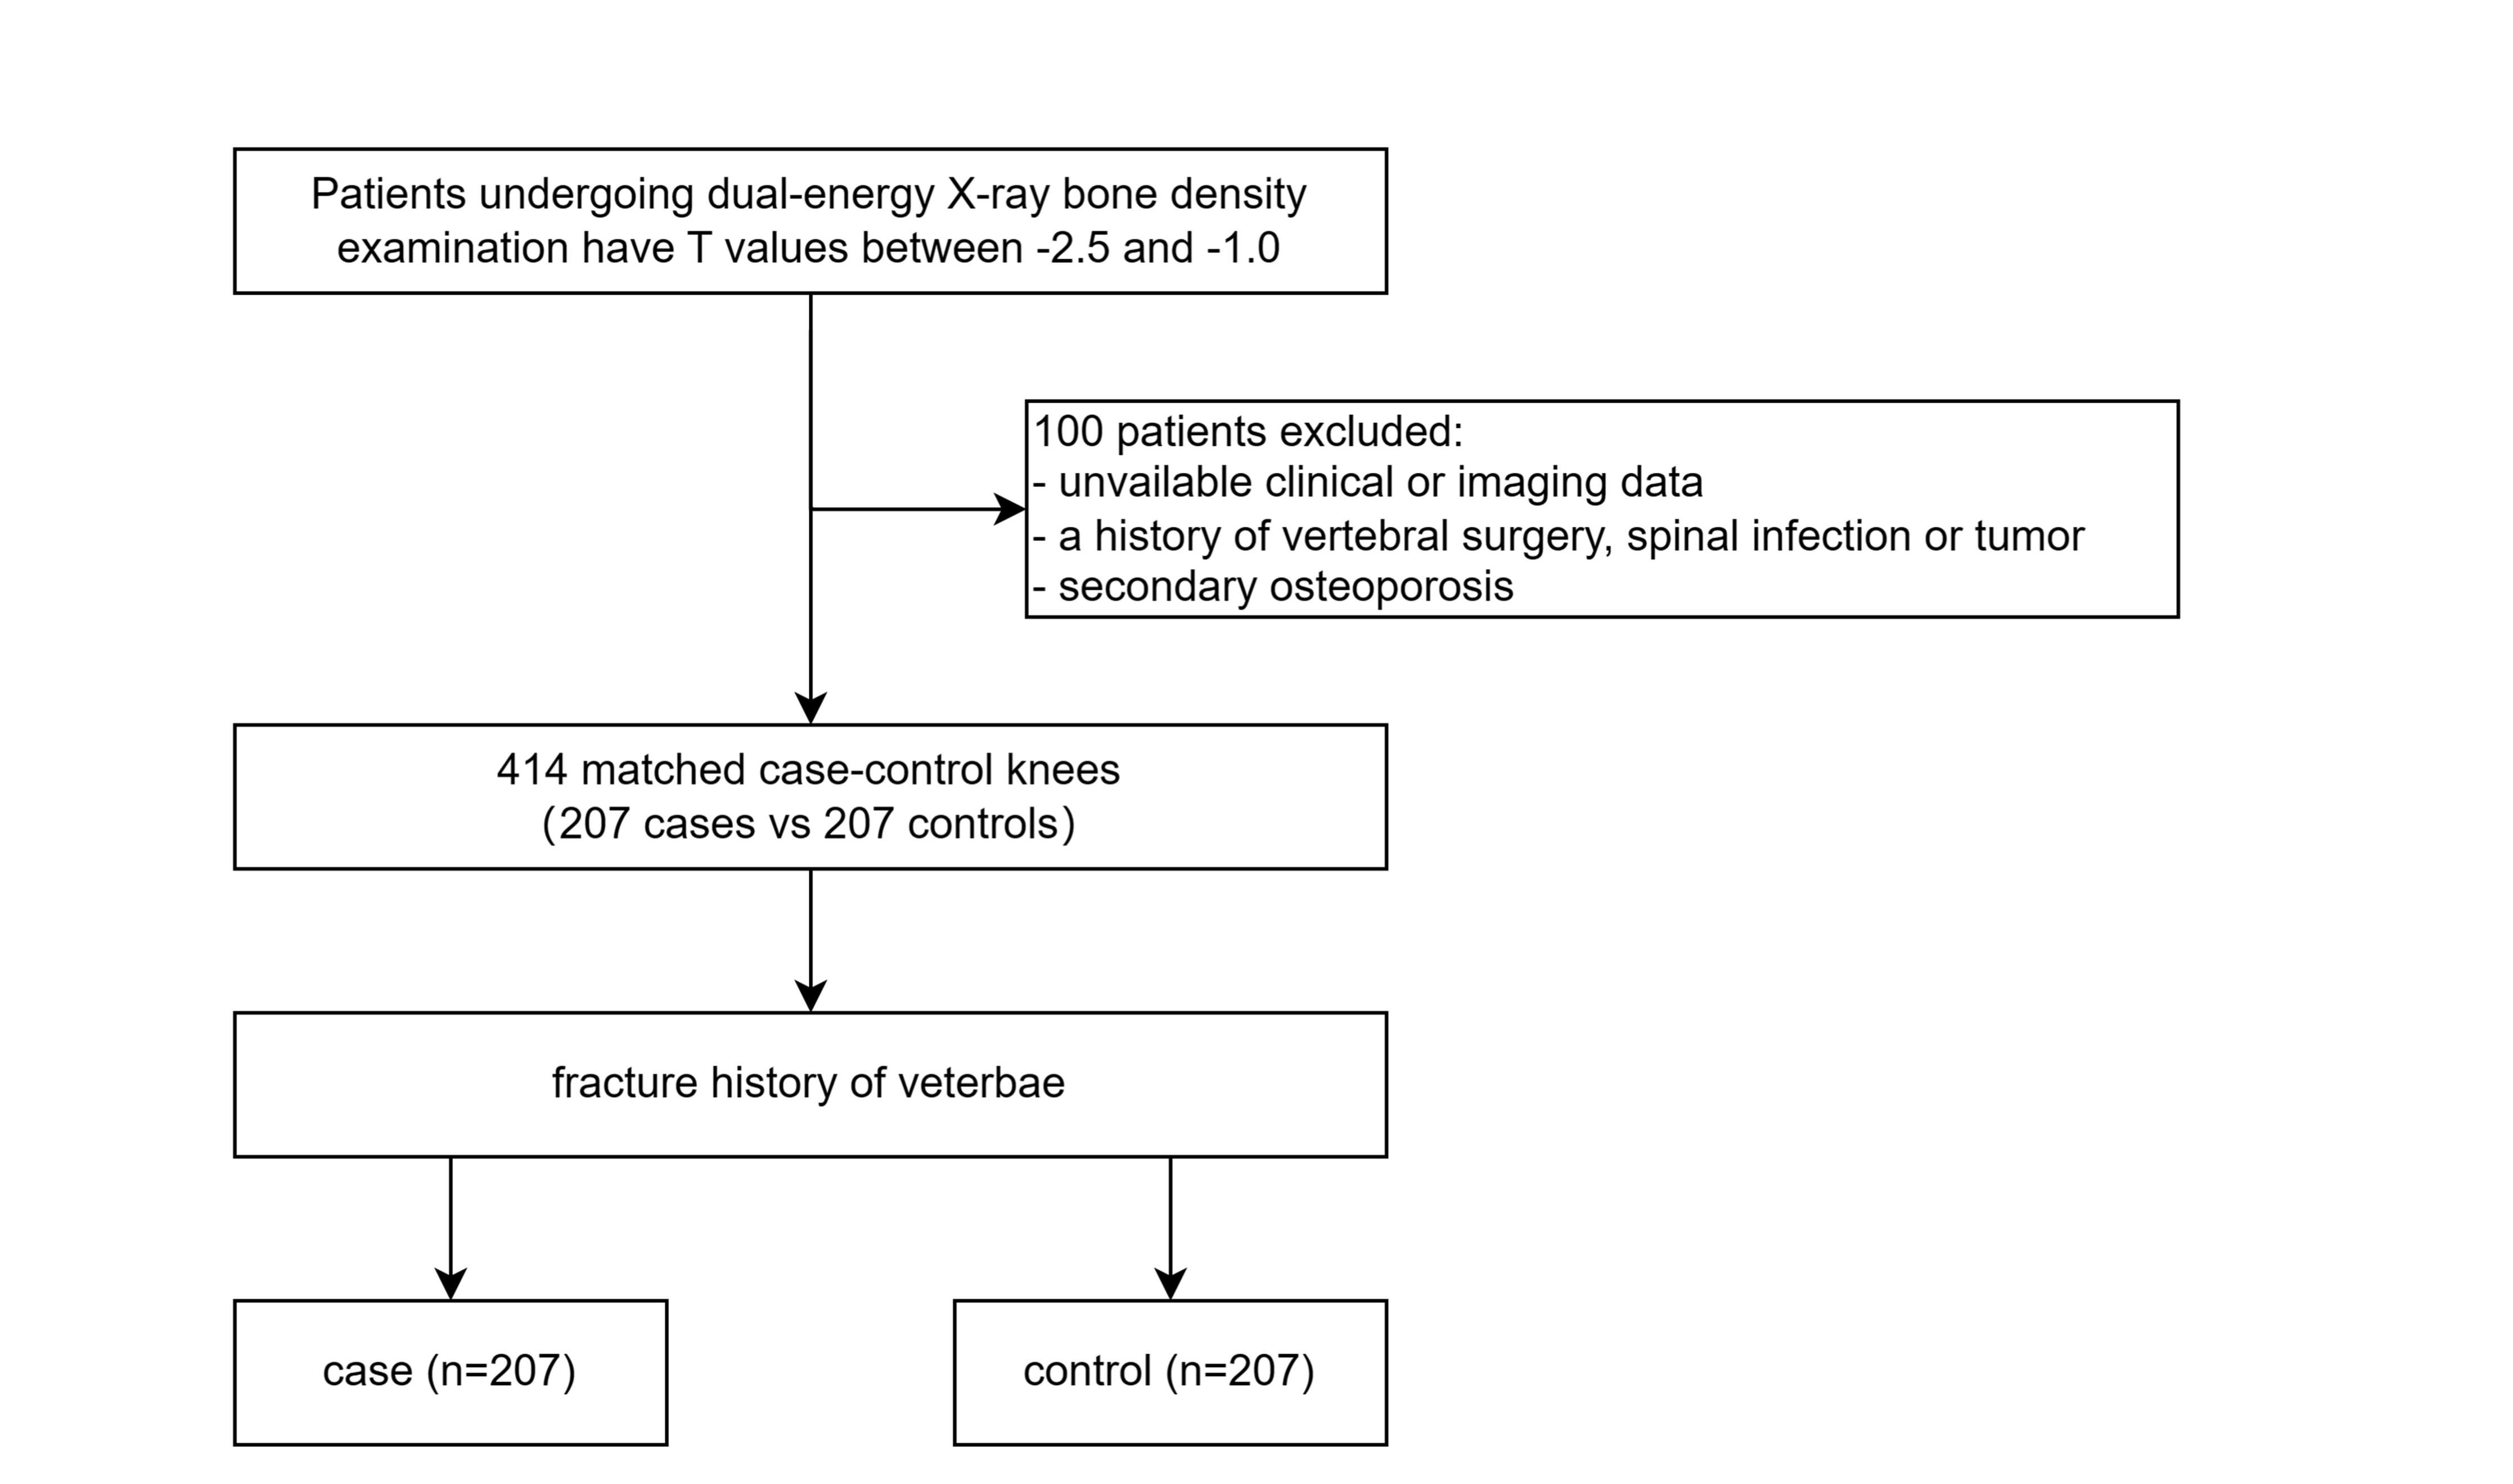
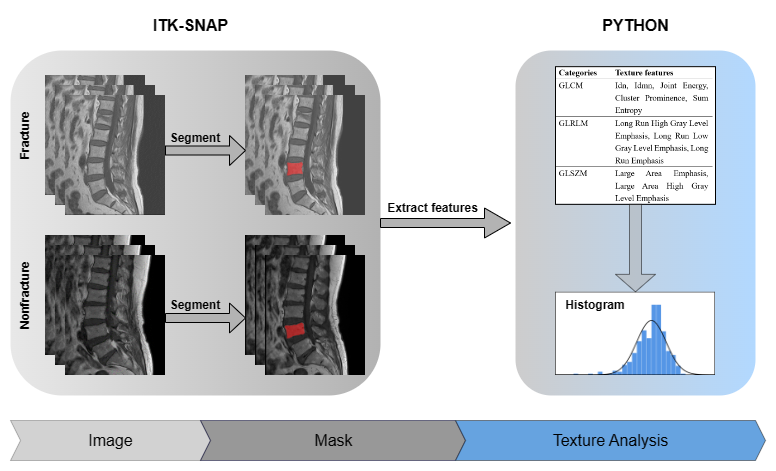
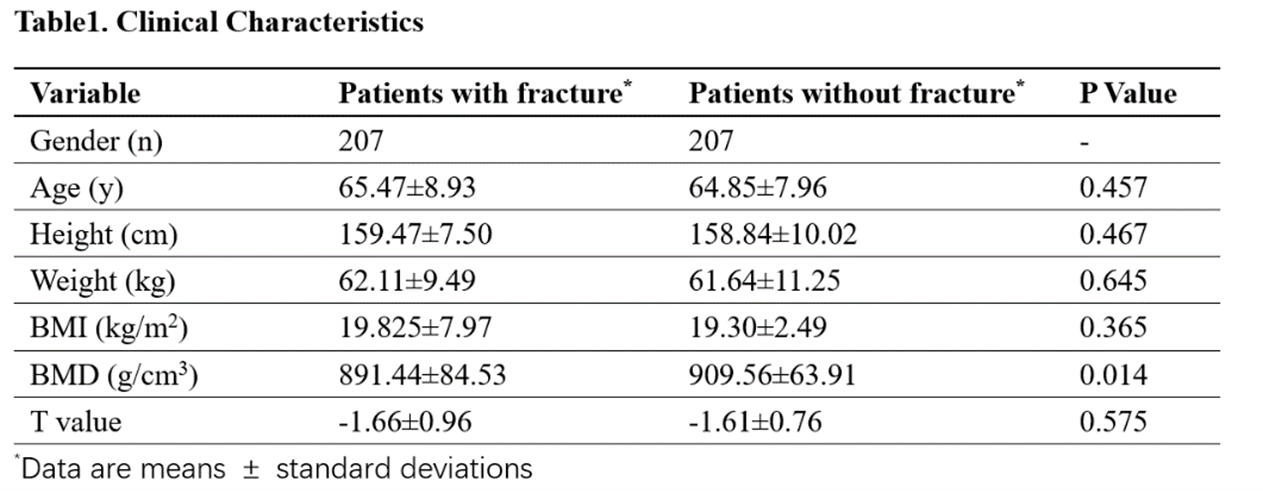
In this retrospective study, a cohort of 414 patients with reduced bone mass was included. They were stratified based on age, gender and BMI. Basic clinical characteristics are shown in Table 1. All patients underwent both Dual-energy X-ray bone densitometry and lumbar vertebral MR scans. Figure1 shows the included process and excluded criteria. Three-dimensional texture analysis based on T1-weighted-imaging was employed to extract texture features from the L4 vertebral body. Feature selection was carried out using t-test and the least absolute shrinkage and selection operator (Lasso), followed by the application of logistic regression models. To validate the model's reliability, stratified K-Fold cross-validation with 10 folds was employed. Mean area under the receiver operating characteristic curve (AUC) and standard deviation were used to evaluate the discriminative value of the clinical score, L4 texture score, and comprehensive score for fragility fractures.Results
L4 texture scores (AUC=0.64 in training cohort/0.62 in testing cohort) showed greater discrimination than clinical scores (AUC=0.82 in training cohort/0.78 in testing cohort). In terms of comprehensive performance, we obtained an AUC of 0.84 for the training set and an AUC of 0.80 for the testing set. In osteopenia patients with fractures, the entropy value of their texture features is higher compared with the nonfractured patients.Discussion
With the utilization of image information promoted, our prediction ability on the risk of osteopenia fractures has improved. Texture analysis studies have already been demonstrated the predictive efficacy in CT[2, 3] and MRI[4-6] for osteoporotic fractures. In osteopenia patients, our study substantiates the significance of vertebral texture features in relation to fracture occurrence. Our results indicate that, in both training and validation datasets, texture scores of the L4 vertebra possess higher predictive value compared to bone density. The higher value of entropy in fracture patients also indicates more heterogeneity and complexity in their texture.Conclusion
In conclusion, our study demonstrates the effectiveness of vertebral texture analysis in predicting fractures in osteopenia patients. Quantitative texture features can detect early vertebral changes, providing sensitive indicators for interventions.Acknowledgements
Corresponding author: Xiaodong Zhang.
The study was supported by Present's Fund of the Third Affiliated Hospital of Southern Medical University(grant No. YM2021012).
References
[1] NUTI R, BRANDI M L, CHECCHIA G, et al. Guidelines for the management of osteoporosis and fragility fractures [J]. Internal and Emergency Medicine, 2019, 14(1): 85-102.
[2] VALENTINITSCH A, TREBESCHI S, KAESMACHER J, et al. Opportunistic osteoporosis screening in multi-detector CT images via local classification of textures [J]. Osteoporosis International, 2019, 30(6): 1275-85.
[3] MUEHLEMATTER U J, MANNIL M, BECKER A S, et al. Vertebral body insufficiency fractures: detection of vertebrae at risk on standard CT images using texture analysis and machine learning [J]. European Radiology, 2018, 29(5): 2207-17.
[4] MACIEL J G, SALMON C E G, HOSSEINI B S, et al. Features of lumbar spine texture extracted from routine MRI correlate with bone mineral density and can potentially differentiate patients with and without fragility fractures in the spine [J]. Braz J Med Biol Res, 2023, 56: e12454.
[5] BURIAN E, SUBBURAJ K, MOOKIAH M R K, et al. Texture analysis of vertebral bone marrow using chemical shift encoding–based water-fat MRI: a feasibility study [J]. Osteoporosis International, 2019, 30(6): 1265-74.
[6] POULLAIN F, CHAMPSAUR P, PAULY V, et al. Vertebral trabecular bone texture analysis in opportunistic MRI and CT scan can distinguish patients with and without osteoporotic vertebral fracture: A preliminary study [J]. European Journal of Radiology, 2023, 158.
Figures