1548
Correlating Diffusion Tensor Imaging Parameters with Lumbar Paraspinal Muscle Fat Infiltration: Implications for Sarcopenia Diagnosis1Department of Radiology, Beijing Jishuitan Hospital, Capital Medical University, Beijing, China, 2Department of Radiology, Peking University Fourth School of Clinical Medicine, Beijing, China, 3MR Research Collaboration, Siemens Healthineers, Beijing, China
Synopsis
Keywords: Muscle, Diffusion Tensor Imaging, paraspinal muscle, muscle fat infiltration, proton density fat fraction
Motivation: With the rise of aging-related muscle diseases, particularly sarcopenia, there's a pressing need for advanced diagnostic methods to assess muscle health.
Goal(s): Investigate the relationship between DTI imaging parameters and fat infiltration in paraspinal muscle, to identify novel biomarkers for early detection of muscle degeneration.
Approach: Employing DTI on 16 volunteers, we measured fat infiltration using PDFF and conducted a correlational analysis between DTI metrics and fat content across 64 ROIs.
Results: DTI successfully visualized paraspinal muscle fibers and showed significant correlations between FA values and PDFF, MD, AD, and RD values.
Impact: The research underscores the potential of DTI in detecting imaging biomarkers for muscle degeneration, setting the stage for advanced non-invasive assessments of musculoskeletal health.
Introduction
With the acceleration of the aging process, muscle degenerative diseases are increasingly drawing attention, particularly in relation to the symptoms and signs of paraspinal muscle sarcopenia. While diffusion tensor imaging (DTI) has found widespread application in the study of various tissues [1], its utilization in the context of paraspinal muscle disorders remains limited, and its potential has yet to been fully elucidated [2-5]. Given that muscle fat infiltration is a significant manifestation of aging, degeneration, and sarcopenia, the quantitative assessment of this infiltration is crucial for early diagnosis and treatment [2]. This study aims to investigate the correlation between DTI quantitative parameters and the extent of fat infiltration in paraspinal muscles, as measured by the Dixon proton density fat fraction (PDFF). The goal is to identify DTI imaging biomarkers that accurately depict paraspinal muscle degeneration and atrophy, providing a fresh perspective for the diagnosis and evaluation of sarcopenia.Methods
This study enrolled 16 community volunteers (5 males and 11 females) with an average age of 45.2±13.4 years and a body mass index (BMI) of 24.2 ± 3.5 kg/m2, all of whom reported varying degrees of chronic lumbar discomfort. Participants underwent magnetic resonance imaging (MRI) examinations, which included T1-vibe, Q-dixon, and DTI sequences. The MR scans were conducted using a 3T MR system (MAGNETOM Vida, Siemens Healthineers AG, Erlangen, Germany). To analyze the data, at the L5/S1 and L4/5 levels, precise delineation and measurement of ROIs were carried out on both side of the paravertebral muscles for each subject, totaling 64 ROIs. The steps to determine the ROIs in detail were as follows: Firstly, DWI was registered to T1-weighted images to ensure precise anatomical matching. Following this, for accurate ROI delineation at the L5/S1 and L4/5 levels, the central intervertebral discs were identified as anatomical landmarks on T1-weighted MRI. Subsequently, the paravertebral muscles on each side, including the erector spinae and multifidus, were individually outlined, with the intermuscular fascia included to maintain the integrity of the muscle groups in the analysis. The DTI imaging protocol as follows: repetition time / echo time (TR/TE) = 3900/47 msec; FOV = 400 mm×400 mm; slice thickness = 5.0 mm; slices = 30; b-values = 0, 450 with 1 and 5 averages, respectively; 20 diffusion directions; 2-fold acceleration in the phase encoding direction and in combination with a 6/8 partial Fourier acquisition; bandwidth = 2350Hz/Px; acquisition time = 6 min and 55 sec. Post-processing of DTI and Q-Dixon data was conducted using FSL [6], ITK-SNAP [7], and DSI Studio software (http://dsi-studio.labsolver.org). Scatterplots and Spearman correlation coefficients were employed to assess the relationship between DTI quantitative measurements and Q-Dixon PDFF. A p-value of <0.05 was considered statistically significant.Results
This study successfully demonstrated the feasibility of employing DTI for fiber tracking within the lumbar paraspinal muscles. The three-dimensional visualization of fiber tracking (Figure 1) vividly showcased the fibrous structure of the paraspinal muscles, offering clear and notable insights. An analysis of the 64 regions of interest (ROIs) yielded histograms illustrating the distribution of PDFF, FA, MD, AD, and RD values (Figure 2). Additionally, scatterplots unveiled significant positive correlations between FA values and PDFF, MD, AD, and RD values (all with p-values <0.01), as detailed in Figure 3.Discussion
This study established a correlation between DTI parameters, encompassing FA, MD, AD, and RD values, and the extent of fat infiltration in lumbar paraspinal muscles. This correlation sheds new perspective on the microstructural alterations within muscle tissue and contributes to a deeper understanding of the underlying pathological mechanisms associated with muscle degenerative diseases. Furthermore, these findings lay the groundwork for a potential imaging foundation for the early diagnosis and intervention of sarcopenia.Conclusion
This study demonstrates that DTI quantitative parameters are associated with the extent of fat infiltration in lumbar paraspinal muscles, presenting novel tools for the imaging diagnosis of muscle degenerative diseases, such as sarcopenia. Future research should prioritize enhancing the clinical application of these parameters within a wider patient population to optimize the assessment and treatment strategies for muscle disorders.Acknowledgements
This work is supported in part by the National Key Research and Development Program of China (2021YFC2501703), Beijing Municipal Health Commission (BJRITO-RDP-2023) and Beijing Hospitals Authority Clinical Medicine Development of Special Funding Support (ZYLX202107). The authors thank Dr. Yanglei Wu (Siemens Healthineers) for her work on image reconstruction technical support.References
1. Budzik JF, Balbi V, Verclytte S, et al. Diffusion tensor imaging in musculoskeletal disorders. Radiographics. 2014;34(3):E56-E72.
2. Engelke K, Chaudry O, Gast L, et al. Magnetic resonance imaging techniques for the quantitative analysis of skeletal muscle: State of the art. J Orthop Translat. 2023;42:57-72. Published 2023 Aug 19.
3. Burakiewicz, Jedrzej et al. Improved olefinic fat suppression in skeletal muscle DTI using a magnitude-based dixon method. Magn Reson Med. 2018;79(1):152-159.
4. Klupp E, Cervantes B, Schlaeger S, et al. Paraspinal Muscle DTI Metrics Predict Muscle Strength. J Magn Reson Imaging. 2019;50(3):816-823.
5. Oh J, Jung JY, Ko YJ. Can diffusion tensor imaging and tractography represent cross-sectional area of lumbar multifidus in patients with LUMBAR spine disease?. Muscle Nerve. 2018;57(2):200-205.
6. Jenkinson M, Beckmann CF, Behrens TE, , et al. Neuroimage. 2012;62(2):782-790.
7. Yushkevich PA, Piven J, Hazlett HC, et al. User-guided 3D active contour segmentation of anatomical structures: significantly improved efficiency and reliability. Neuroimage. 2006;31(3):1116-1128.
Figures
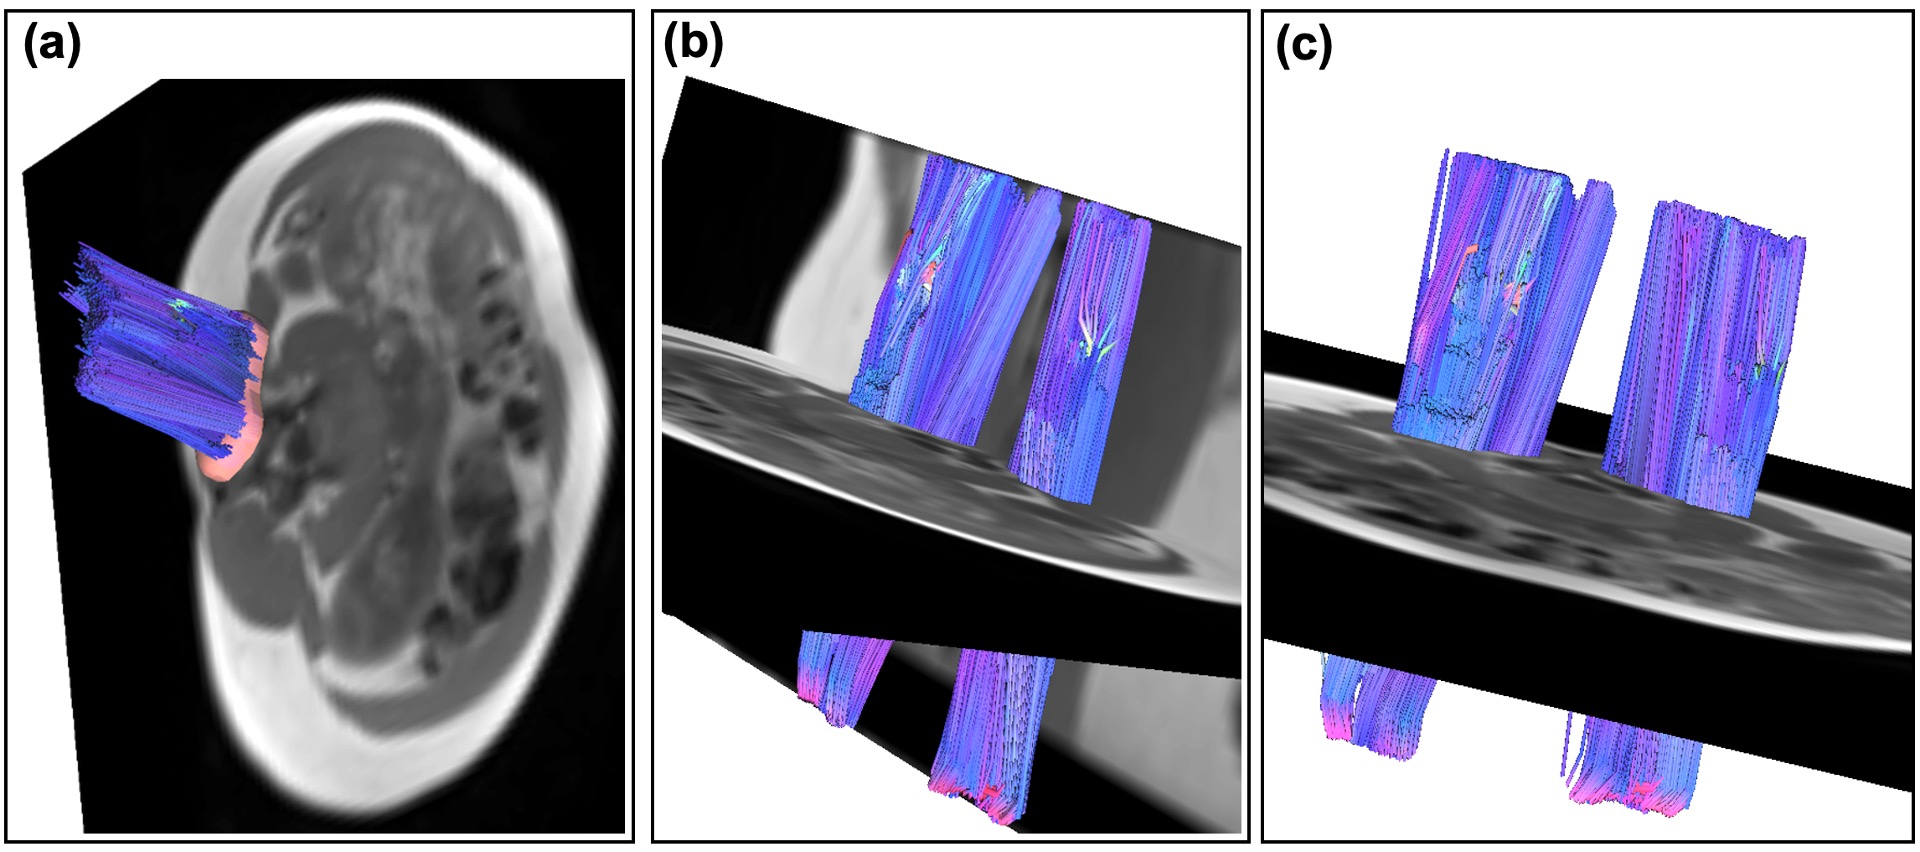
Figure 1: DTI 3D Tractography of Paraspinal Muscles. (a) Illustrates the muscle fiber tracking of one side of the paraspinal muscles, demonstrating the detailed fibrous architecture. (b) and (c) Display bilateral paraspinal muscle fiber tracking, showcasing comparative structural visualization across both sides.
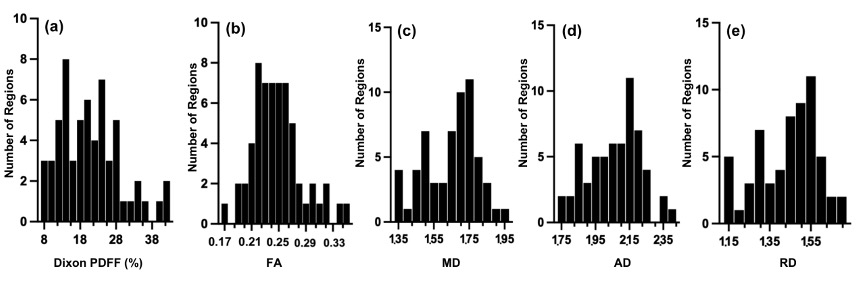
Figure 2: Histograms show measurements of (a) Q-Dixon proton density fat fraction (PDFF), (b) fractional anisotropy (FA), (c) mean diffusivity (MD), (d) axial diffusivity (AD), and (e) radial diffusivity (RD).
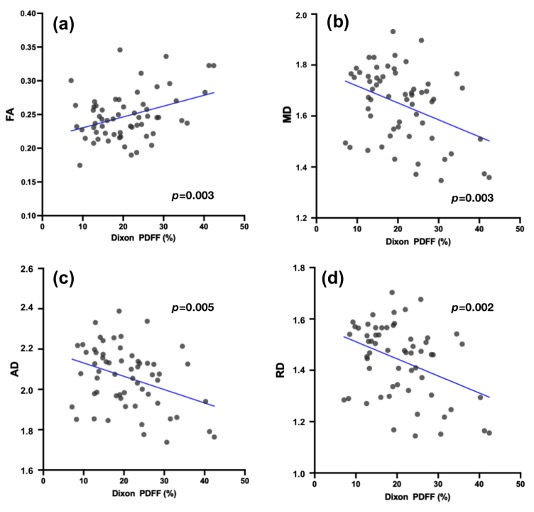
Figure 3: Scatterplots of Q-Dixon proton density fat fraction (PDFF) against (a) fractional anisotropy (FA), (b) mean diffusivity (MD), (c) axial diffusivity (AD), and (d) radial diffusivity (RD) respectively.