1547
Vertebral Bone Quality Score and Paraspinal Muscles Fat Infiltration in Chronic Low Back Pain: A Prospective Cross-Sectional Study1First Affiliated Hospital of Kunming Medical University, Kunming, China, 2GE HealthCare MR Research, Beijing, China
Synopsis
Keywords: Muscle, Muscle, Chronic low back pain; Vertebral bone quality
Motivation: The relationship between paraspinal muscles fat infiltration and vertebral body changes remain unclear. So motivation is to explore the relationship between the two and gain new insights about their interaction.
Goal(s): This study is to determine whether there is a correlation between paraspinal muscles fat infiltration and VBQ score and MCs.
Approach: A multimodal magnetic resonance imaging technique was employed to assess paraspinal muscles fat infiltration, VBQ score, and MCs in patients with CLBP
Results: There is no significant difference in paraspinal muscles PDFF between Modic classification. A positive linear relationship is observed between VBQ and total paraspinal muscles PDFF.
Impact: These findings contribute to our understanding of the association between paraspinal muscles fat infiltration and VBQ in CLBP patients. Further research can explore the clinical implications of these findings to improve alleviate CLBP symptoms.
Introduction
Modic changes(MCs) can reflect the characteristics of vertebral bone marrow and endplate1, which has gained increasing attention as a potential contributor to low back pain2. In addition to MCs, the vertebral density can also be assessed and is typically done using bone mineral density (BMD) measured by dual-energy X-ray absorptiometry (DEXA) or computed tomography (CT)3. Recently, a scoring system based on MRI, known as vertebral bone quality (VBQ), has been developed and shown to correlate with BMD measured by quantitative computed tomography (QCT)4. Additionally, patients with chronic low back pain (CLBP) often exhibit paraspinal muscles fat infiltration5. However, the relationship between paraspinal muscles and vertebral body changes remains unclear. Therefore, the aim of this study was to investigate the association between MCs, VBQ scores, and paraspinal muscles fat infiltration in CLBP patients.Methods
PatientsThe study was approved by the institutional review board, and Verbal informed consent was obtained from all participants. CLBP patients who met inclusion and exclusion criteria in the study were recruited from four healthcare facilities. Finally, we included 476 patients with CLBP.
MRI Acquisition
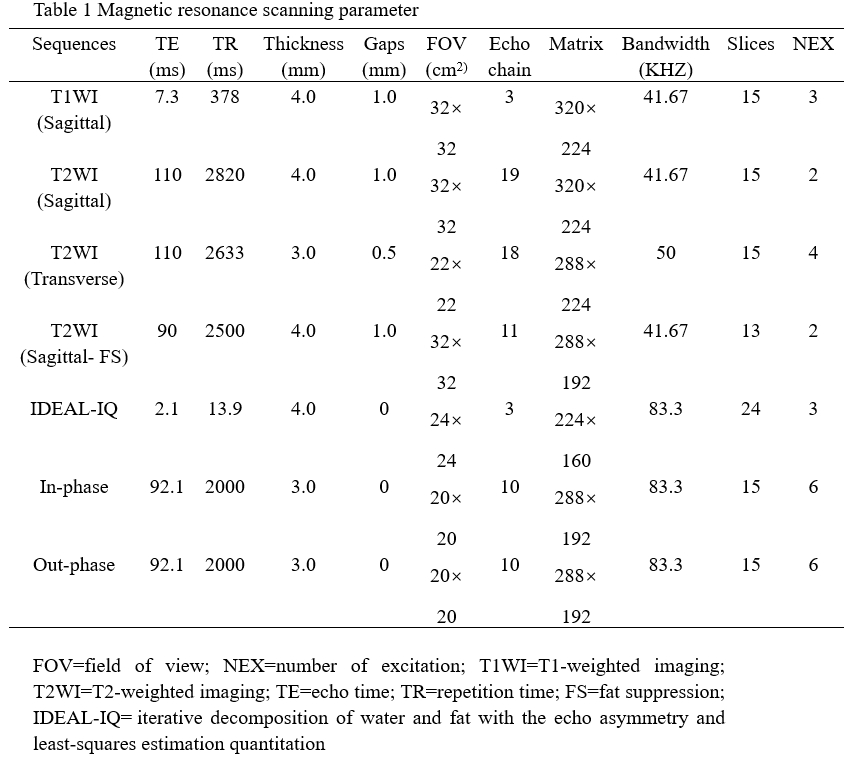
All MR examinations were performed on a 3.0T MR scanner (Discovery MR 750, GE Healtheare Systems, Milwaukee, WI, USA) equipped with a 24-channel phased-array spine coil. Detailed parameters of scanning are shown in Table 1.
Data Analysis
MCs were categorized into three types based on their signal intensity on T1 and T2-weighted imaging. The region of interest (ROI) was placed in the L1-4 vertebra and the L3 level cerebrospinal fluid (CSF) in the median sagittal position, and the signal intensity (SI) in each ROI was recorded. VBQ was calculated using the formula: SIL1-4/SICSE. The PDFF values and cross-sectional area (CSA) were measured on the fat fraction map from the IDEAL-IQ sequences and in/out phase sequences, respectively. The boundaries of the left and right multifidus (MF) and erector spinae (ES) were outlined using Advantage Workstation 4.6 (GE Healthcare), and the average values of the left and right muscles were calculated. SPSS 26.0 software (IBM Corp., Armonk, NY, USA) was used for statistical analysis. According to whether the data conform to the normal distribution, the t-test of two independent samples or Mann-Whitney U test was selected. Multifactor linear regression analysis was used to analyze the relationship between the total muscles PDFF and baseline information. P<0.05 was considered significant.
Results
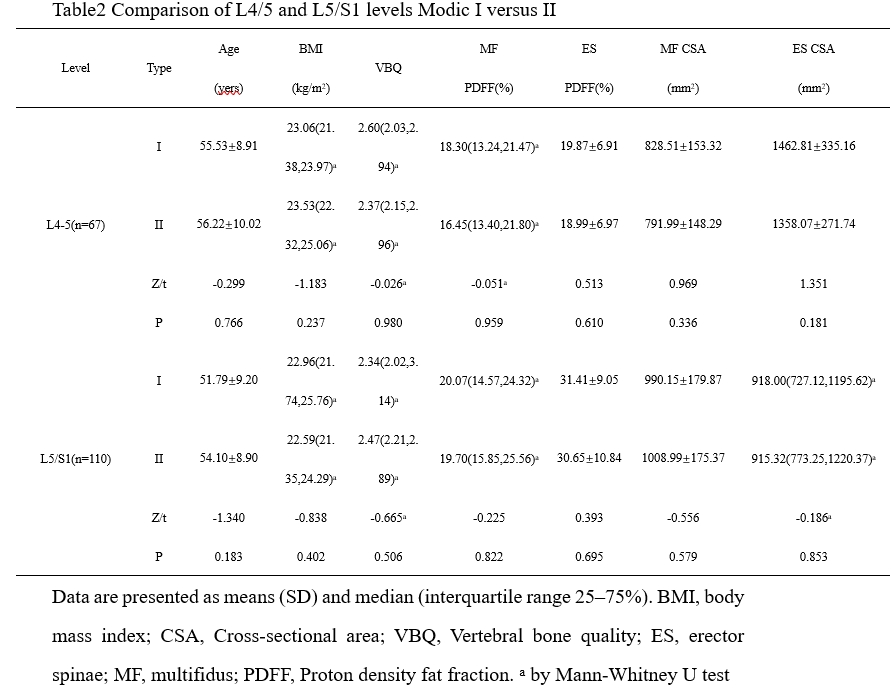
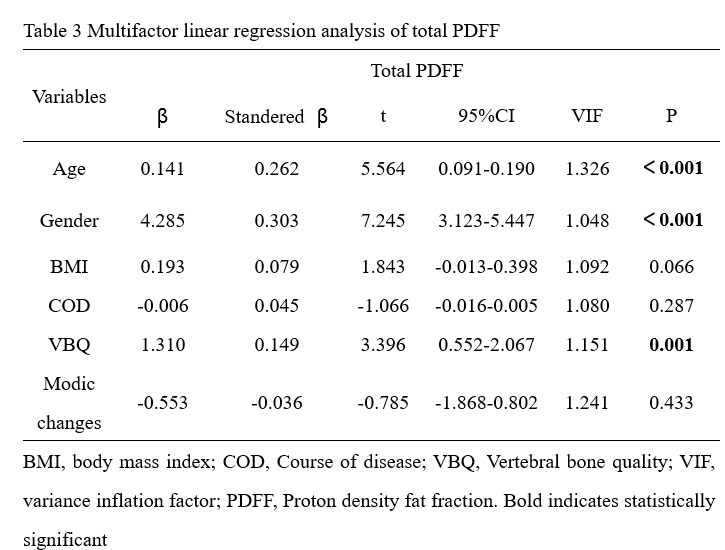
The results showed no significant difference in CSA and PDFF of MF and ES between Modic type I and type II at both levels (Table 2, all P values > 0.05). Multivariate linear regression analysis showed that age, sex, and VBQ were significantly related to the total PDFF (Table3). However, body mass index (BMI), Course of disease(COD), and MCs did not show significant significance in relation to PDFF (BMI: β=0.093, P=0.066; COD: β=-0.006, P=0.287; MCs: β=-0.553, P=0.433).Discussion
Our study found no significant difference in paraspinal muscles' PDFF and CSA between Modic type I and Modic type II at both levels. Limited literature exists on the relationship between MCs and paraspinal muscles, but one study reported that LBP patients with Modic type I and I/II changes had higher percentage fat content compared to patients without MCs6. Additionally, other studies have found that patients with Modic changes have smaller psoas cross-sectional area at specific intervertebral disc levels7. However, these studies did not specifically compare Modic type I and type II. A study on cervical vertebrae also found no significant differences in fat metabolism variables between Modic type I and I/II8, partially supporting our findings. Due to the small number of Modic type III cases, they were not included in the statistical analysis. VBQ is based on MRI, which has been used to measure fatty infiltration within the vertebral body9. In this study, it was found by multiple regression that there was a relationship between VBQ and total paraspinal muscles PDFF, and the PDFF increased by 1.31 units for every unit increase of VBQ. To our knowledge, there were few studies to explore the association of VBQ with paraspinal muscles fat infiltration and the specific causal relationship requires further longitudinal study.Conclusion
In conclusion, our findings indicate no difference in paraspinal muscles' CSA and PDFF between Modic type I and type II. Furthermore, we observed a positive linear relationship between VBQ and total paraspinal muscles' PDFF. These conclusions may provide valuable insights for the clinical treatment of CLBP patients.Acknowledgements
This work is supported by the National Natural Science Foundation of China (No. 82260338).References
1.Perilli E, Parkinson I H, Truong L-H, Chong K C, Fazzalari N L, Osti O L. Modic (endplate) changes in the lumbar spine: bone micro-architecture and remodelling European Spine Journal 2014; 24: 1926-1934.
2.Hebelka H, Brisby H, Erkmar A, Lagerstrand K. Loading of the Spine in Low Back Pain Patients Does Not Induce MRI Changes in Modic Lesions: A Prospective Clinical Study Diagnostics (Basel) 2022; 12:1815.
3.Soliman M A R, Aguirre A O, Kuo C C, et al. Vertebral bone quality score independently predicts cage subsidence following transforaminal lumbar interbody fusion Spine J 2022; 22: 2017-2023.
4.Salzmann S N, Okano I, Jones C, et al. Preoperative MRI-based vertebral bone quality (VBQ) score assessment in patients undergoing lumbar spinal fusion Spine J 2022; 22: 1301-1308.
5.Huang Y, Wang L, Zeng X, et al. Association of Paraspinal Muscle CSA and PDFF Measurements With Lumbar Intervertebral Disk Degeneration in Patients With Chronic Low Back Pain Front Endocrinol (Lausanne) 2022; 13: 792819.
6. Atci I B, Yilmaz H, Samanci M Y, Atci A G, Karagoz Y. The Prevalence of Lumbar Paraspinal muscles Fatty Degeneration in Patients with Modic Type I and I/II End Plate Changes. Asian Spine J 2020;14:185-191.
7. Arbanas J, Pavlovic I, Marijancic V, Vlahovic H, Starcevic-Klasan G, Peharec S, Bajek S, Miletic D, Malnar D. MRI features of the psoas major muscles in patients with low back pain. Eur Spine J 2013;22:1965-1971.
8. Bai J, Yu K, Sun Y, Kong L, Shen Y. Prevalence of and risk factors for Modic change in patients with symptomatic cervical spondylosis: an observational study. J Pain Res 2018;11:355-360.
9. Chen Z, Lei F, Ye F, Yuan H, Li S, Feng D. MRI-based vertebral bone quality score for the assessment of osteoporosis in patients undergoing surgery for lumbar degenerative diseases. J Orthop Surg Res 2023;18:257.
Figures