1545
Progression of Miyoshi muscular dystrophy monitored by quantitative MRI1Internal Medicine III, Medical University of Vienna, Vienna, Austria, 2High Field MR Center, Department of Biomedical Imaging and Image-Guided Therapy, Medical University of Vienna, Vienna, Austria, 3Biomedical Centre Martin, Comenius University in Bratislava, Jessenius Faculty of Medicine in Martin, Martin, Slovakia, 4internal Medicine III, Medical University of Vienna, Vienna, Austria, 5High Field MR Center, Department of Biomedical Imaging and Image-Guided Therapy, Medical University of Vienna, Vienna, Austria, 6CD Laboratory for MR Imaging Biomarkers (BIOMAK), Vienna, Austria, 7Austrian Cluster for Tissue Regeneration, Ludwig Boltymann Institute for Experimental and Clinical Traumatology, Vienna, Austria, 8Institute for Clinical Molecular MRI in the Musculoskeletal System, Karl Landsteiner Society, Vienna, Austria, 9Department of Neurology, Comenius University in Bratislava, Jessenius Faculty of Medicine in Martin, Martin, Slovakia
Synopsis
Keywords: Muscle, Rare disease, dystrophy, dysferlinopathy
Motivation: To characterize the skeletal muscle and assess progression of the Miyoshi dystrophy by quantitative MRI.
Goal(s): Compare the changes in fat fractions in individual calf muscles 10 months apart in time.
Approach: Lower extremity of 4 dystrophic patients were measured in 3T scanner by multiecho-Dixon sequence in two time points. Three asymptomatic DYSF gene carriers served as reference.
Results: Fat fraction increased in all measured muscles in dystrophic patients while staying stable in controls. The most significant increments were detected in the muscles most preserved (TP, FDL, EXT, FHL). Variation can be observed even within the patients with the same genotype.
Impact: Using quantitative analysis based on automatically generated fat fraction maps for assessment of Miyoshi dystrophy in muscles allow clinically feasible monitoring of the disease progression and description of the pattern of the disease.
Introduction and aim
Miyoshi myopathy is a rare type of muscular dystrophy caused by changes in the DYSF gene, being part of dysferlinopathic group of diseases. Weakness and atrophy affect mainly lower extremities, especially in calf muscles. Progression of the disease is mapped to some extension1-3. AIM of the study was to detect and quantify fat infiltration in calf muscles of individuals with symptomatic Miyoshi myopathy with the same genotype and assess the progression of the disease, compared to asymptomatic carriers.Subjects
Family with mutation in DYSF gene with 4 siblings (2f/2m) with manifested dystrophy symptomatically mainly in lower legs, with average duration of disease 19.8 ± 5.0 years, age 36.0 ± 5.1 y, BMI 21.9 ± 2.9 kg/m2 and 3 siblings (2m/1f) being asymptomatic carriers only, age 35.0 ± 5.3 y, BMI 22.4±1.9 kg/m2, participated in the study. Four healthy volunteers, age 35.0±2.9, BMI 21.7±0.94 kg/m2, were measured for reference.Methods
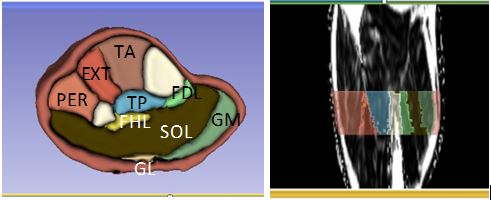
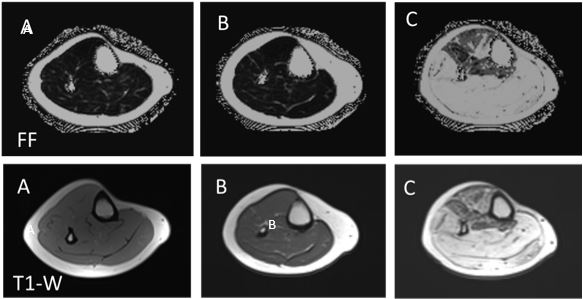
Study was performed at 3T MR system (Prisma Fit Siemens) using 15-Channel 1H Tx/Rx knee coil (Siemens). The calf muscles of the right leg were examined in supine position 10 months apart. Measurement protocol consisted of multi-echo Dixon with resolution 1.1x1.1x3mm3, TR/TEs= 9.7/1.5, 2.8, 4.1, 5.4, 6.8, 8.1 ms, T1-w images. Nine muscles were segmented using 3D slicer4 (Fig.1) in the volume between distal end of popliteus muscle and distal end of gastrocnemius lateralis muscle (average number of slices 19 ± 3). Average fat fraction (FF) was calculated for each single muscle and changes in time were compared for individual cases. Average FF for individual muscles for each group of study participants (dystrophics and carriers) was calculated as well, and their ratios were assessed.Results and discussion
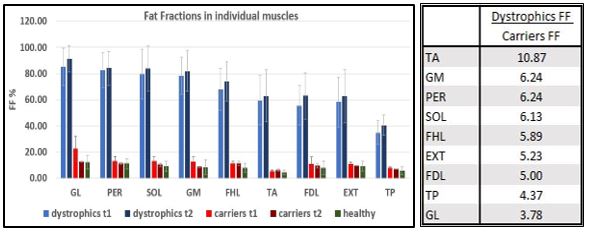
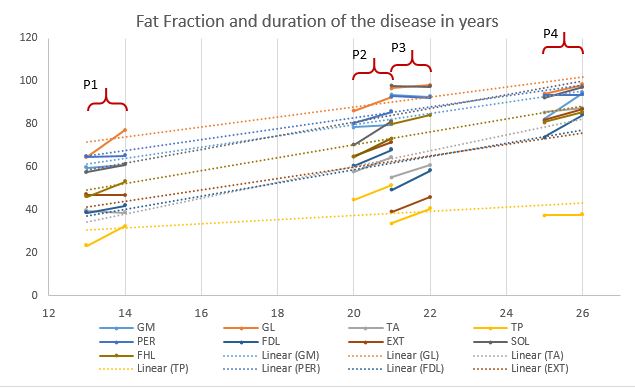
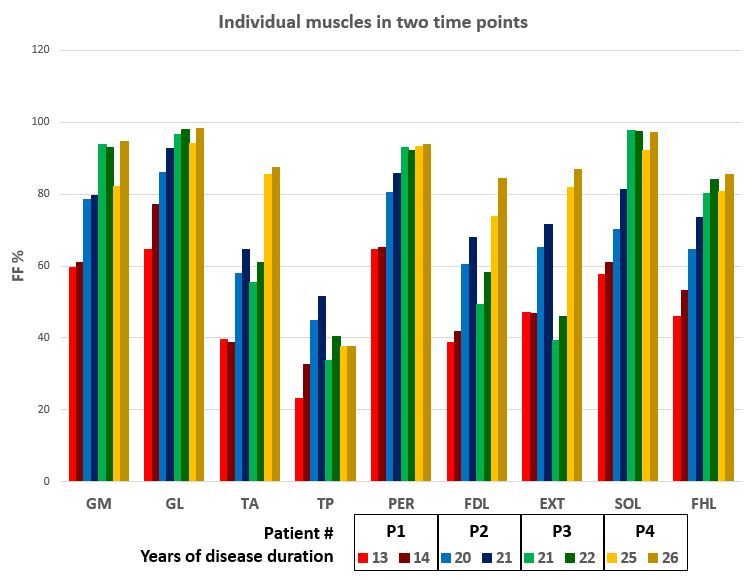
Fat fraction was significantly higher in dystrophic patients in all calf muscles in both time points compared to asymptomatic carriers (Fig.2), with average 66.9 ± 16.5 % vs 12.1 ± 4.7% in the first measurement, and with average 71.7 ± 15.9% vs 9.8 ± 2.1% in the second measurement 10 months later. Carriers didn’t differ from healthy volunteers. Fat fraction was higher in comparison to carriers ranging from 3.79 fold in gastrocnemius lateralis (GL) to 10.87 fold in tibialis anterior (TA) (Fig.3). The most affected muscles were those of posterior chain of the calf, responsible for plantar flexion of the foot - gastrocnemius medialis and lateralis and soleus muscle (GM, GL, SOL) and peroneus (PER) muscle responsible for eversion and stabilizing the arch. The most preserved was deep tibialis posterior (TP) muscle. Fat fraction in all muscles in dystrophic subjects increased with time, contrary to asymptomatic carriers. The biggest percentual increase with significant difference was observed in the muscles originally less severely affected (flexor digitorum longus FDL and flexor hallucis longus FHL – 8% and 6%, p<0.05, followed by tibialis posterior TP and extensor muscles EXT with 6% and 5%, p=0.59 and p=0.67). When muscles were assessed individually pooling data from all patients and comparing for the pattern of the disease progression with regard to the duration of the symptomatic disease, fat fraction increased in most muscles. Although there can be observed linear increase of fat fraction in most muscles, data from patient 3 (P3) differ from this pattern of progression (Fig.4), with unexpected higher FF in one group of muscles (GL, SOL, PER, FHL) and lower FF in other group of muscles (TP, EXT, FDL, TA) (P3). From the perspective of individual muscles, FDL, EXT and TA (progression slowed down in P3) and TP (progression slowed down in P3 and P4) differ from linear tendency (Fig.5). Similarly, it was shown that pattern of disease progression in dystrophies is not uniform and not linear in time2. The trends observed in our study agree with previous findings1-3, but although our patients are siblings with the same combination of mutation in genes, variation is observable.Conclusion
Multi-echo Dixon sequence is practical and clinically feasible tool for quantitative examination of fat replacement in muscles in Miyoshi dystrophy. Two consecutive assessments ten months apart showed increase in fat fractions in all calf muscles of four dystrophic patients with the same genotype of dystrophy. Individual patterns of the disease in general agree with already described fat replacement in lower leg, with slight individual variations. Further monitoring of the progression in the calf, as well as thigh muscles, together with analysis of T2 values for more detailed pattern are proposed.Acknowledgements
No acknowledgement found.References
1Bardakov SN, Tsargush VA, Carlier PG et al, Magnetic resonance imaging pattern variability in dysferlinopathy. Acta Myol. 2021 Dec; 40(4):158-171
2Díaz-Manera J, Fernández-Torrón R, Llauger J, James MK, Mayhew A, Smith FE, et al. Muscle MRI in patients with dysferlinopathy: pattern recognition and implications for clinical trials. J Neurol Neurosurg Psychiatry 2018;89:1071–1081
3Reyngoudt H, Smith FE, de Almeida Araújo EC et al. Three-year quantitative magnetic resonance imaging and phosphporus magnetic resonance spectroscopy study in lower limb muscle in dysferlinopaty. Cachexia Sarcopenia Muscle . 2022 Jun;13(3):1850-1863. doi: 10.1002/jcsm.12987. Epub 2022 Apr 3.
4Fedorov A, Beichel R, Kalpathy-Cramer J et al., 3D Slicer as an image computing platform for the Quantitative Imaging Network. Magn Reson Imag 2012;30 (9):1323-41
Figures