1544
Temperature dependence of T1 and T2* in ex vivo ovine Achilles tendons1Medical Physics Group, Institute of Diagnostic and Interventional Radiology, Jena University Hospital, Friedrich Schiller University, Jena, Germany, 2Julius Wolff Institute, Berlin Institute of Health at Charité, Universitätsmedizin, Berlin, Germany, 3Institute of Diagnostic and Interventional Radiology, Jena University Hospital, Friedrich Schiller University, Jena, Germany
Synopsis
Keywords: Tendon/Ligament, Quantitative Imaging, Temperature
Motivation: While the dependence of the relaxation parameters T1 and T2* on temperature has been studied in aqueous solutions and in some biological tissues, such observations for complex organized tissues including tendons have not been investigated previously.
Goal(s): To measure how T1 and T2* change with temperature in Achilles tendon samples.
Approach: T1 and T2* were continuously measured while fresh ex vivo Achilles tendon samples were placed in a heated environment and cooled down over several hours.
Results: The change in T2* with temperature was nonlinear and much higher than that reported in the literature for other tissues
Impact: The change in T2* in Achilles tendons was 4.8+/-2.1%/°C, which is substantially higher than reported in other biological tissues and indicates that the theory of temperature dependence of MRI relaxation parameters may not apply to highly organized tissues like tendons.
INTRODUCTION
It is known from literature and MRI relaxation theory that T1 and T2 (respectively T2*) relaxation parameters are dependent on temperature1,2,3. T1 has been shown to increase linearly with temperature, while T2* also shows a dependence on temperature, but typically with a smaller or nearly negligible magnitude compared to T14. However, the theory of temperature dependence of MRI relaxation parameters was initially developed for aqueous solutions, and its extension to more complex organized tissues such as tendons has proven challenging. In this work, we applied ultra-short echo-time (UTE) sequences to quantify T1 and T2* across temperatures ranging between 27°C and 35.5°C in ovine Achilles tendon samples.METHODS
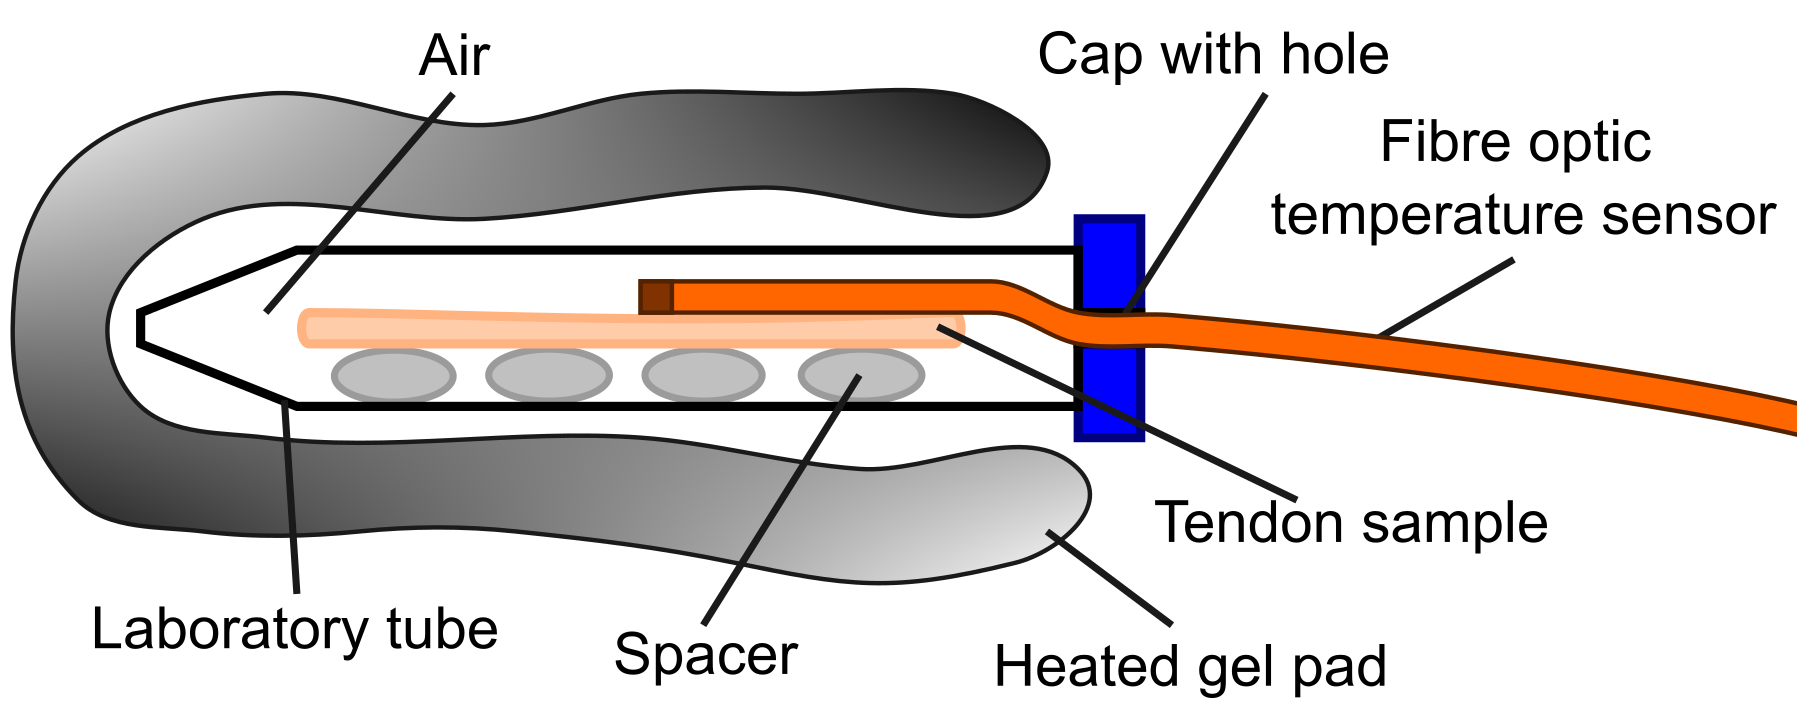
Two fresh Achilles tendons from a healthy sheep were excised after euthanasia in a different research project in compliance with the ethical guidelines of the local animal rights protection authorities. The samples were denuded, enveloped in plastic wrap, and stored in a sealed laboratory tube to avoid dehydration until the MRI scans could be performed later the same day. To control the temperature of the tendon samples during the MRI scan, a commercially available gel-based heat pack was pre-heated to 45 °C before wrapping the pack around the laboratory tube that contained the tendons. Subsequently, the air temperature inside the tube in close vicinity to the denuded tendons was measured continuously, while the heat pack cooled down over the course of 14 hours. The air temperature inside the tube in close vicinity of the tendons never exceeded 39 °C during the experiment, thereby eliminating the possibility of protein denaturation. The experimental setup is schematically depicted in Figure 1. While the heat pack/tendons cooled down, two sets of UTE sequences were acquired in an interleaved fashion. The first set of UTE sequences acquired seven flip angles between 4° and 24° with a TE/TR of 0.07/10 ms for VFA based T1 mapping; the second set of UTE sequences acquired 18 echoes spanning 0.07 ms to 3.36 ms for T2* mapping using a combination of multi-echo acquisition and echo train shifting with a flip angle of 6° and a TR of 6.2 ms. All other acquisition parameters were identical: 1.1 x 1.1 x 1.1 mm³ voxel size, 1177 Hz/pixel bandwidth. The data were acquired using a 16-channel flex coil and a 3T scanner (Prisma, Siemens Healthineers). Parameter fitting was performed using the standard VFA-FLASH model for T1 and mono exponential fitting for T2*. Subsequent analysis was performed by drawing multiple regions of interest (ROIs) in the central area of adjacent transverse slices across the mid-tendon region and averaging of the results.RESULTS
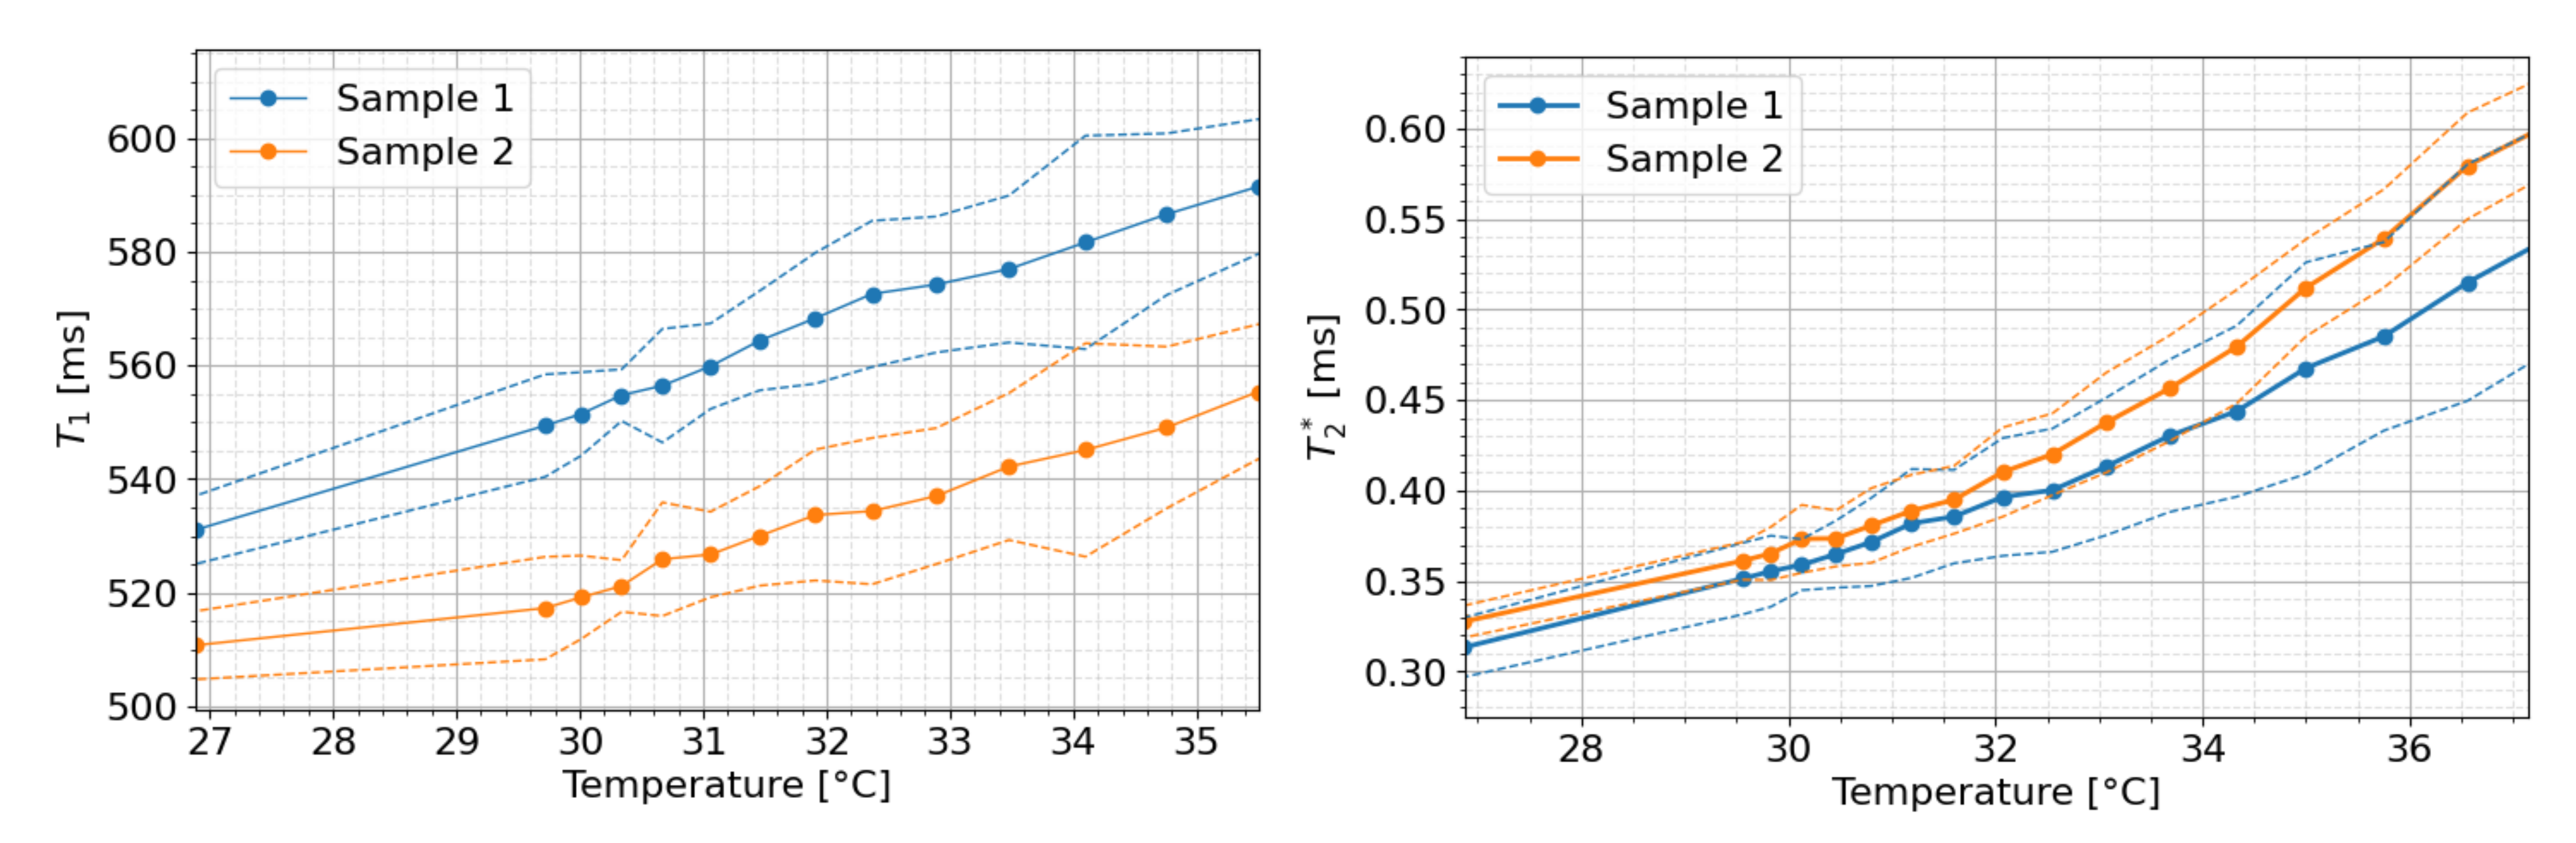
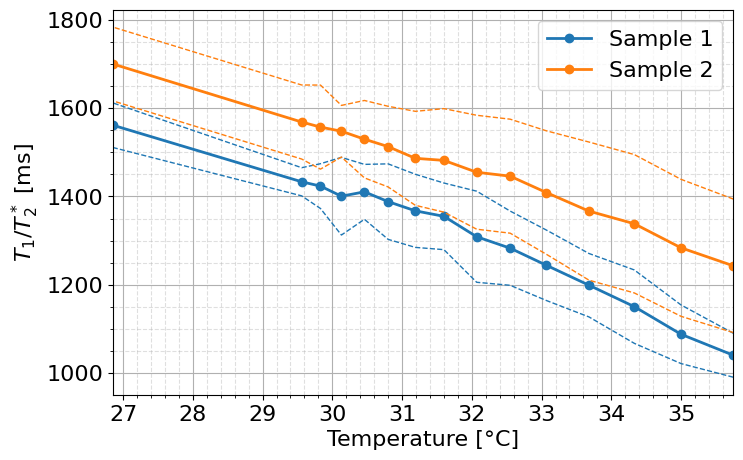
The observed change in T1 was positively linear (Fig. 1) with an average change of 6.7 +/- 1.7 ms/°C (1.2 +/- 0.3 %/°C). For T2*, the temperature dependence was non-linear (Fig. 2) with a positive rate of 0.026 +/- 0.012 ms/°C (4.8 +/- 2.1 %/°C). The different rates of how T1 and T2* changed with temperature also resulted in the ratio of T1/T2* to depend on the temperature (Fig. 3).DISCUSSION AND CONCLUSION
The observed change in T1 with temperature appears to be consistent with values reported in the literature for other tissues, which typically show changes of approximately 1%/°C4. Our results are also similar to those of muscles, where a change in T1 of 1.4 %/°C5 was reported. However, with a change of 4.8 %/°C, T2* showed a much higher temperature dependence compared to typical values of 1–2%/°C as reported for various solutions and substances6,7. Some literature even reported no dependence of T2 or T2* on the temperature for tissues such as brain8 or the myocardium9. This strong temperature dependence of T2* could be related to the highly ordered, collagen-rich structure of tendons where the motion of water molecules is highly restricted. Furthermore, within the investigated temperature range the change in T2* with temperature appears to be non-linear, suggesting that additional factors may need to be considered when applying the MR theory for temperature dependence of relaxation parameters to highly ordered tissues such as tendons. Moreover, the notable temperature dependence of T2* observed in this work should be taken into account when performing ex vivo scans of tendon samples to ensure more consistent results between studies.Acknowledgements
This work was supported by a graduate scholarship from the Friedrich-Schiller-University Jena and the state of Thuringia (Landesgraduiertenstipendium) (to Marta B. Maggioni), the Competence Center for Interdisciplinary Prevention (KIP) at the Friedrich Schiller University Jena, the German Professional Association for Statutory Accident Insurance and Prevention in the Foodstuffs Industry and the Catering Trade (BGN) (projects 1.1.7.22 & 1.1.7.23) and the German Research Foundation (Deutsche Forschungsgemeinschaft; KR 4783/2-1).References
1) Bloembergen N, Purcell EM, Pound RV. Relaxation effects in nuclear magnetic resonance absorption. Physical Review 1948;73:679–712.
2) Bottomley PA, Foster TH, Argersinger RE, Pfeifer LM, A Review of normal tissue hydrogen NMR relaxation times and relax mechanisms from 1- 100MHZ: Dependence on tissue type, NMR frequency, temperature, species, excision, and age, Medical physics, 1984;11(4):425-48
3) Nelson T and Tung S. Temperature dependence of proton relaxation times in vitro. Magn Reson Med. 1987;5:189-1994.
4) Rieke V, Butts Pauly K. MR thermometry. J Magn Reson Imaging. 2008 Feb;27(2):376-90Cline HE, Hynynen K, Hardy CJ, Watkins RD, Schenck JF, Jolesz FA. MR temperature mapping of focused ultrasound surgery. Magn Reson Med 1994; 31: 628–636.6.
5)He T, Smith G, Carpenter JP, Mohiaddin R, Pennel D, Firmin D. A phantom study of temperature-dependent MRI T2* measurement. J Cardiovasc Magn Reson. 2009;11:147-151
6) Nelson TR, Tung SM. Temperature dependence of proton relaxation times in vitro. Magn Reson Imaging 1987; 5: 189–199.
7) Birkl C, Langkammer C, Haybaeck J, Ernst C, Stollberger R, Fazekas F, Ropele S. Temperature-induced changes of magnetic resonance relaxation times in the human brain: A postmortem study. Magn Reson Med; 2014;71:1575-158
8) Zech WD, Schwendener N, Persson A, Warntjes MJ, Jackowski C. Temperature dependence of postmortem MR quantification for soft tissue discrimination. Eur Radiol 2015;25:2381–2389.
Figures