1542
Skeletal muscle involvement in ageing: Exploring the relationship between MRI fat fraction and age in the muscles of the thigh1Norwich Medical School, University of East Anglia, Norwich, United Kingdom, 2Emory University School of Medicine, Atlanta, GA, United States, 3Vanderbilt University Institute of Imaging Science, Nashville, TN, United States, 4Laboratory of Clinical Investigation, National Institute on Aging, Baltimore, MD, United States, 5Translational Gerontology Branch, National Institute on Aging, Baltimore, MD, United States, 6Department of Medical Imaging, Radboud University Medical Center, Nijmegen, Netherlands
Synopsis
Keywords: Muscle, Aging, Sarcopenia, muscle quality, fat replacement
Motivation: Deposition of fat in skeletal muscle increases with age, leading to reduced muscle quality, but it is currently unclear which muscles are affected first and thus may serve as markers for the onset of this process.
Goal(s): To measure intramuscular fat in individual thigh muscles in a healthy ageing cohort.
Approach: We applied chemical-shift-based water-fat-separation imaging in 94 participants (median age=56, range=22-89yrs), and proton density fat fraction was calculated for 12 thigh muscles and different muscle groups.
Results: We showed age associations with fat deposition in the whole thigh overall (β=0.60, p≪0.001), with associations being stronger in women and in the hamstring muscles.
Impact: Understanding the relationship between proton density fat fraction and age in the thigh musculature—particularly in women and in the hamstring muscles—will help clinicians to identify specific muscle targets for interventions designed to reduce functional decline with ageing.
Background
Ageing is associated with a progressive decline in skeletal muscle mass, termed sarcopenia, as well as a decline in muscle strength. These two processes occur together, but the decline in strength outpaces the decline in mass by as much as a factor of five1. The differential effects of ageing on muscle mass and strength may be partly explained by an age-associated increase in fat deposition between and within myofibres2,3. MRI is ideally suited to the estimation of intramuscular fat through techniques such as chemical-shift-based water-fat-separation imaging. These ‘Dixon’ methods have been shown to correlate with histology4 and are highly reproducible5,6, making them ideal for assessing muscle quality in longitudinal studies of ageing.In this work, we investigate the associations between thigh intramuscular fat from Dixon MRI and age and sex, and we explore the involvement of individual thigh muscles in ageing: namely, which muscles are preferentially replaced by fat, and which muscles tend to be spared.
Methods
We recruited 94 participants (median age=56, range=22-89yrs) as part of the GESTALT longitudinal study of ageing. Imaging experiments were conducted on a 3T scanner (Achieva, Philips Healthcare, NL) with a 32-channel cardiac coil for reception.After localisers, T1-weighted images were acquired over both thighs using a 3D spoiled gradient recalled echo sequence. A 3D modified two-point Dixon (mDIXON) sequence was then applied in the left thigh with the distal edge of the volume positioned at the superior edge of the patella. The following parameters were used: TR/TE=5.8/[1.4, 2.6]ms, FA=6°, field-of-view=256×228 mm, in-plane resolution= 1×1mm, 60 slices, 3mm thickness, and SENSE factor 2 in the phase-encoding direction.
Fat- and water-only images were generated in-line from Dixon in- and opposed-phase images. Proton density fat fraction (PDFF) maps were calculated in MATLAB (2023a, The Mathworks) via the following equation: $$$\tt PDFF \left(\% \right)=Signal_{fat}/\left(Signal_{water}+Signal_{fat}\right)\times100$$$, where Signalfat is the pixel signal intensity in fat images and Signalwater the intensity in water images.
ROIs were drawn on Dixon water images using 3D Slicer (v4, www.slicer.org) in the following muscles: the quadriceps—the rectus femoris, and vastus intermedius, medialis, and lateralis; the sartorius; the adductors—the gracilis, and adductors magnus and longus; and the hamstrings—the semimembranosus, semitendinosus, and biceps femoris short and long heads. ROIs were eroded by two voxels to minimise the influence of subcutaneous and intermuscular fat on PDFF estimates. The median PDFF was then calculated per muscle, and for muscle groups (whole thigh, quadriceps, hamstrings).
Relationships between PDFF and age were evaluated in R (v4, R Foundation) using linear regressions with standardised variables. Bonferroni correction for multiple tests—12 muscles and 3 muscle groups—gave an adjusted p-value of 0.003.
Results
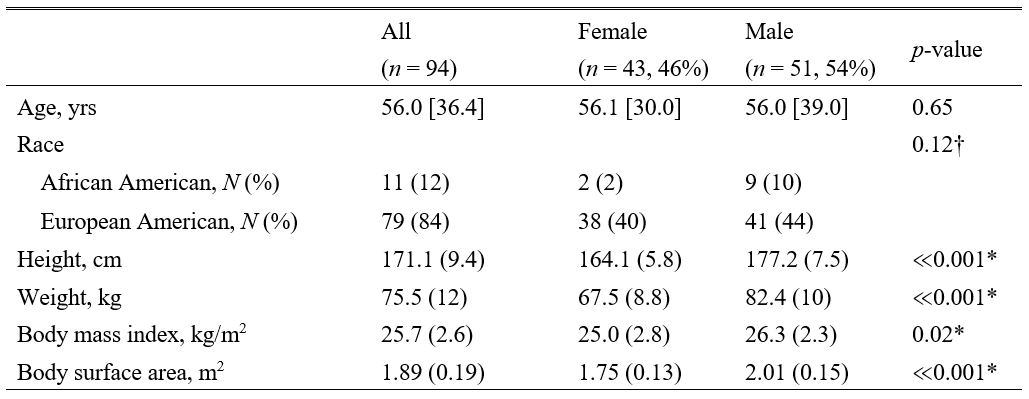
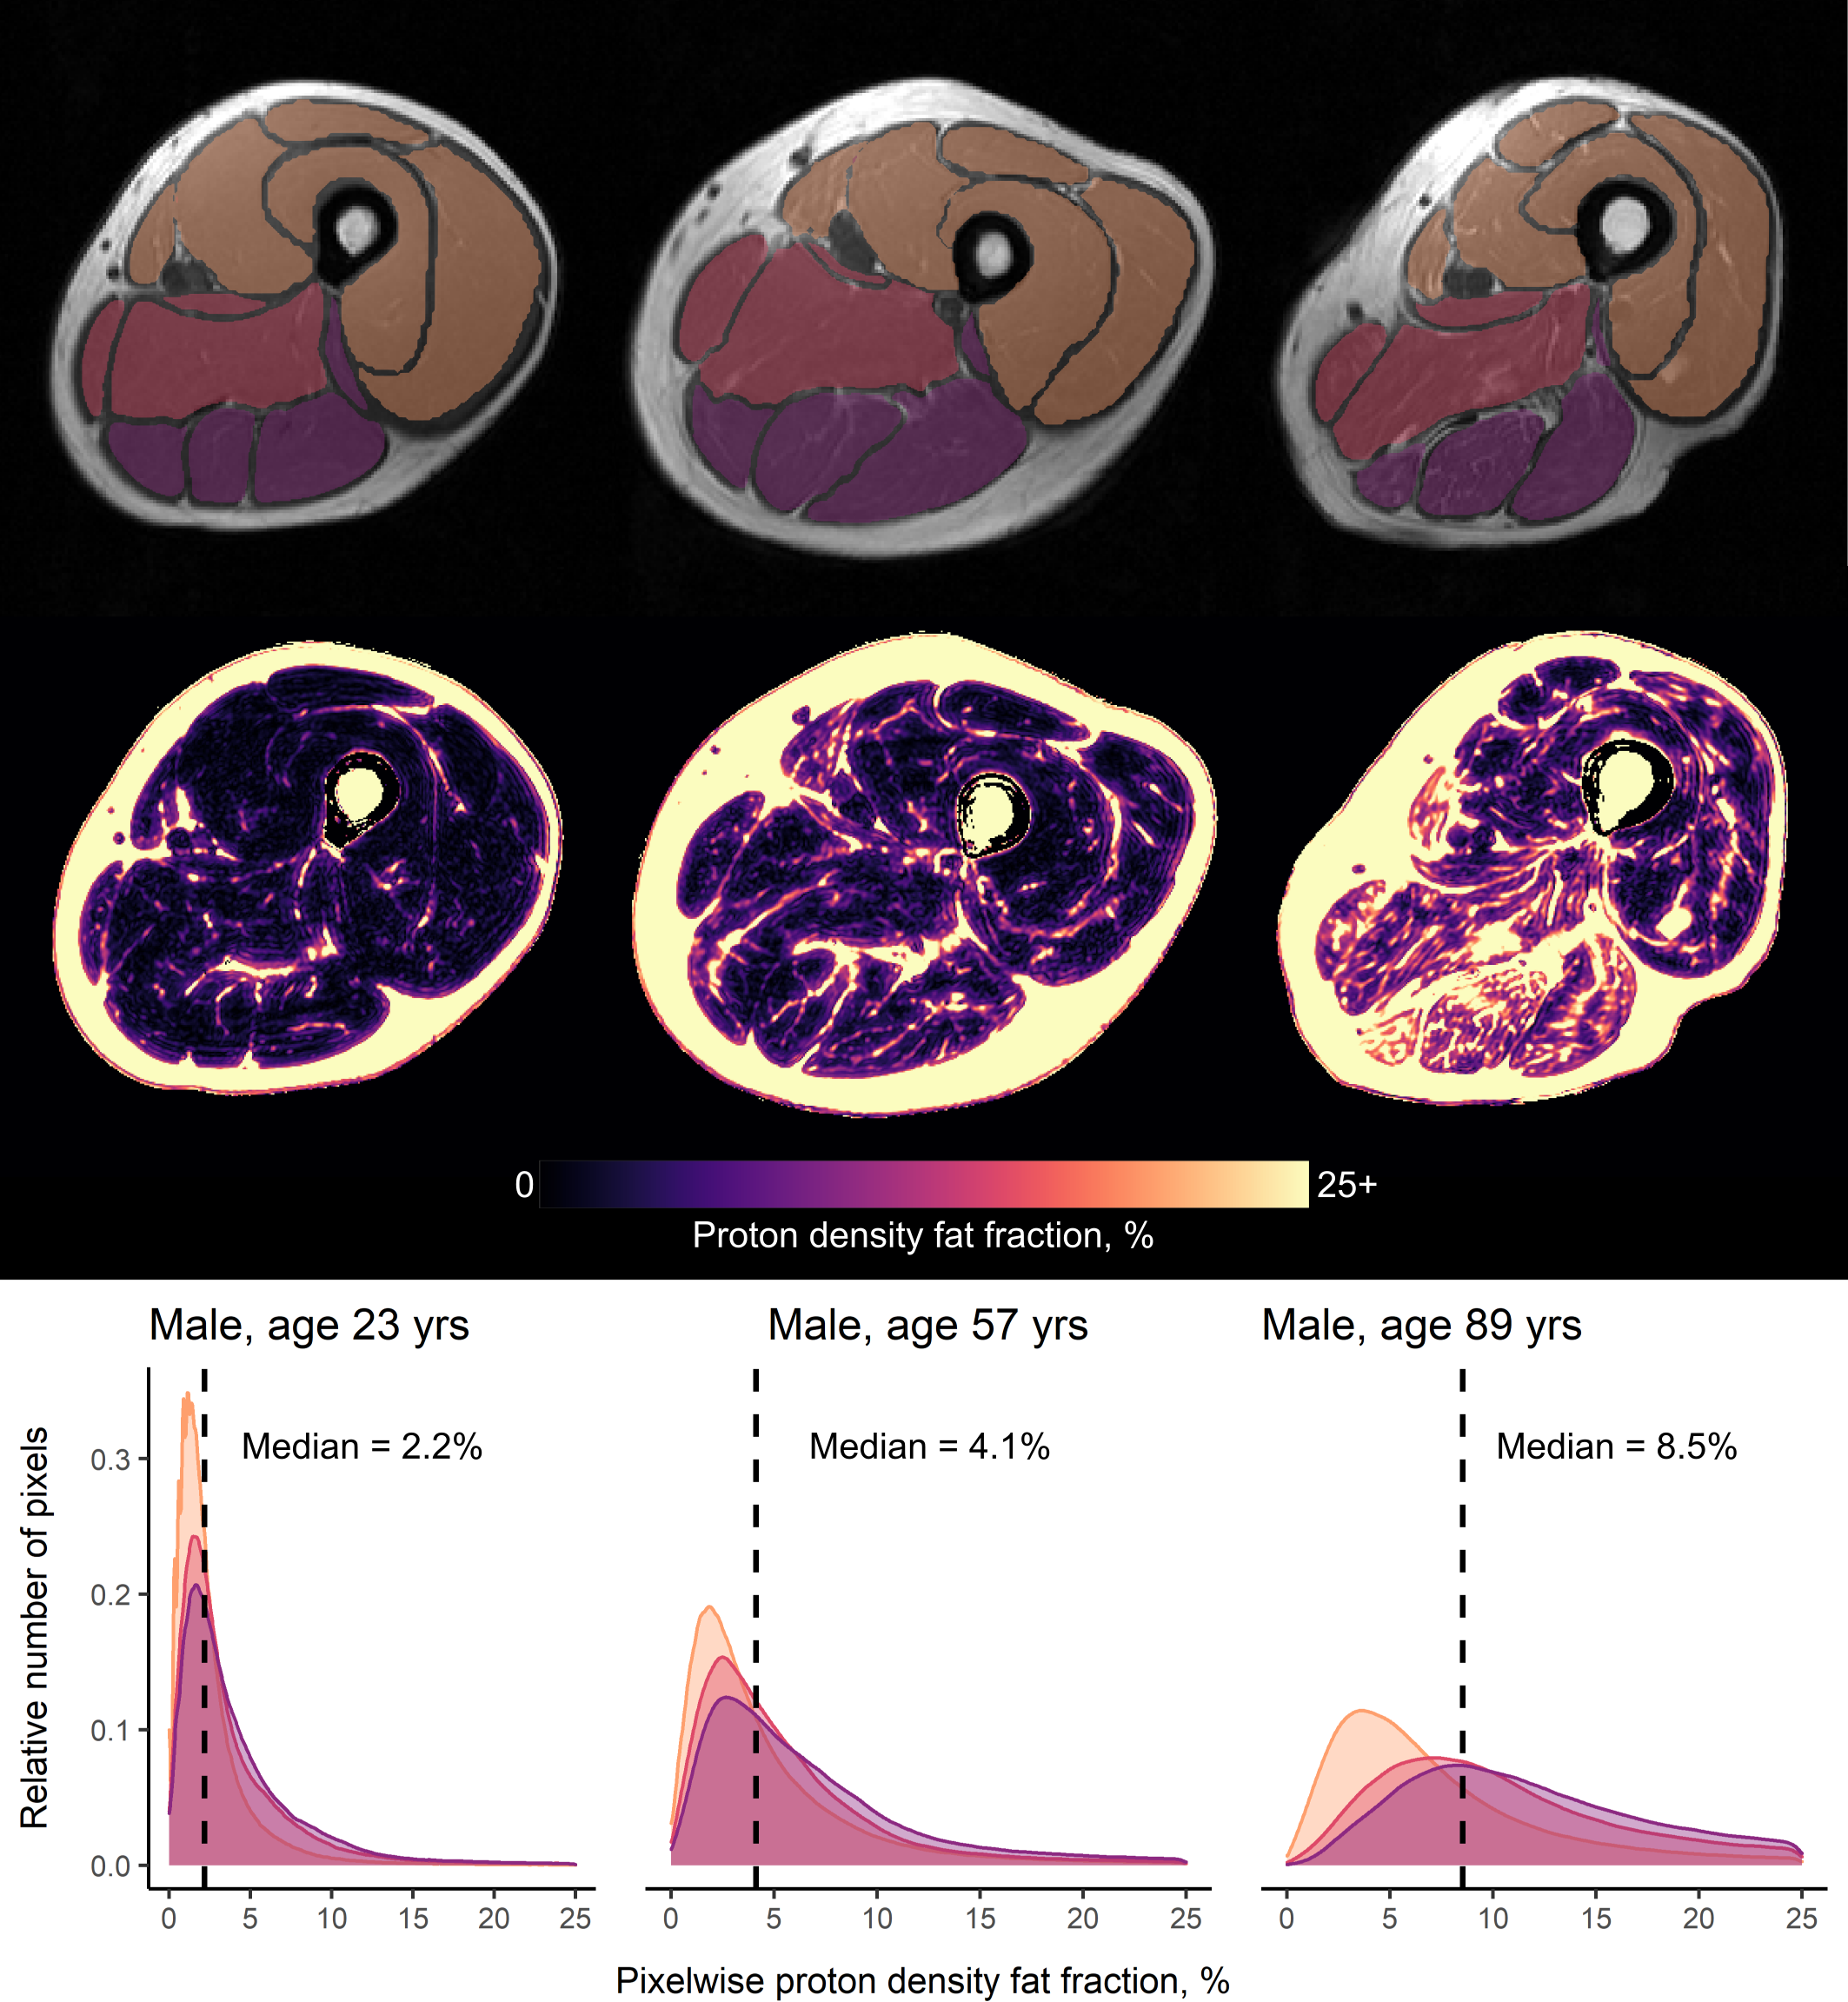
Table 1 shows demographic data; Figure 1 shows representative T1-weighted images, PDFF maps, and PDFF distributions for younger, middle-aged, and older male participants.In the whole cohort, the median PDFF over the whole thigh was significantly associated with age (β=0.60, R2=0.35, p≪0.001). This relationship also held true for the quadriceps muscles (β=0.57, R2=0.32, p≪0.001) and tended to be stronger [SR([1] in the hamstring muscles (β=0.62, R2=0.37, p≪0.001). The association between whole-thigh PDFF and age also tended to be stronger in women (β=0.69, R2=0.47, p≪0.001), than in men (β=0.55, R2=0.28, p≪0.001).
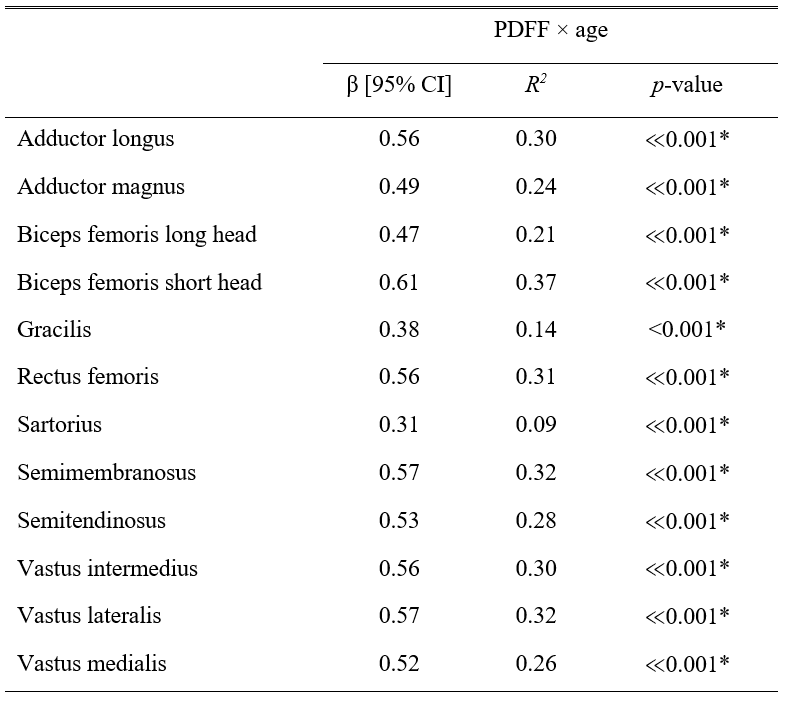
Per-muscle associations between muscle median PDFF and age are shown in Table 2. The biceps femoris short head and semimembranosus were most strongly associated with age (β=0.61, 0.57), whereas the sartorius and gracilis showed the weakest associations (β=0.31, 0.38).
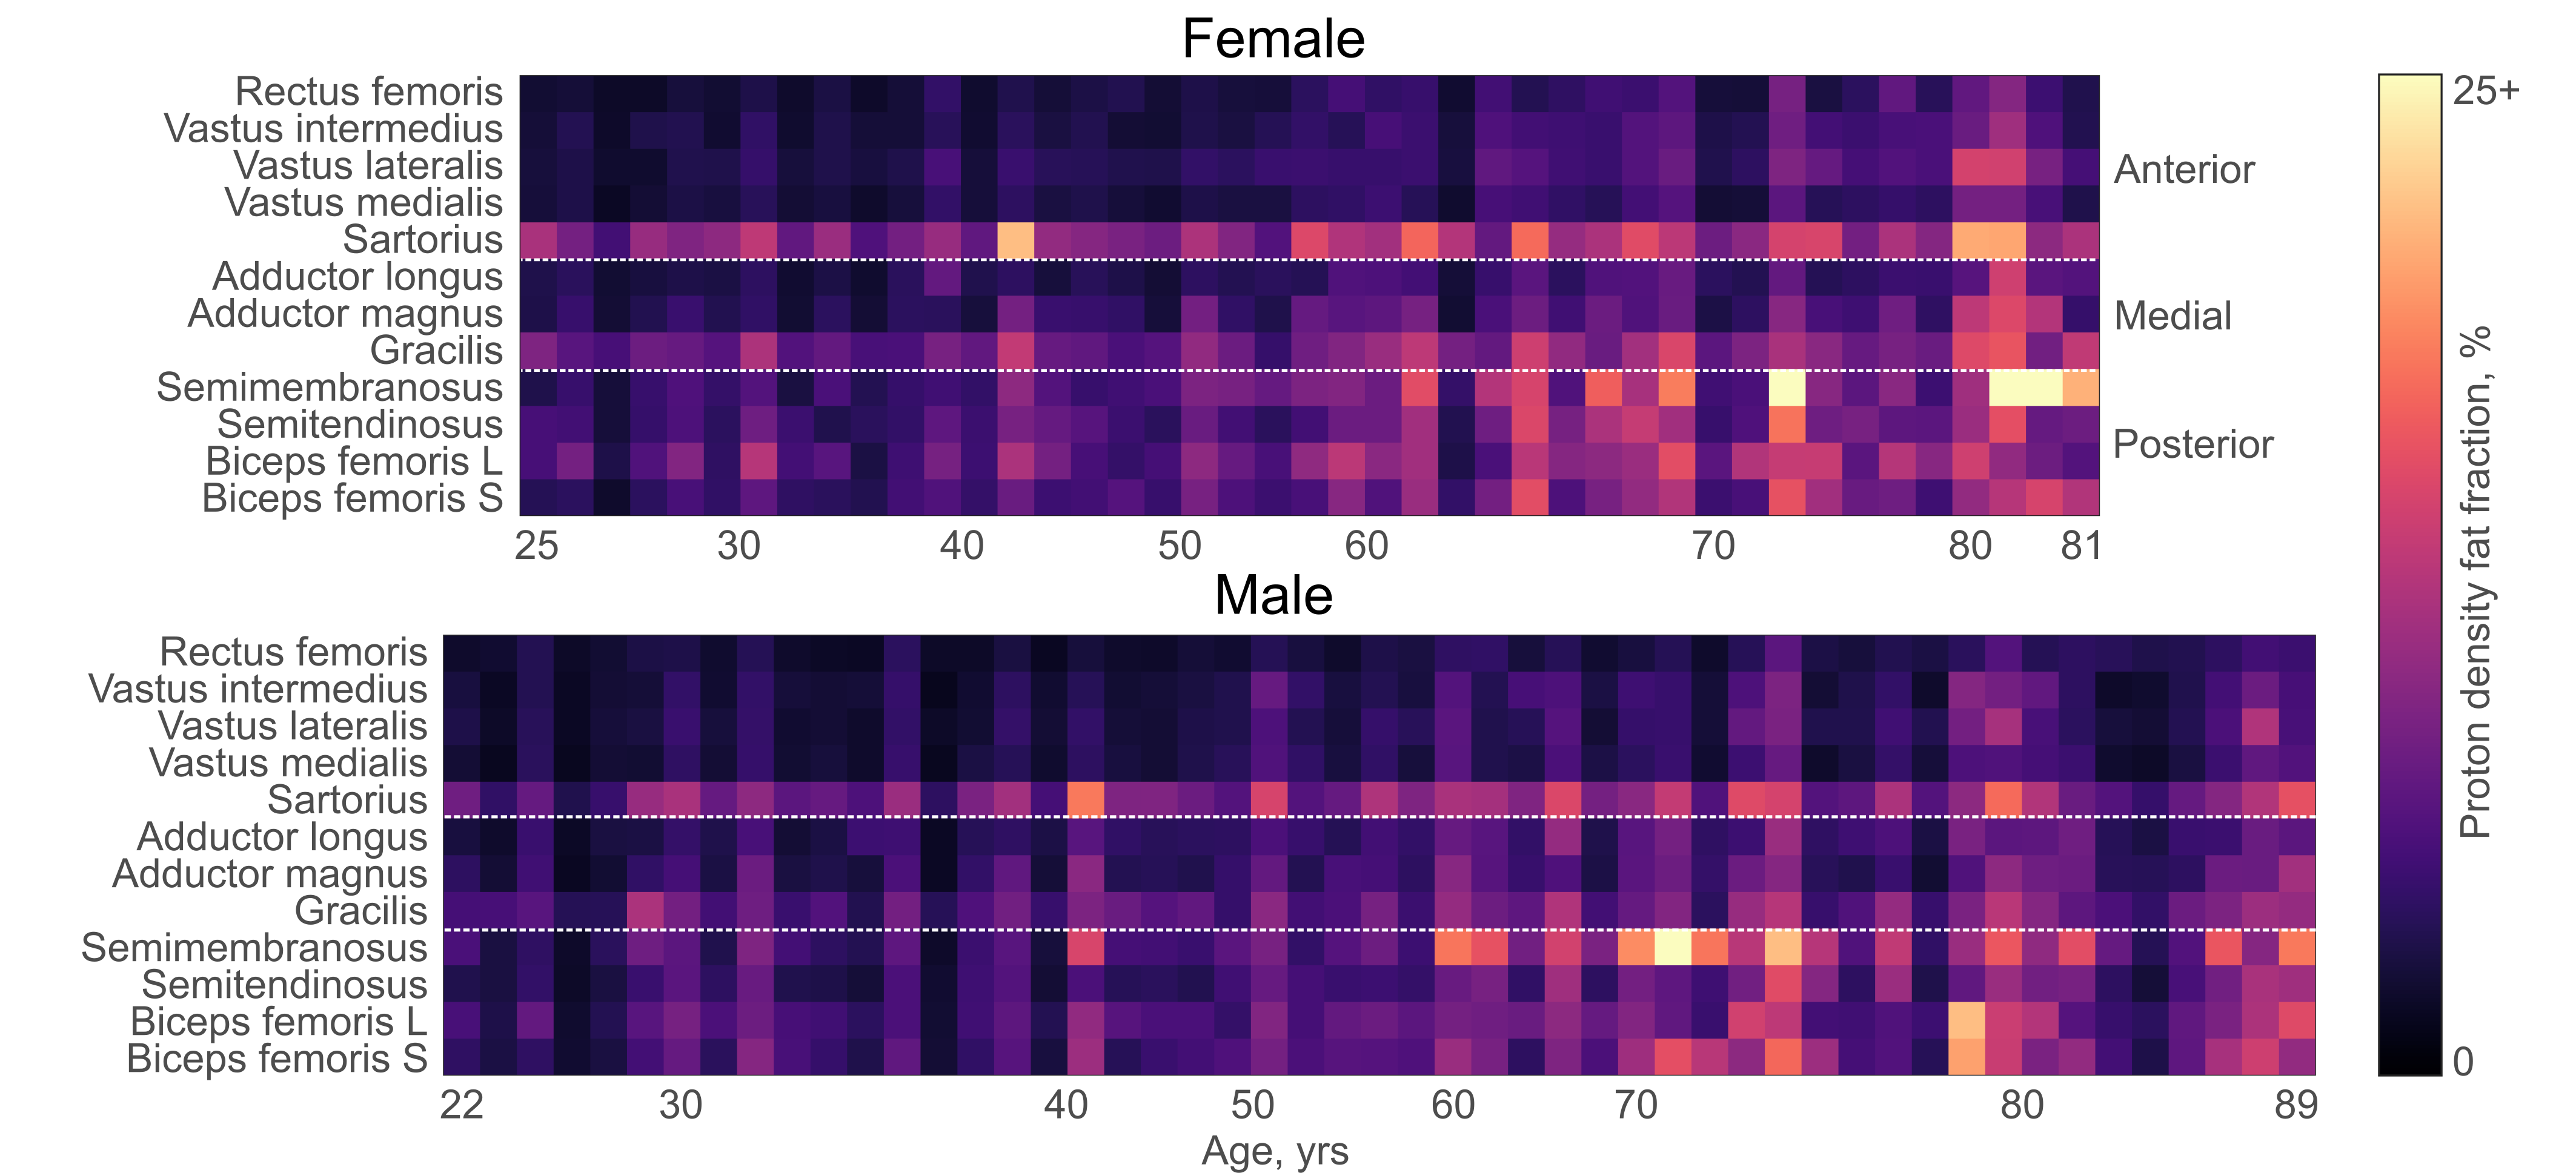
Figure 2 illustrates per-muscle PDFF differences with age as a heatmap. PDFF tends to increase with age, particularly in the posterior compartment—the hamstring muscles—whereas the anterior muscles —the quadriceps—are relatively spared. The sartorius and gracilis muscles, which are more superficial, tend to have higher PDFFs throughout the range of ages we have studied.
Discussion
We show that thigh muscle PDFF is associated with age, particularly in the hamstring muscles, and this age association is stronger in female participants than in male participants. Notably, previous work in this cohort showed no associations between physical activity levels and age and sex.7 Here, PDFFs in several individual muscles—such as the semimembranosus and biceps femoris short head—had stronger age associations, perhaps supporting their use as biopsy targets for clinical trials or as candidates for exercise interventions. Our upcoming work will compare MRI-derived PDFF and muscle contractile volume with muscle strength, physical activity, and computed tomography body composition data.Conclusion
We show that proton density fat fraction increases with age in the muscles of the thigh, particularly in women, and in the hamstring muscles—suggesting these muscles may benefit most from interventions targeting sarcopenia.Acknowledgements
No acknowledgement found.References
1. Goodpaster BH, Park SW, Harris TB, Kritchevsky SB, Nevitt M, Schwartz AV, Simonsick EM, Tylavsky FA, Visser M, Newman AB (2006). The loss of skeletal muscle strength, mass, and quality in older adults: the health, aging and body composition study. The Journals of Gerontology Series A: Biological Sciences and Medical Sciences 61 (10):1059-1064.
2. Ryan A, Nicklas B (1999). Age-related changes in fat deposition in mid-thigh muscle in women: relationships with metabolic cardiovascular disease risk factors. International journal of obesity 23 (2):126.
3. Cree MG, Newcomer BR, Katsanos CS, Sheffield-Moore M, Chinkes D, Aarsland A, Urban R, Wolfe RR (2004). Intramuscular and liver triglycerides are increased in the elderly. The Journal of Clinical Endocrinology & Metabolism 89 (8):3864-3871.
4. Smith AC, Parrish TB, Abbott R, Hoggarth MA, Mendoza K, Chen YF, Elliott JM (2014). Muscle–fat MRI: 1.5 tesla and 3.0 tesla versus histology. Muscle & nerve 50 (2):170-176.
5. Morrow JM, Sinclair CD, Fischmann A, Reilly MM, Hanna MG, Yousry TA, Thornton JS (2014). Reproducibility, and age, body-weight and gender dependency of candidate skeletal muscle MRI outcome measures in healthy volunteers. European radiology 24 (7):1610-1620.
6. Grimm A, Meyer H, Nickel MD, Nittka M, Raithel E, Chaudry O, Friedberger A, Uder M, Kemmler W, Engelke K (2018). Repeatability of Dixon magnetic resonance imaging and magnetic resonance spectroscopy for quantitative muscle fat assessments in the thigh. Journal of cachexia, sarcopenia and muscle 9 (6):1093-1100.
7. Ubaida-Mohien C, Gonzalez-Freire M, Lyashkov A, Moaddel R, Chia C, Simonsick E, Sen R, Ferrucci L (2019). Physical Activity Associated Proteomics of Skeletal Muscle: Being Physically Active in Daily Life May Protect Skeletal Muscle from Aging. Frontiers in Physiology 10:312.
Figures