1541
Texture analysis of T1 and T2 weighted images allows to identify STZ-induced diabetic sarcopenia rats with skeletal muscle fiber atrophy1Department of Radiology, Renmin Hospital of Wuhan University, Wuhan, China
Synopsis
Keywords: Muscle, Muscle
Motivation: Looking for a convenient tool to detect the skeletal muscle fiber atrophy non-invasively in the early stage of diabetic sarcopenia.
Goal(s): This study aims to assess the pathological changes in skeletal muscle of diabetic sarcopenia rats using muscle MR texture analysis.
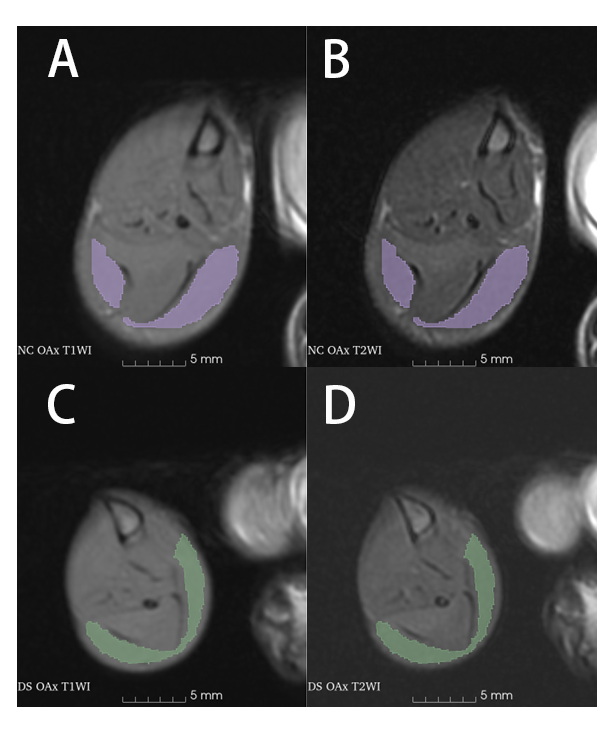
Approach: Type 1 diabetic sarcopenia rat model was conducted via STZ intraperitoneal injection. 2D MR texture features of the gastrocnemius muscle were extracted, followed by histopathological examination using HE stains.
Results: Muscle MR texture features exhibited significant differences between the diabetic sarcopenia group and the control group, and demonstrated a strong correlation with pathological characteristics of skeletal muscle fibers.
Impact: Texture features derived from muscle MR images show potential for non-invasively identifying skeletal muscle atrophy in diabetic sarcopenic rats and providing insights into underlying disease mechanisms.
INTRODUCTION
Sarcopenia, an age-related skeletal muscle disorder characterized by the loss of skeletal muscle mass and function, is recognized as a new complication in elderly patients with diabetes mellitus1,2. Sarcopenia significantly increases the incidence of adverse events such as falls, fractures, physical disability, and significantly contributes to impaired quality of life, as well as increased morbidity and mortality in patients3. Therefore, it is crucial to detect the early skeletal muscle structure changes in patients with diabetes for early detection of sarcopenia, and for subsequent monitor of disease changes and evaluate potential intervention effects. However, there is currently a lack of convenient tools to effectively and non-invasively detect changes in muscle fiber size. Texture analysis (TA) is a potential tool to identify subtle MRI changes, and previous studies have shown that TA based on Ktrans map can identify microarchitectural modifications in diabetic muscles4, but the response of texture analysis to muscle histologic characteristics has not been studied. This study aims to explore the value of skeletal muscle MR texture analysis in evaluating changes in myofiber area and grip strength in rats with diabetic sarcopenia.METHODS
The experimental protocol received approval from the Animal Ethics Committee of our hospital. Twenty SD rats were randomly divided into two groups: the normal control group (n = 10) and the diabetic sarcopenia group (n = 10). After successful induction of type 1 diabetes via Streptozotocin (STZ) intraperitoneal injection, the blood glucose, body weight, and muscle strength of rats in both groups were measured weekly. In the eighth week, axial T1WI and T2WI scans were performed using a 3.0T MR machine to extract 16 two-dimensional texture features of the gastrocnemius muscle. Intraobserver and interobserver agreements for the texture features were assessed using the intraclass correlation coefficient. Independent sample t-tests or Mann-Whitney U tests were used to evaluate differences in body weight, muscle strength, muscle fiber area, muscle fiber perimeter and stability texture features between the two groups. Spearman correlation analysis was employed to assess the relationship between significant differences texture features and the body weight, muscle strength, and muscle fiber features of the rats.RESULTS
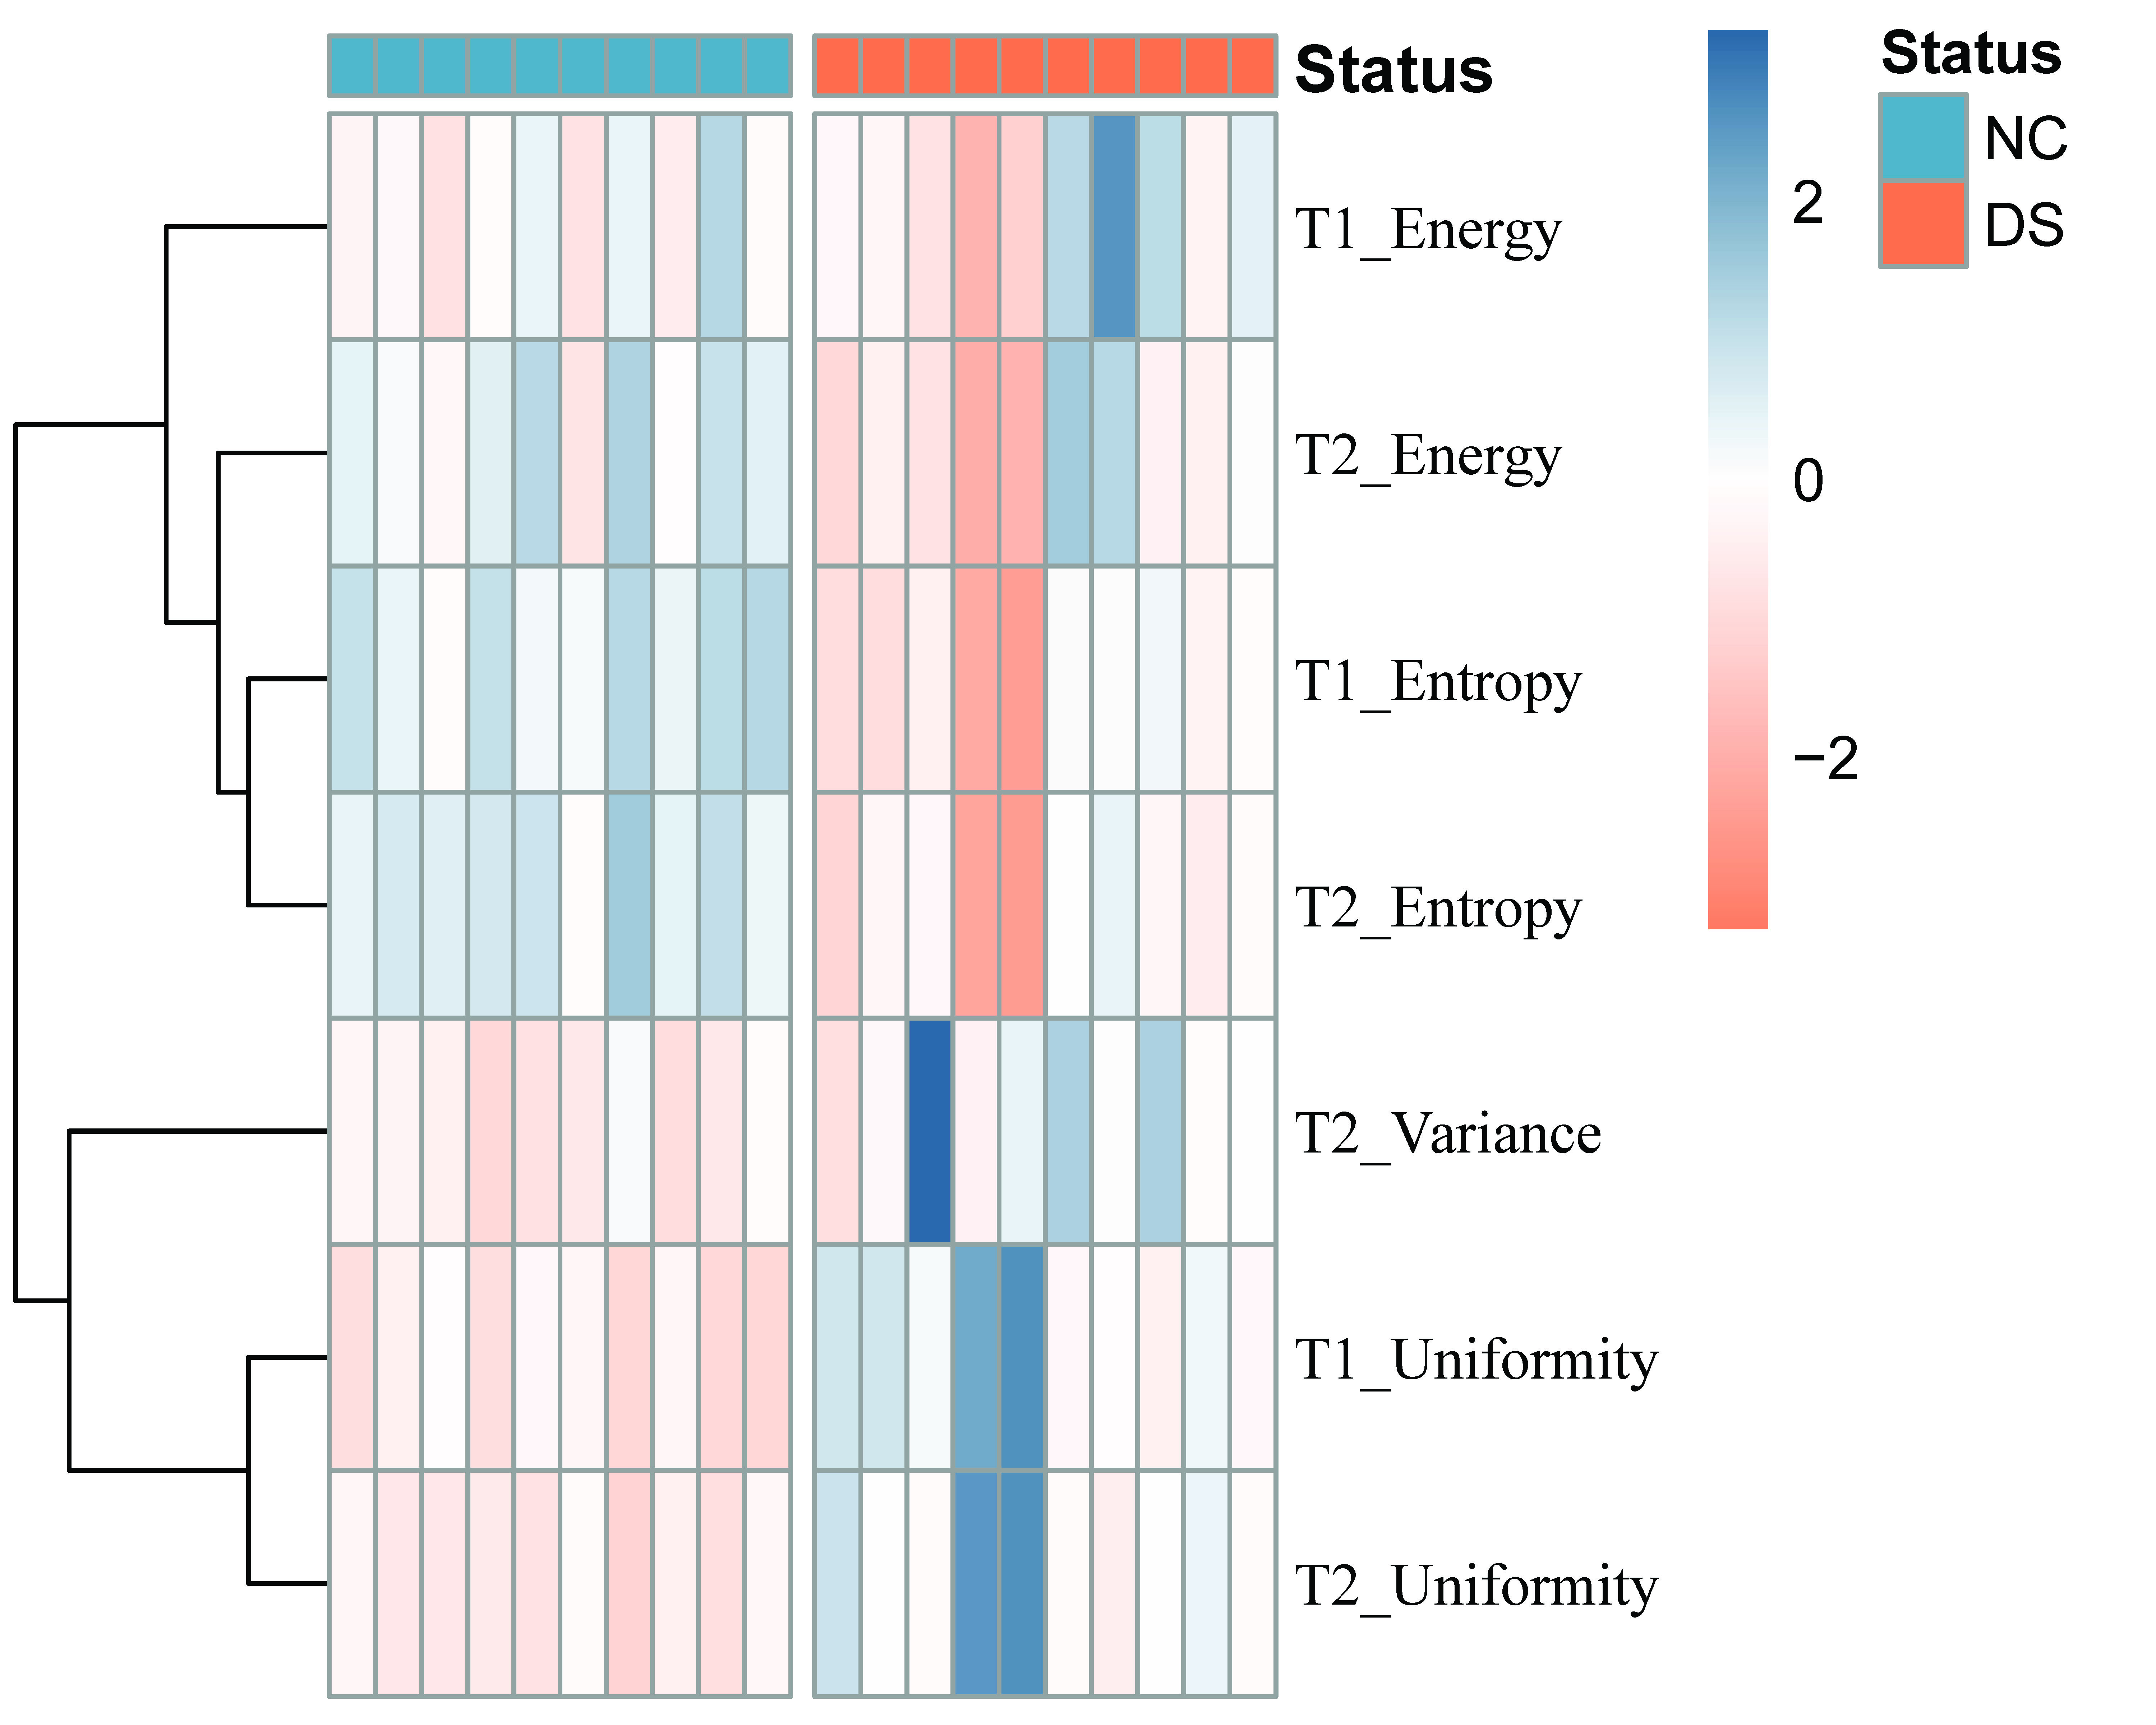
In the eighth week, compared with the normal control group, the rats in the diabetic group lost weight (t=14.830, p<0.0001) and grip strength (t=12.158, p<0.0001), and the area (t=4.911, p<0.0001)and perimeter (t= 5.233, p<0.0001) of skeletal muscle fibers were significantly reduced. Of the 16 extracted muscle texture features, 7 exhibit good stability, with both intraobserver and interobserver ICC values exceeding 0.75. Among them, T1WI_Entropy (t= 4.118; p=0.001) and T2WI_Entropy (Z= -3.479; p=0.001) in the diabetes group were lower than those in the control group, and T1WI_Uniformity (t= -3.456; p=0.003), T2WI_Uniformity (Z= -3.379; p=0.001), and T2WI_Variance (t= -2.523; p= 0.021) were significantly increased compared with the control group. Spearman correlation analysis showed that T1WI_Uniformity was strongly negatively correlated with Weight(ρ=-0.747; p<0.001) and Grip Strength(ρ=-0.727; p<0.001), and T1WI_Entropy was strongly positively correlated with rat Weight(ρ=-0.824; p<0.001) and Grip Strength(ρ=-0.737; p<0.001). T2WI_Uniformity was strongly negatively correlated with Weight(ρ=-0.798; p<0.001), Perimeter(ρ=-0.726; p<0.001) and MaxFeretDiam(ρ=-0.721; p<0.001). T2WI_Entropy was strongly positively correlated with Weight(ρ=0.827; p<0.001), Perimeter(ρ=0.715; p<0.001) and MaxFeretDiam(ρ=0.709; p<0.001).DISCUSSION and CONCLUSION
Uniformity is a measure of the homogeneity of the image array, while entropy indicates the randomness in the image values. We found that, compared with the control group, the T1WI_Uniformity and T2WI_Uniformity of the gastrocnemius muscle in the diabetic sarcopenia group increased, while T1WI_Entropy and T2WI_Entropy decreased. These findings suggest consistent subtle changes in T1WI and T2WI in the gastrocnemius muscle with diabetic sarcopenia. Further correlation analysis demonstrated that T1WI_Uniformity, T2WI_Uniformity, T1WI_Entropy, and T2WI_Entropy had significant moderate to strong correlations with gastrocnemius muscle fiber area, perimeter, and MaxFeretDiam. This indicates that the uniformity and random changes in T1WI and T2WI images of diabetic sarcopenia are significantly related to muscle fiber atrophy. To our knowledge, this is the first report demonstrating that muscle texture characteristics can directly reflect changes in muscle fiber size. In conclusion, texture features based on conventional muscle MR imaging can effectively differentiate between diabetic sarcopenia rats and control rats. These features can also reflect the histologic characteristics of skeletal muscle fibers and changes in grip strength, suggesting the potential to quantify the progression of sarcopenia and measure the therapeutic effects in diabetic patients.Acknowledgements
This project was supported by the National Natura Science Funds of China Grants (81801670) and the Fundamental Research Funds for the Central Universities (2042022kf1102 ).References
1. H, C. et al. The Association Between Sarcopenia and Diabetes: From Pathophysiology Mechanism to Therapeutic Strategy. Diabetes, Metabolic Syndrome and Obesity Volume 16, 1541–1554 (2023).
2. Mori, H. et al. High prevalence and clinical impact of dynapenia and sarcopenia in Japanese patients with type 1 and type 2 diabetes: Findings from the Impact of Diabetes Mellitus on Dynapenia study. J Diabetes Investig 12, 1050–1059 (2021).
3. Sayer, A. A. & Cruz-Jentoft, A. Sarcopenia definition, diagnosis and treatment: consensus is growing. Age Ageing 51, (2022).
4. Liu, B. et al. Evaluation of microvascular permeability of skeletal muscle and texture analysis based on DCE-MRI in alloxan-induced diabetic rabbits. Eur Radiol 31, 5669–5679 (2021).
Figures