1540
Stimulated phase contrast motor unit MRI to assess recovery of fatigued muscle as a novel therapeutic response biomarker1Translational and clinical research institute, Newcastle University, Newcastle-upon-Tyne, United Kingdom, 2Department of Neuroradiology, Royal Victoria Infirmary, Newcastle-upon-Tyne, United Kingdom, 3Northern Medical Physics and Clinical Engineering, Newcastle upon Tyne Hospitals NHS Foundation Trust, Newcastle-upon-Tyne, United Kingdom, 4Wellcome Centre for Mitochondrial Research, Newcastle University, Newcastle-upon-Tyne, United Kingdom
Synopsis
Keywords: Muscle, Neuroscience
Motivation: Current biomarkers for serial functional muscle assessments (eg., for therapeutic response assessment) are limited by sensitivity, spatial resolution, and coverage.
Goal(s): We aimed to utilise the high spatial resolution offered by recently developed phase contrast motor unit MRI (PC-MUMRI) techniques to identify potential biomarkers.
Approach: We prospectively trialled a novel PC-MUMRI fatigue and recovery paradigm before and after a 12-week exercise intervention in seven participants with genetic mitochondrial disorders.
Results: Time-to-half-maximum of PC-MUMRI recovery reduced from a mean of 254 (+/- 109) seconds to 137 (+/- 41) seconds following the intervention. This was not statistically significant (p = 0.074).
Impact: We have developed and tested a novel therapeutic response biomarker for muscle-based intervention based on measuring recovery of stimulated muscle twitch velocities following fatigue. This may address problems with spatial resolution, sensitivity, or coverage associated with previously reported biomarkers.
Introduction
Muscle function monitoring is crucial for evaluating therapeutic regimes. Traditional methods include biopsy or electromyography which can be invasive, sample small volumes, and suffer difficulties in repeatedly targeting the same area. Dynamic 31-P MRS has been used as an alternative, though spatial localisation is limited.1Here, we present novel methodology and preliminary results from trialling Phase Contrast Motor Unit MRI (PC-MUMRI)2 to assess recovery of twitch velocities following fatigue in participants with mitochondrial myopathies before and after an exercise programme.
Methods
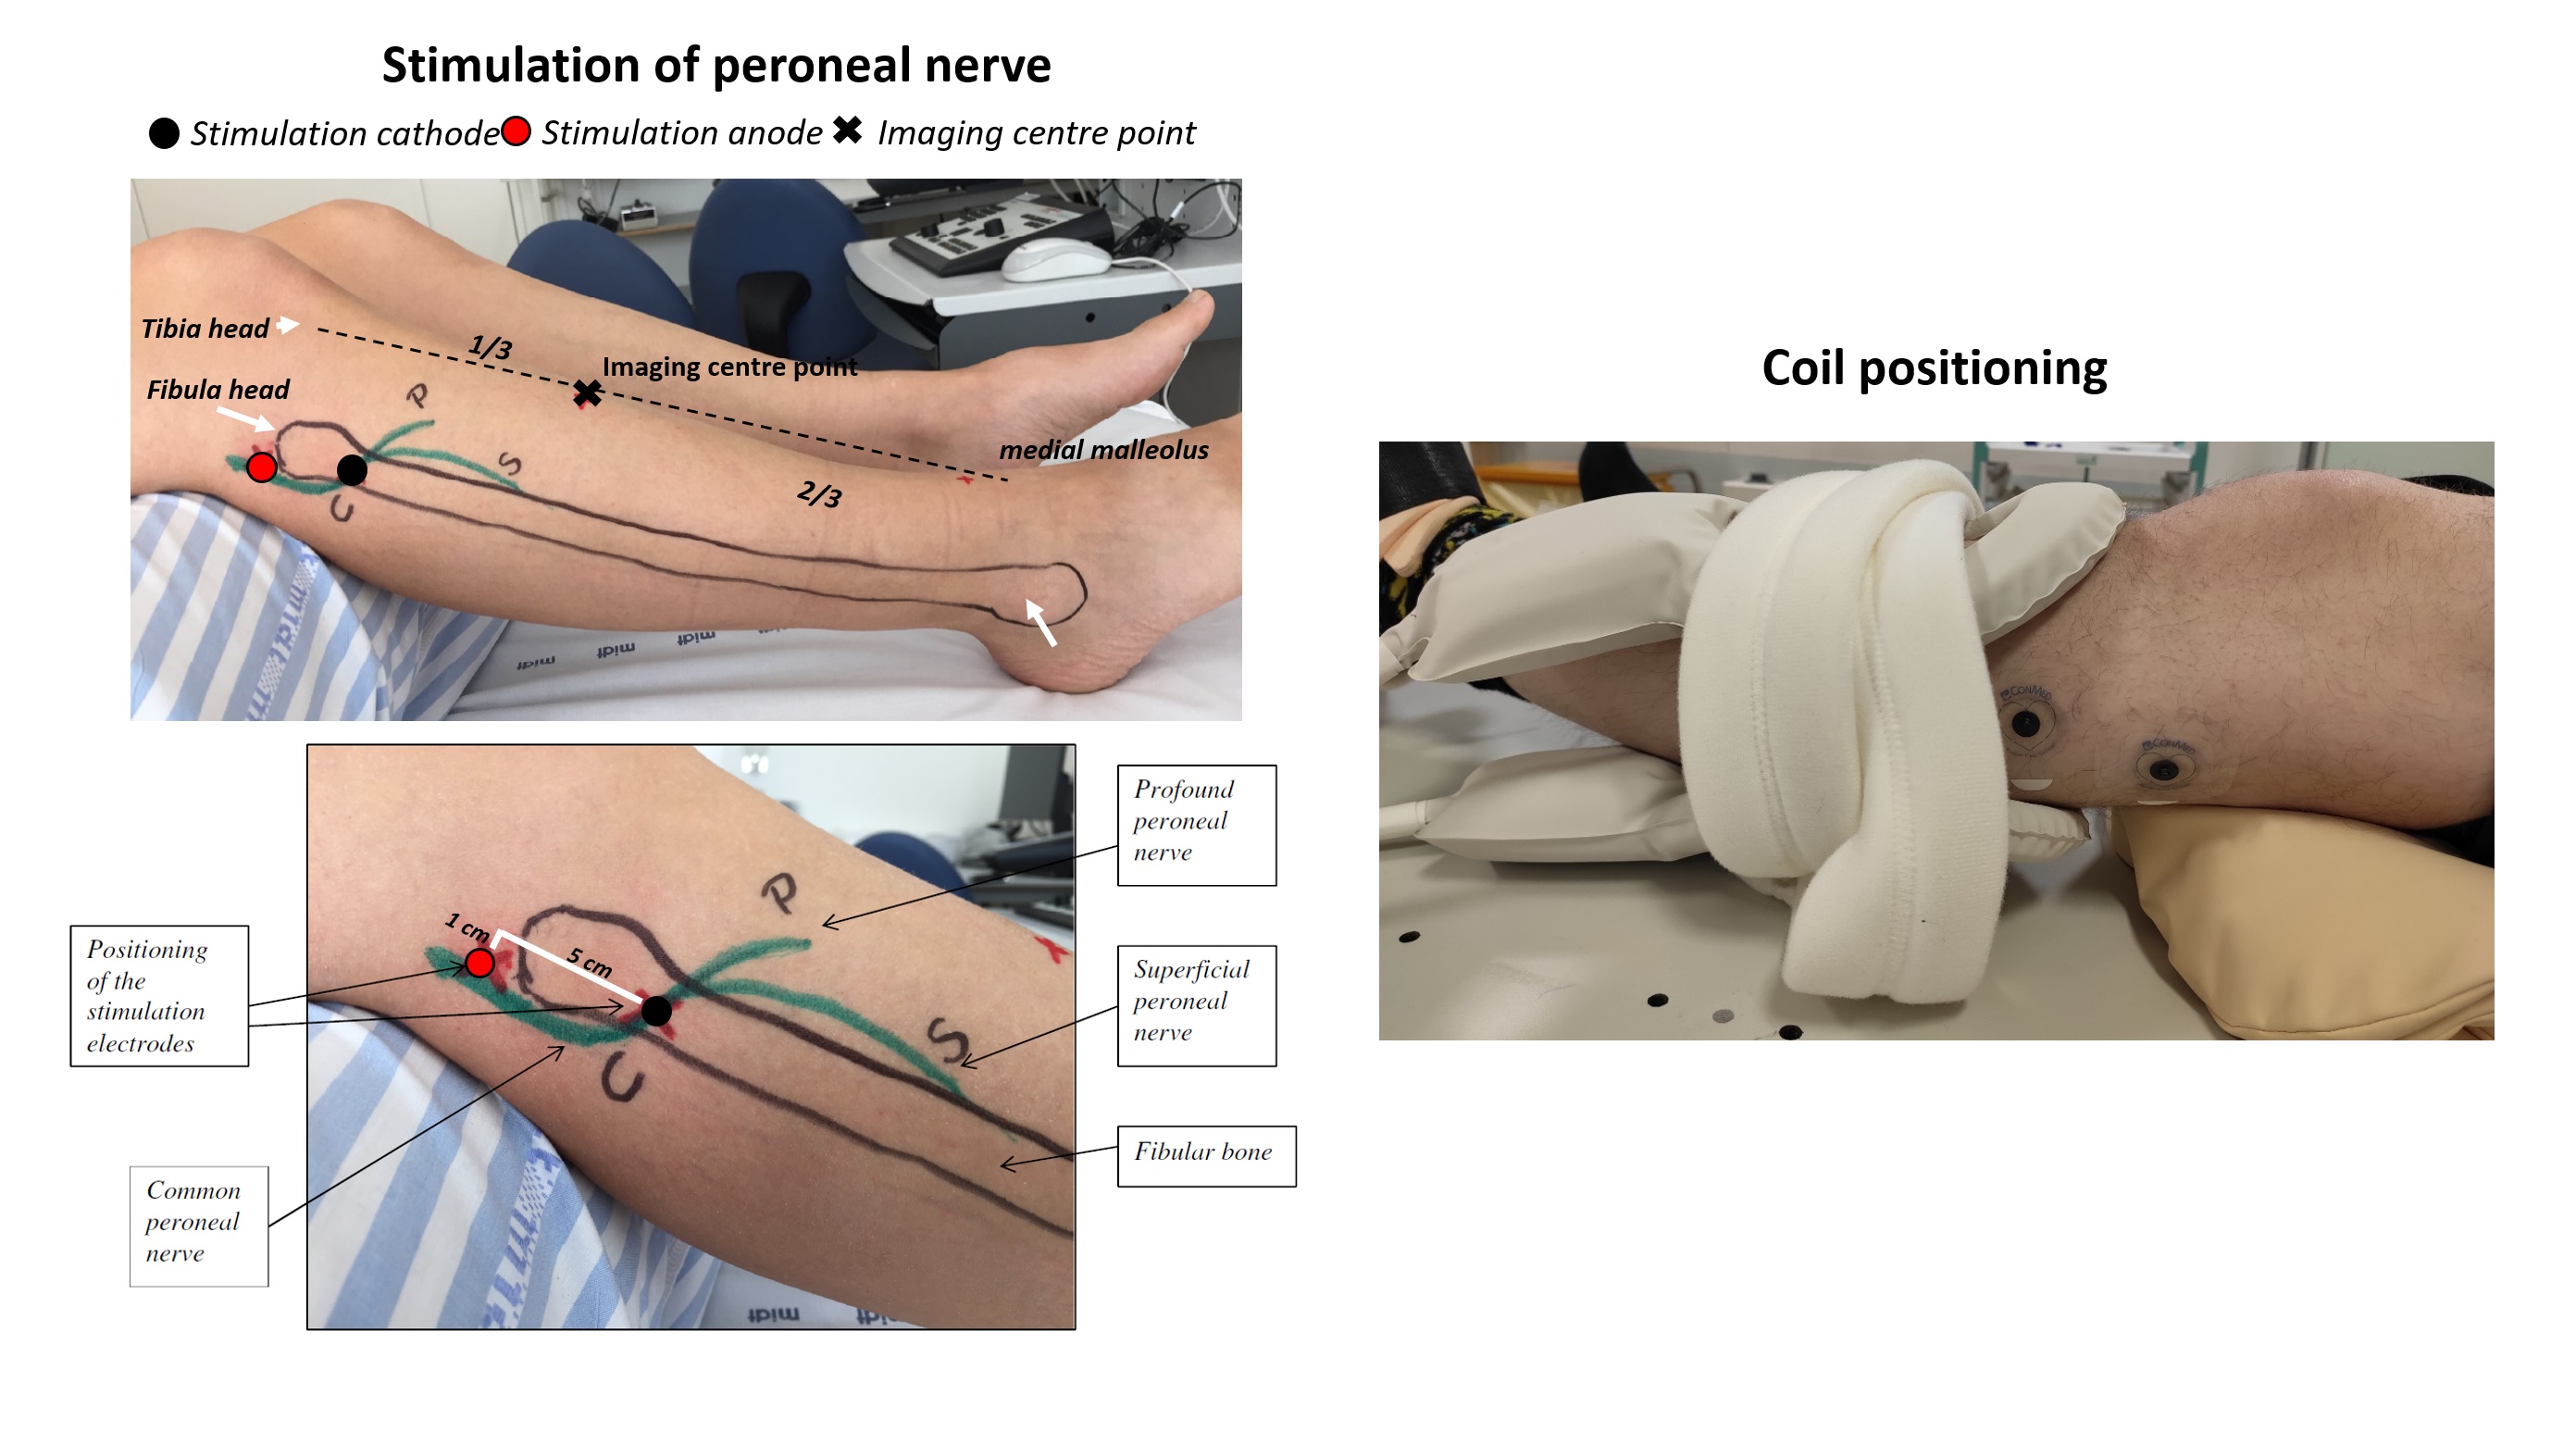
Data AcquisitionLeft lower leg muscles of seven participants with primary mitochondrial myopathies were scanned in a Philips Intera Achieva 3.0T system and two elliptical surface coils wrapped around the calf (Figure 1). Feet were secured in an MR compatible force plate calibrated for maximum voluntary contraction (MVC) during dorsiflexion.
Surface anatomy guided electrode placement for common peroneal nerve stimulation (Figure 1). Muscle twitch was measured by timing image acquisition to a gating pulse from the stimulator.
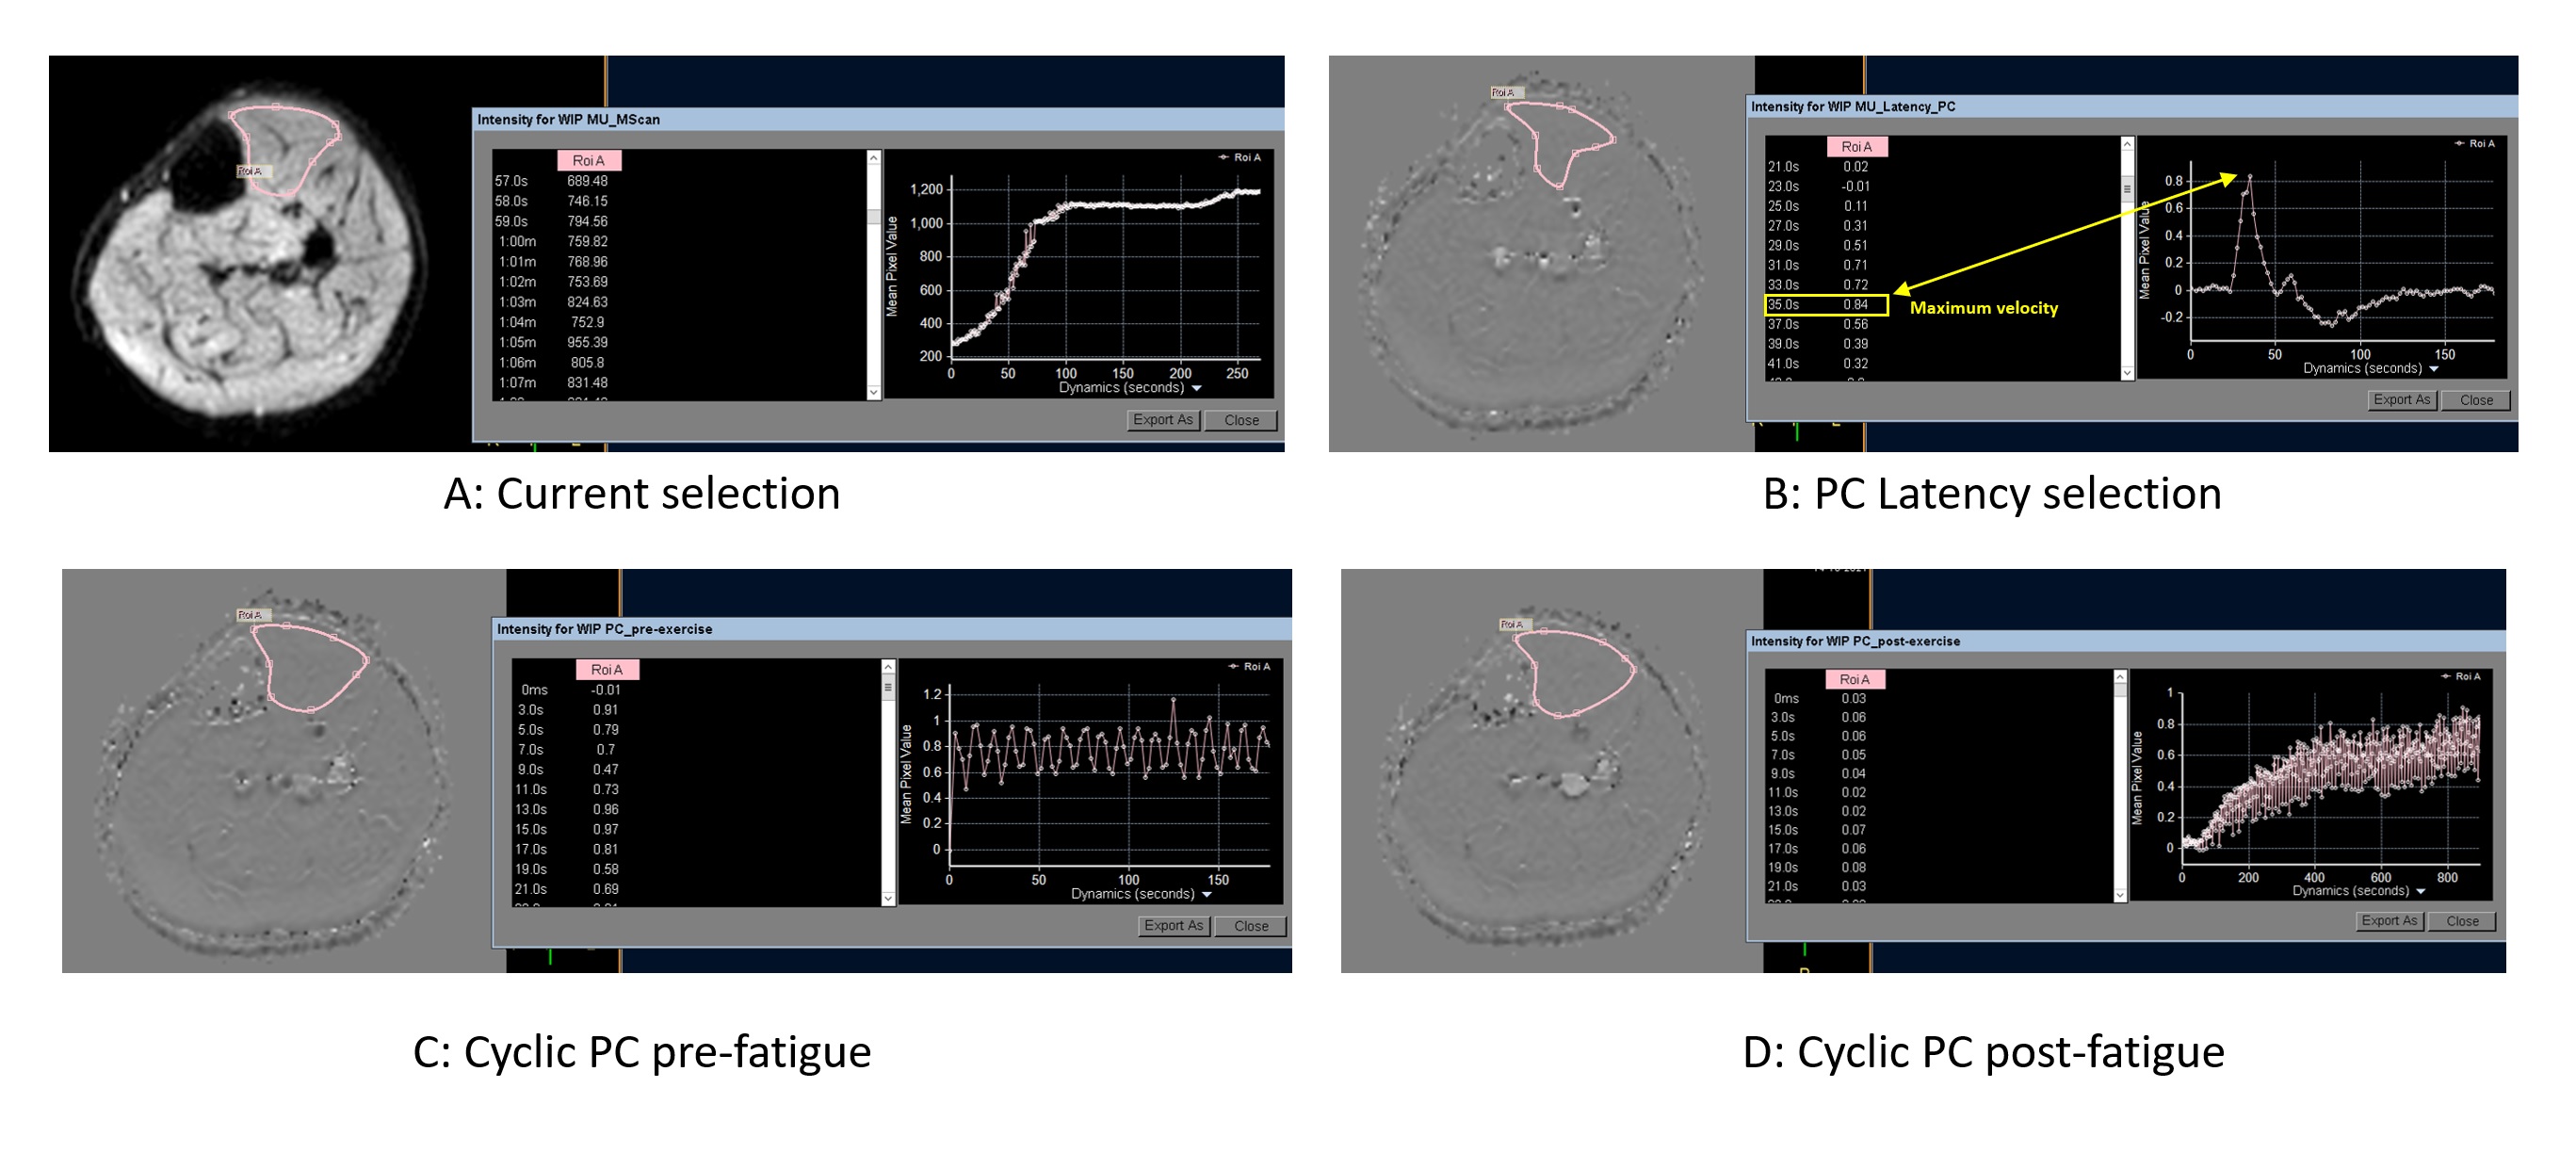
The current required for visible twitch in tibialis anterior (TA) was identified, and the minimum current for sufficient motor unit activation (~67% of maximum signal drop-out) was optimised using acquisitions with incrementally stimulated pulsed gradient spin-echo (PGSE) sequences (field of view: 160x160; in-plane resolution: 1.5x1.5mm; slice thickness: 8mm; slices: 2; TR: 1000ms; TE: 36ms; b: 20 s/mm2) – Figure 2.
This current was fixed for incrementally increasing latencies to identify the latency of the twitch peak velocity, using a 2D EPI-readout bipolar PC sequence (field of view: 160x160; in-plane resolution: 1.5x1.5mm; slice thickness: 8mm; TR/TE: 500/10ms; VENC = 6 cm/s). To account for possible drift in the latency for peak velocity, a cyclic PC-MUMRI acquisition was utilised to acquire slices at the 5 latencies (in 5ms steps) centered on the peak identified in the incremental scan (Figure 2).
Participants were instructed to dorsiflex with maximum force to fatigue (defined at inability to maintain dorsiflexion over 50% of their MVC). Participants were then instructed to relax, and the cyclic PC-MUMRI acquisitions commenced and repeated for 20 minutes.
Data Analysis
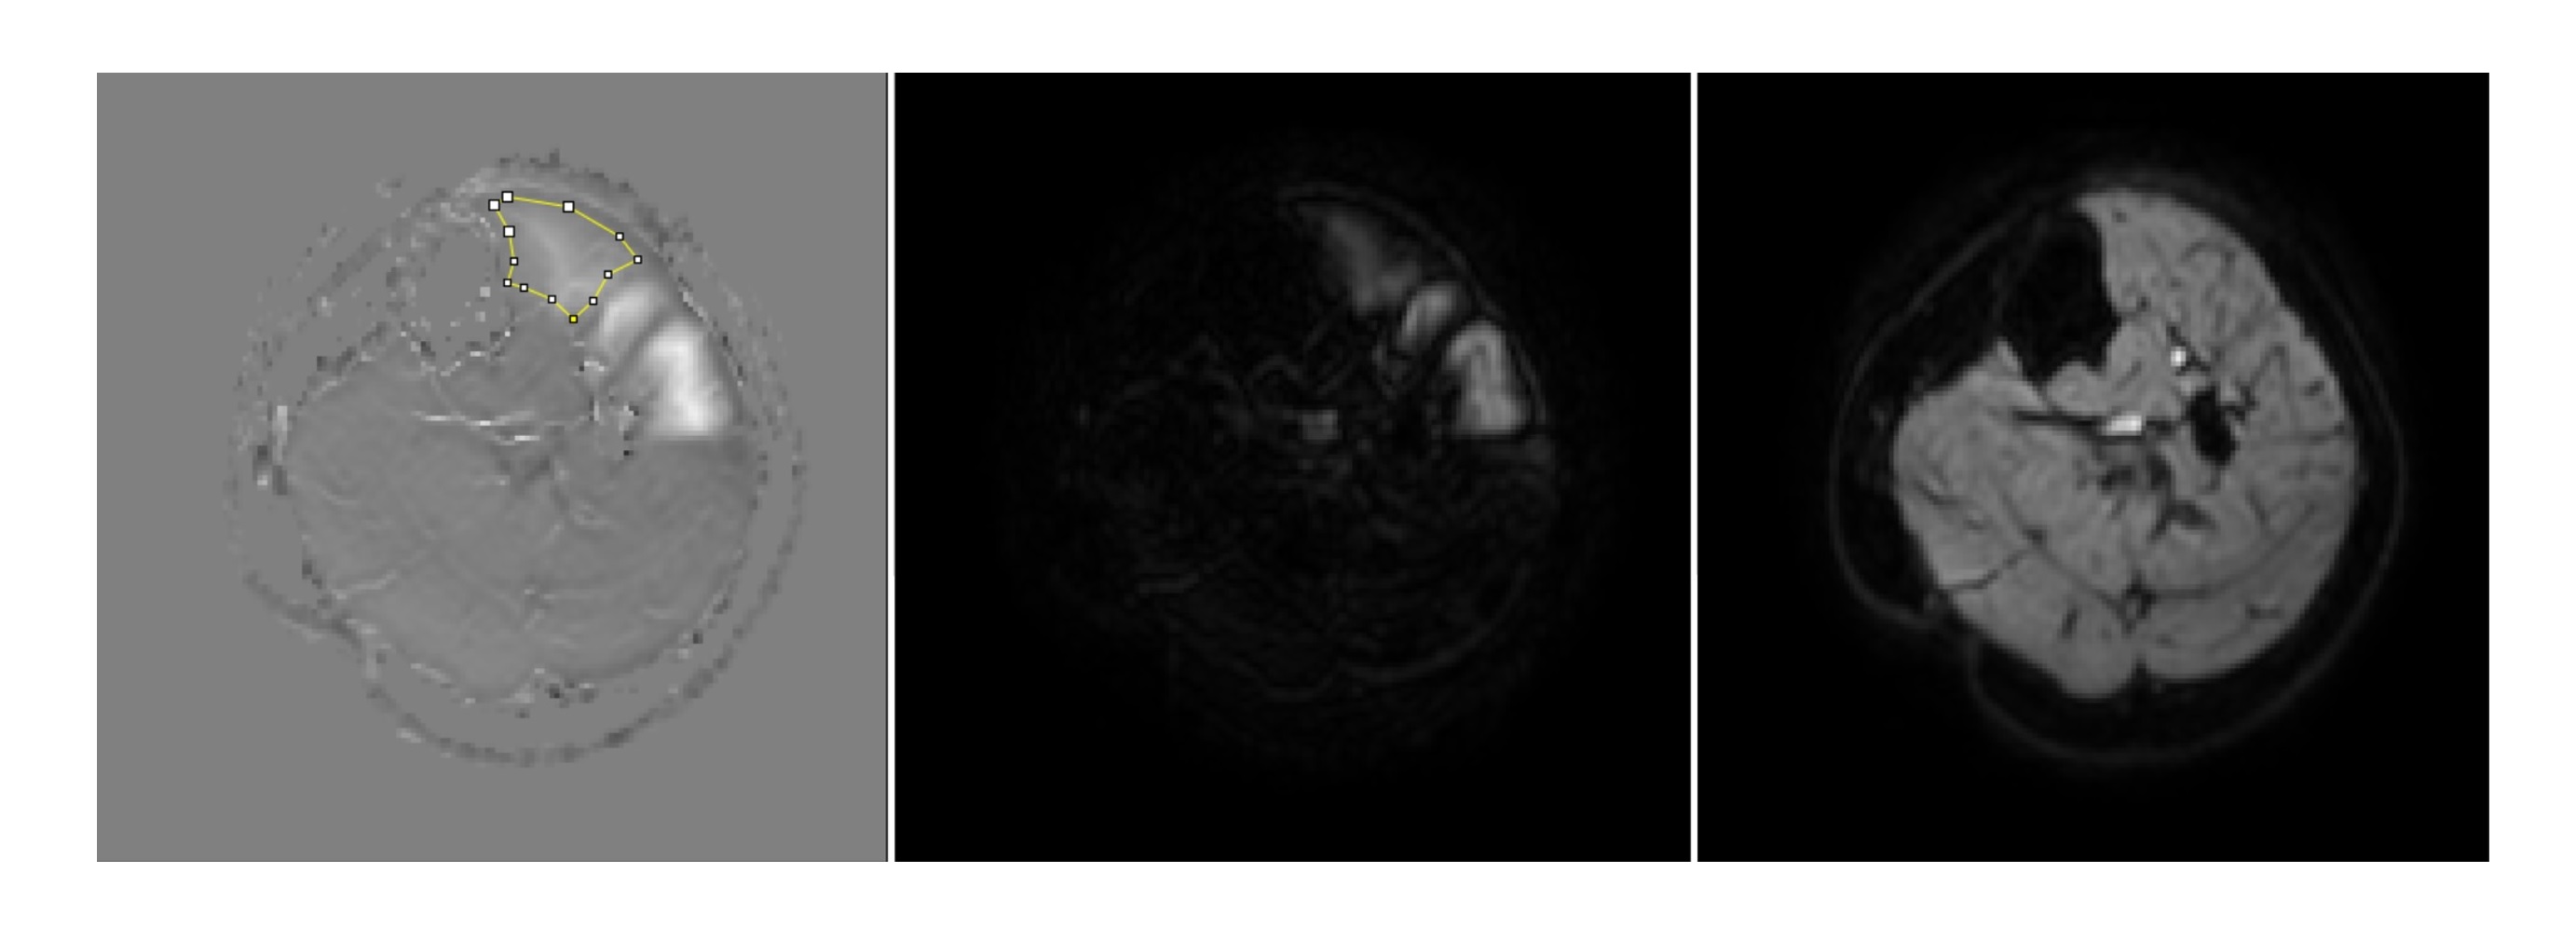
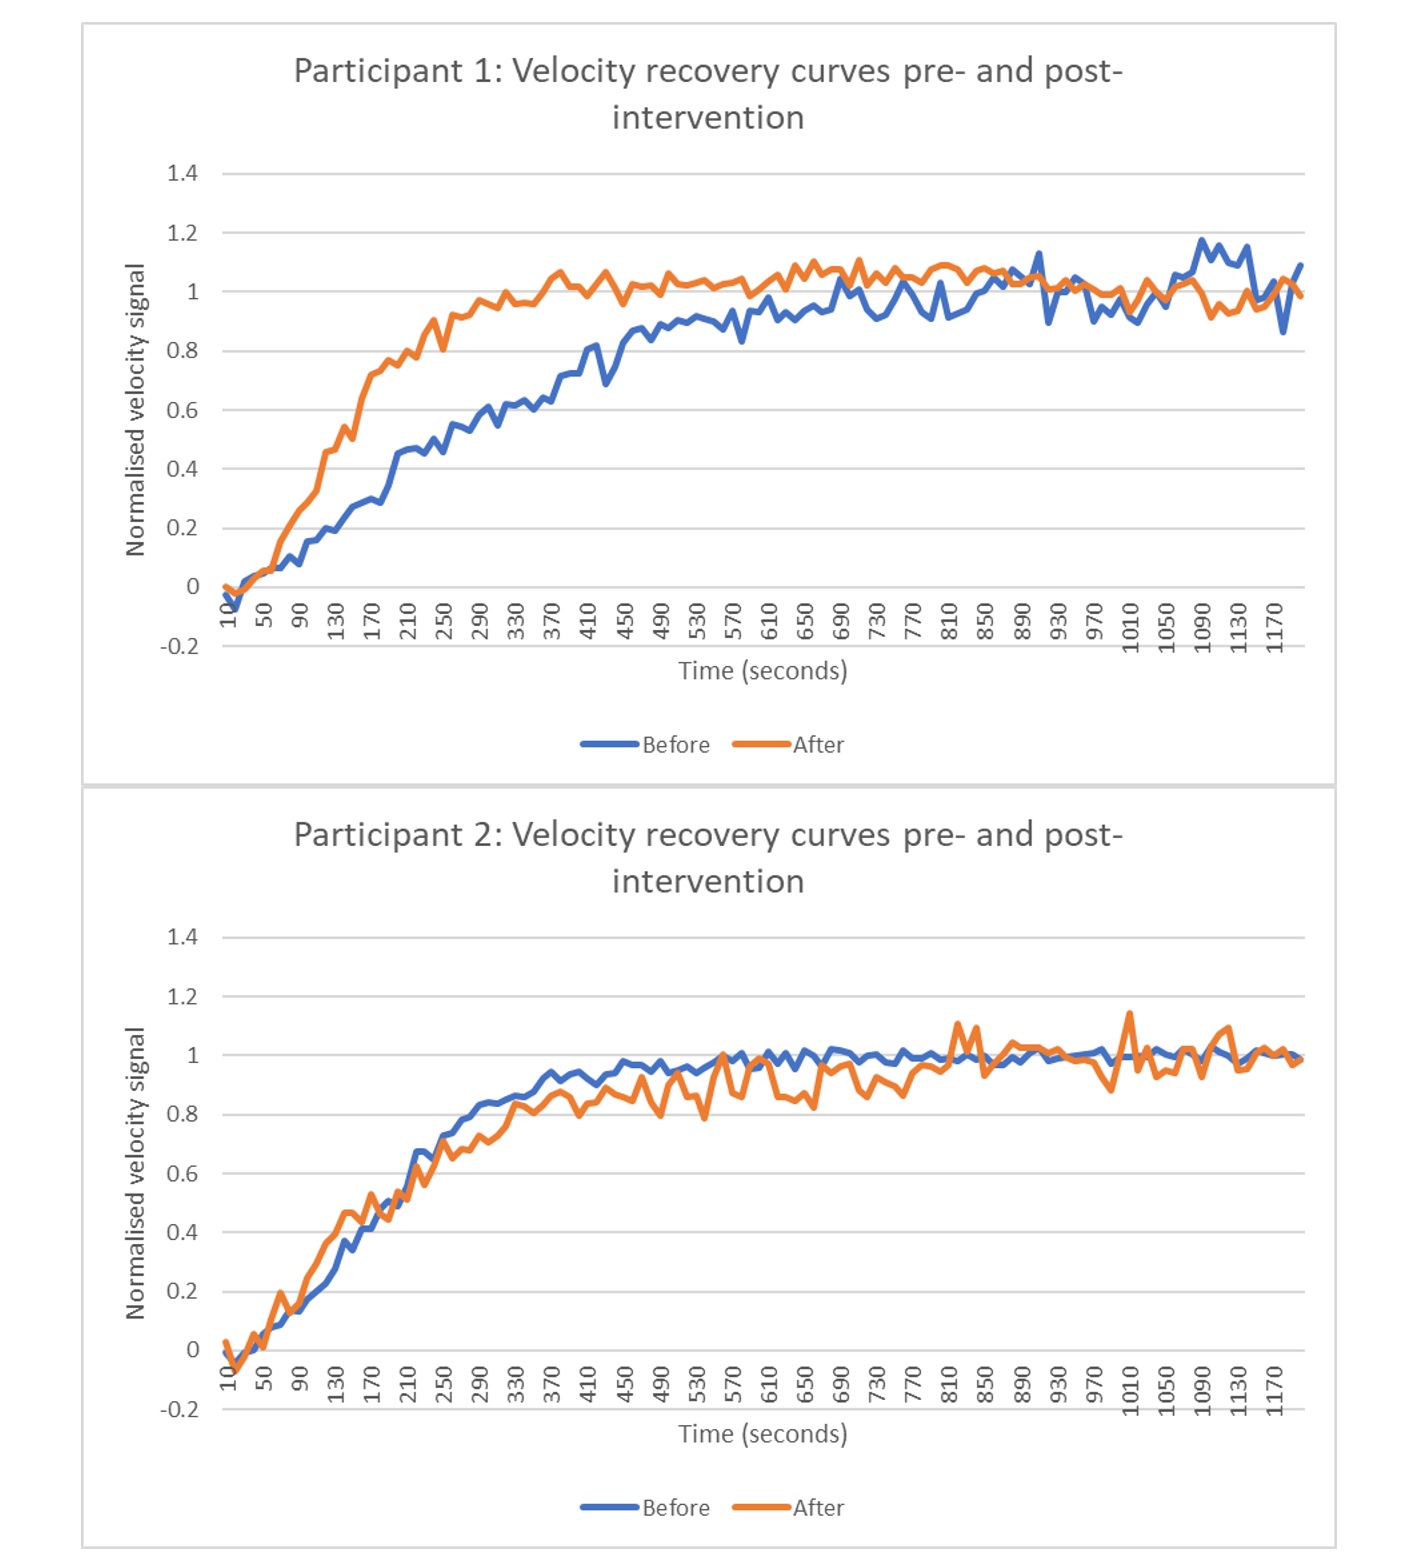
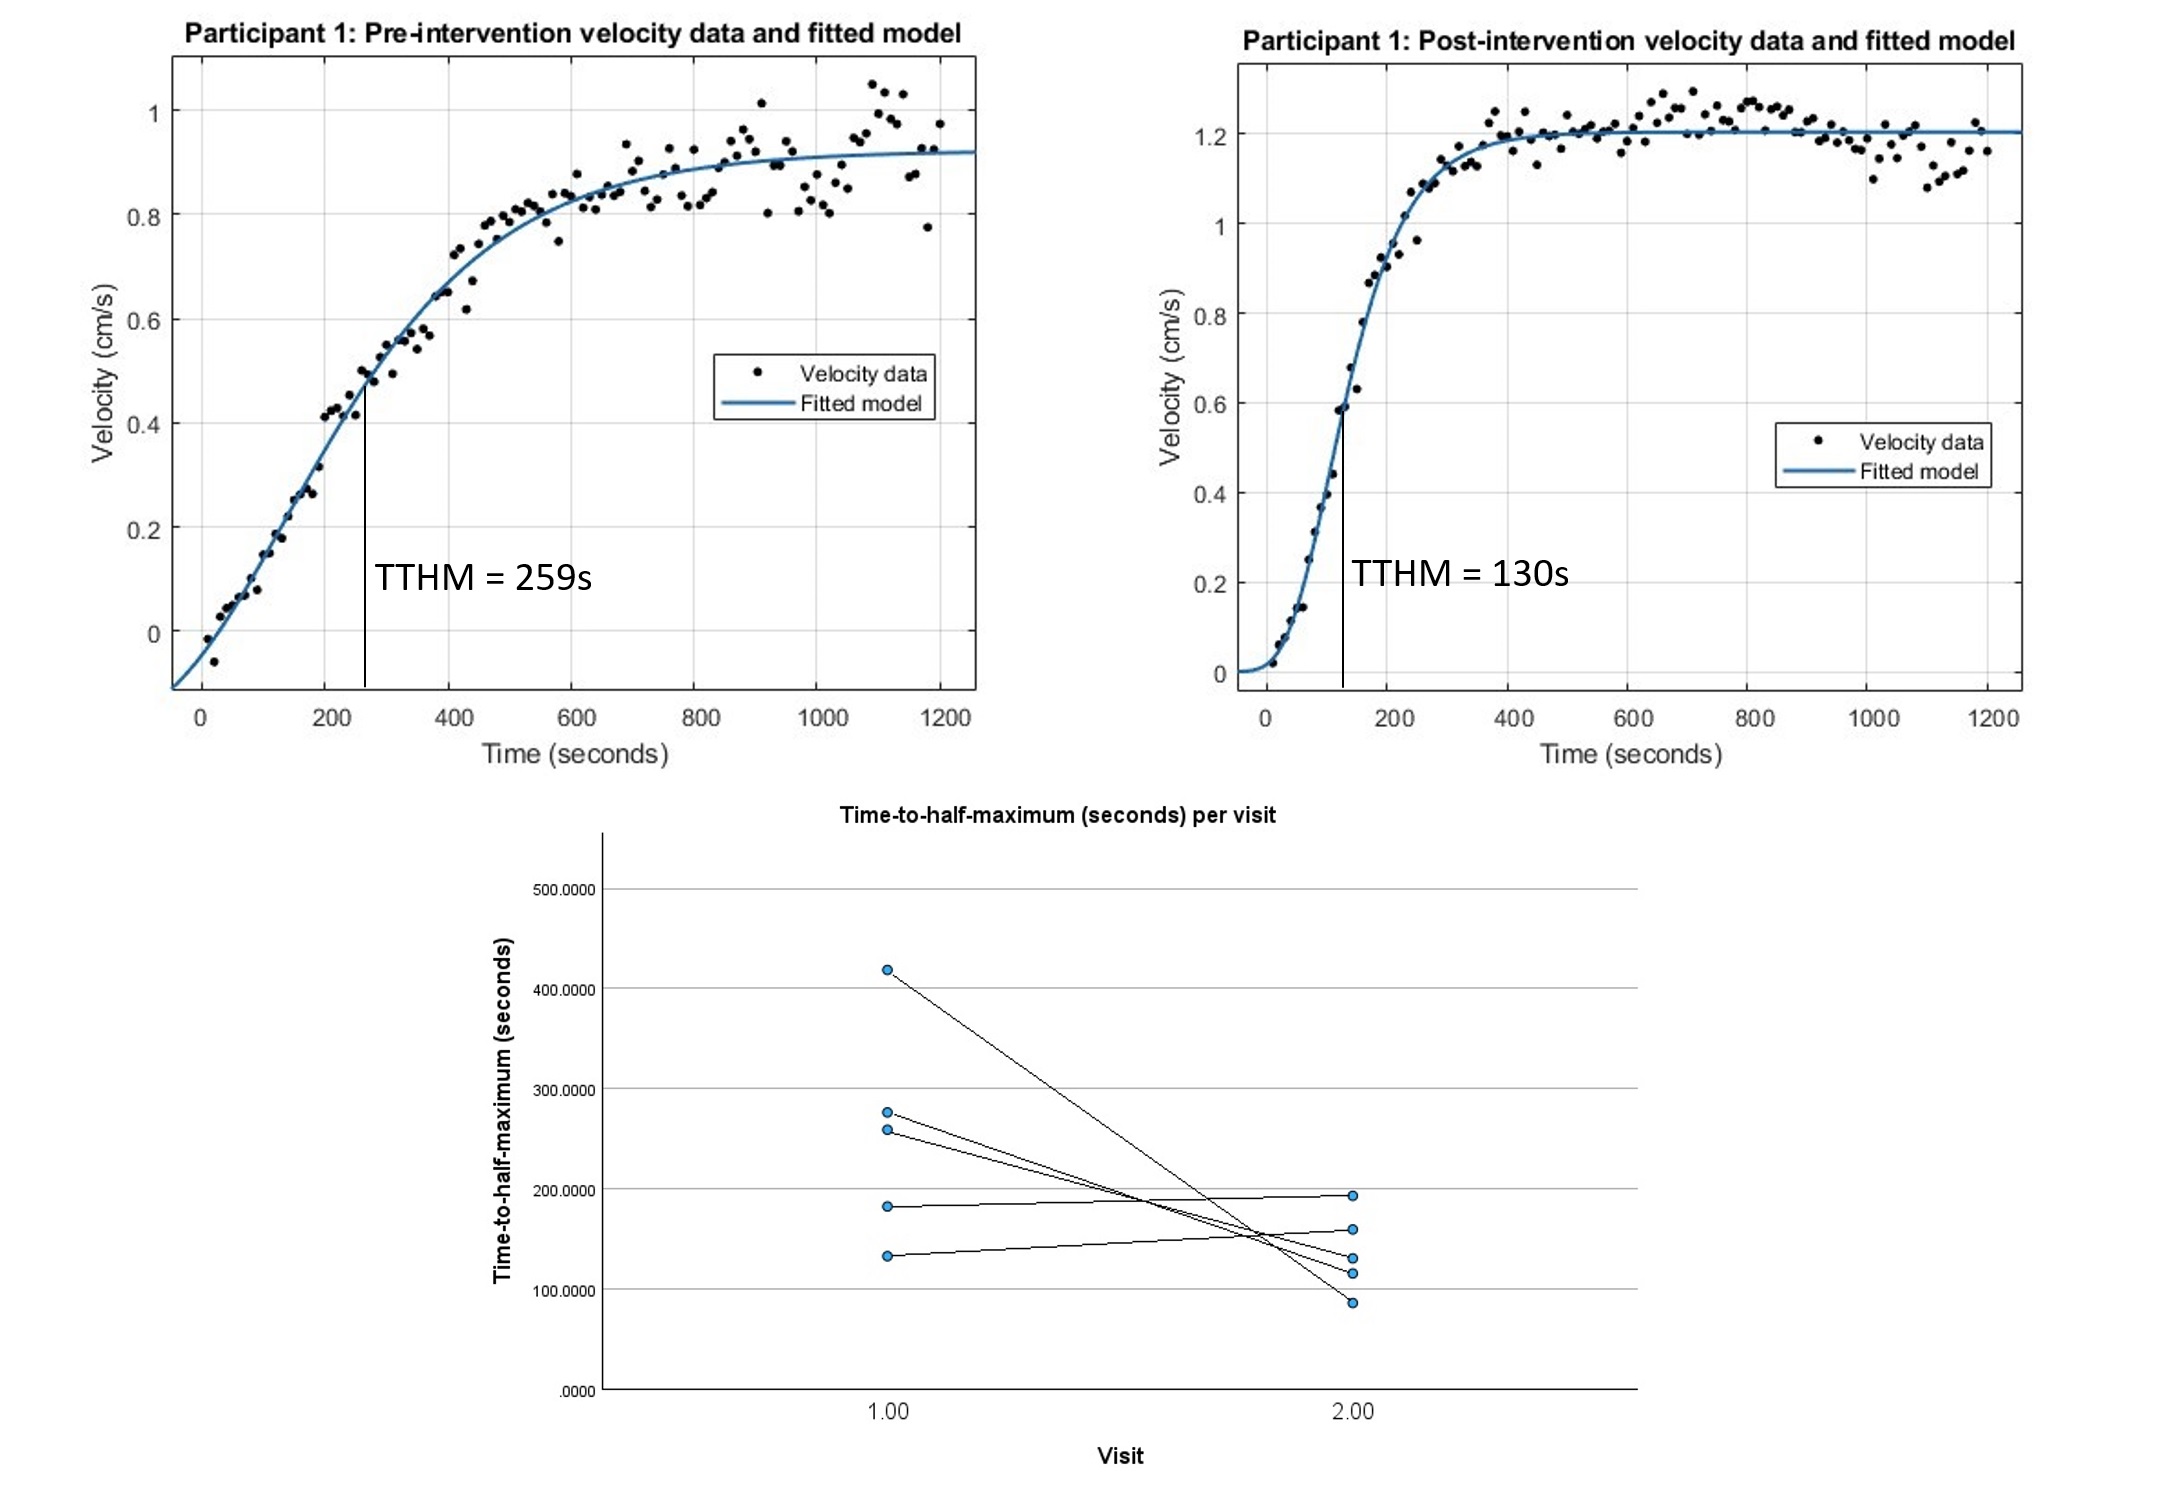
Magnitude, phase, and magnitude-of-phase images were reconstructed (Figure 3). An in-house Matlab script registered all images to the first magnitude dynamic, as this provided the best anatomical contrast. Tibialis anterior (TA) was segmented in FIJI to calculate mean velocity per dynamic. The peak mean velocity per cycle was extracted for subsequent analysis. This data was used to produce recovery curves which demonstrated a sigmoid profile (Figure 4). Empirical modelling identified a 5-parameter Gompertzian model (mean adjusted R-squared: 0.94, Figure 5).
The model used was: $$ y = ae^{-e^{-b-c(x-d)}} - g $$
Time-to-half-maximum (TTHM) was extracted: $$ TTHM = \frac{-(b+ln(-ln(\frac{a+g}{2a})-c*d)}{c} $$
Exercise Programme
Scans were acquired before and after a 12-week resistance training programme. Fortnightly monitoring and adjustment was performed remotely by mitochondrial specialist clinical researchers.
Statistics
Paired t-tests measured the statistical significance of differences in TTHM following the exercise programme.
Results
Nine participants (mean age 59.6 +/- 10.7) were recruited with two lost to follow-up. Two further participants had suboptimal data (likely failure of electrical stimulation) at either baseline or follow-up and were excluded.For the remaining participants (N=5), the TTHM reduced from a mean of 254 (+/- 109) seconds to 137 (+/- 41) seconds following the exercise programme (Figure 5). This difference was not statistically significant (p = 0.074).
Discussion
PC-MUMRI allows mapping of muscle recovery from fatigue for all voxels within a slice. This enables retrospective complex regional analysis which has not previously been possible by MRI or any other method. Consistent recovery curves have been identified which follow a Gompertzian trend, in keeping with neurophysiological models of motor unit recruitment.3We have extracted the time-to-half-maximum from these curves as an intuitive biomarker sensitive to change. The difference was not statistically significant when tested in participants with primary mitochondrial myopathies, likely due to low sample size (N=5) and varying individual response to the exercise programme.
The trend towards a faster recovery following a 12-week exercise intervention is consistent with improved mitochondrial function.
Conclusion
Phase contrast motor unit MRI (PC-MUMRI) can be used to measure recovery of muscle twitch velocities from fatigue. This data can be mapped on a voxel-wise basis with good spatial resolution allowing for complex regional analyses that have not previously been possible. We have identified a model for the recovery curves that allows extraction of the time-to-half-maximum which appears to be sensitive to changes in muscle function following an exercise intervention. There is more work to be done to optimise and validate this approach, but the early results presented here demonstrate significant potential.Acknowledgements
The authors are grateful to all participants who dedicated their time to take part in the study. We are also grateful for the help of the radiographers: Tim Hodgson, Dorothy Wallace and Louise Ward for scanning the participants. PMM participants were recruited through the Wellcome Centre for Mitochondrial Research Patient Cohort: A Natural History Study and Patient Registry (REC Ref: 13/NE/0326) and the Newcastle NHS Highly Specialised Services (HSS) for rare mitochondrial disorders.References
1. Meyerspeer M, Boesch C, Cameron D, et al. 31P magnetic resonance spectroscopy in skeletal muscle: Experts’ consensus recommendations. NMR Biomed. 2021;34(5):e4246. doi:10.1002/NBM.4246
2. Birkbeck MG, Heskamp L, Schofield IS, et al. Whole Muscle and Single Motor Unit Twitch Profiles in a Healthy Adult Cohort Assessed With Phase Contrast Motor Unit MRI (PC-MUMRI). Journal of Magnetic Resonance Imaging. Published online 2023. doi:10.1002/JMRI.29028
3. Fisher LE, Tyler DJ, Triolo RJ. Optimization of selective stimulation parameters for multi-contact electrodes. J Neuroeng Rehabil. 2013;10(1):25. doi:10.1186/1743-0003-10-25/FIGURES/5
Figures