1539
Quantifying tissue water compartmentation for assessing specific histopathological changes in dystrophic skeletal muscle1Neuromuscular Investigation Center, Institute of Myology, Paris, France, 2Université Paris Est Créteil, INSERM, IMRB, EnvA, Créteil, France
Synopsis
Keywords: Muscle, Relaxometry, Multi-component water T2
Motivation: Developing an objective measure of specific histopathological changes in the skeletal muscle in Duchene Muscular Dystrophy.
Goal(s): To investigate distinct histopathological changes in dystrophic muscle by assessing histological tissue water compartmentation in vivo.
Approach: A cohort of Golden Retriever Muscular Dystrophy (GRMD), carrier, and wild type dogs underwent quantitative MRI. Tissue water compartmentation, microvascular fraction (f) and extracellular volume (ECV) were assessed using multi-component water-T2 relaxometry, Intravoxel Incoherent Motion (IVIM) and T1 maps acquired before and after gadolinium (Gd) injection.
Results: In GRMD, ECV, f, long-T2 fraction and main-T2 value were increased. Carrier dogs displayed mild non-significant abnormalities.
Impact: Evaluating tissue water compartmentation in GRMD provided histopathologic specificity, distinguishing vascular from parenchymal changes in dystrophic muscle. The ability to assess histopathologic changes non-invasively will drastically improve our understanding of the disease evolution, treatment strategies and, ultimately, therapeutic development.
Introduction
Quantitative MRI (qMRI) plays an important role in the assessment and management of Duchene Muscular Dystrophy (DMD) patients. While fat-fraction maps quantify the degree of muscle-fat replacement, providing an accurate marker of the disease progression, water-T2 (T2H20) maps reveal the presence of tissue injury and inflammation1. However, despite its sensitivity, T2H2O is not specific to the underlying histopathological changes in the tissue. In this retrospective study, on top of FF and T2H2O, we investigate specific histopathological changes in the skeletal muscle of Golden Retriever Muscular Dystrophy (GRMD) dogs, by assessing tissue water compartmentation via multi-component water-T2 relaxometry, Intravoxel Incoherent Motion (IVIM) and extra cellular volume (ECV). While the first year of GRMD aligns well with the first 10 to 15 years of DMD, GRMD presents much less muscle-fat replacement2, which makes it particularly suited in the context of this study.Methodology
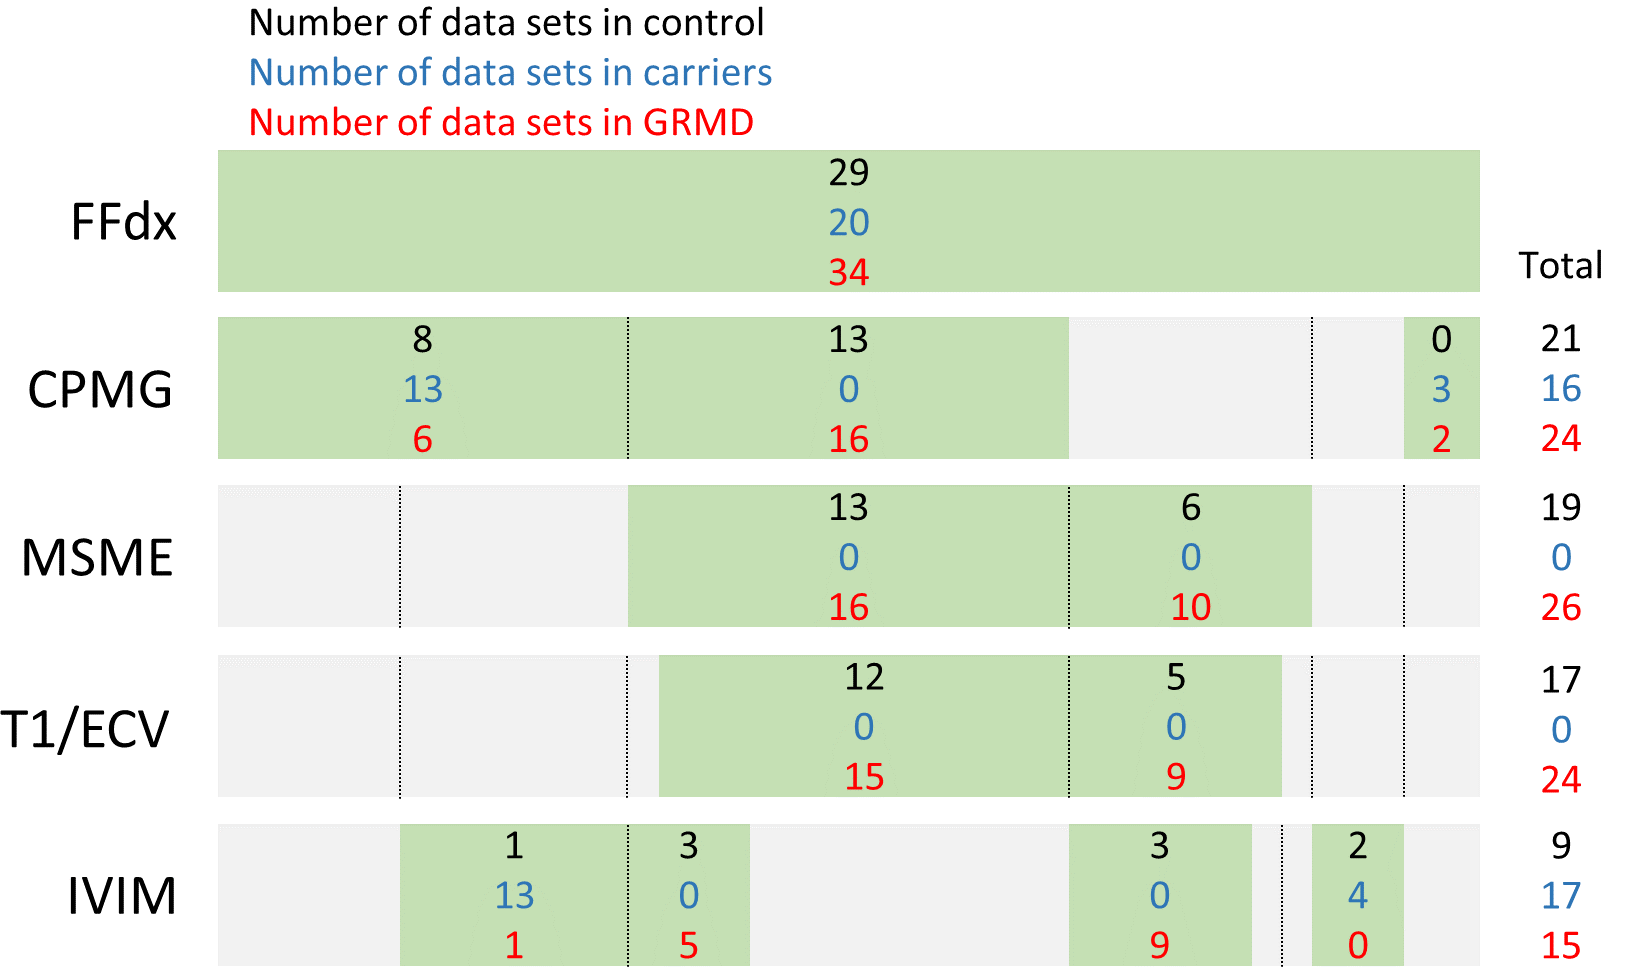
The study cohort consisted of 34 GRMD, 20 carrier and 29 wild type dogs. Dogs’ pelvic limbs were examined in a 3T SIEMENS PRISMAfit system, under isoflurane anesthesia. A 15-CH birdcage transceiver coil was used for RF transmission and signal detection. Maps of FF, T2H2O and T1 were obtained using 2pt-Dixon (TEs = 2.75 and 3.95, TR = 10 ms, FA = 3°, resolution = 1.0x1.0x5.0 mm3, 64 slices), MSME3 (inter-echo-spacing = 9.5 ms, Nb of echoes = 17, TR = 3 s, resolution = 1.4x1.4x5 mm3, 7 slices, slice gap = 15 mm) and Modified Look-Locker Inversion Recovery (MOLLI)4, respectively. Apparent diffusion coefficient (ADC) and microvascular fraction (f) maps were obtained using IVIM5 (fat-suppressed single-shot spin-echo EPI: TE = 66 ms, TR = 4 s, BW/px = 1185 Hz, b-values = 0, 400 and 900 s/mm2, 3 diffusion gradient directions, resolution = 1.35x1.35x5 mm3, 5 slices). Multi-component water-T2 was assessed in the right tibialis cranialis muscle using a fat-suppressed single-voxel (1x1x4 cm3) Carr-Purcell-Meiboom-Gill (CPMG) sequence6 (inter-echo-spacing = 2 ms, echo-train-length = 200), and a bi-exponential decay model, s(t) = A1.exp(-t/T21) + A2.exp(-t/T22). Blood samples were acquired from the dogs at the moment of exam for assessing hematocrit levels (H) and T1 maps were acquired at the level of the pelvic limbs and the heart before and after Gadolinium (Gd) injection. From this T1 data, ECV maps were calculated using ECV = (1-H).ΔR1muscle/ΔR1blood. Regions of interest were drawn in the tibialis cranialis muscles and the mean value of each parameter map was calculated for data set. Kruskal-Wallis tests were performed for evaluating differences between groups. Post-hoc pair-wise comparisons were done using the Mann-Whitney test with Bonferroni correction for multiple comparisons. The null hypothesis was rejected for every p-value less than 0.05.Results
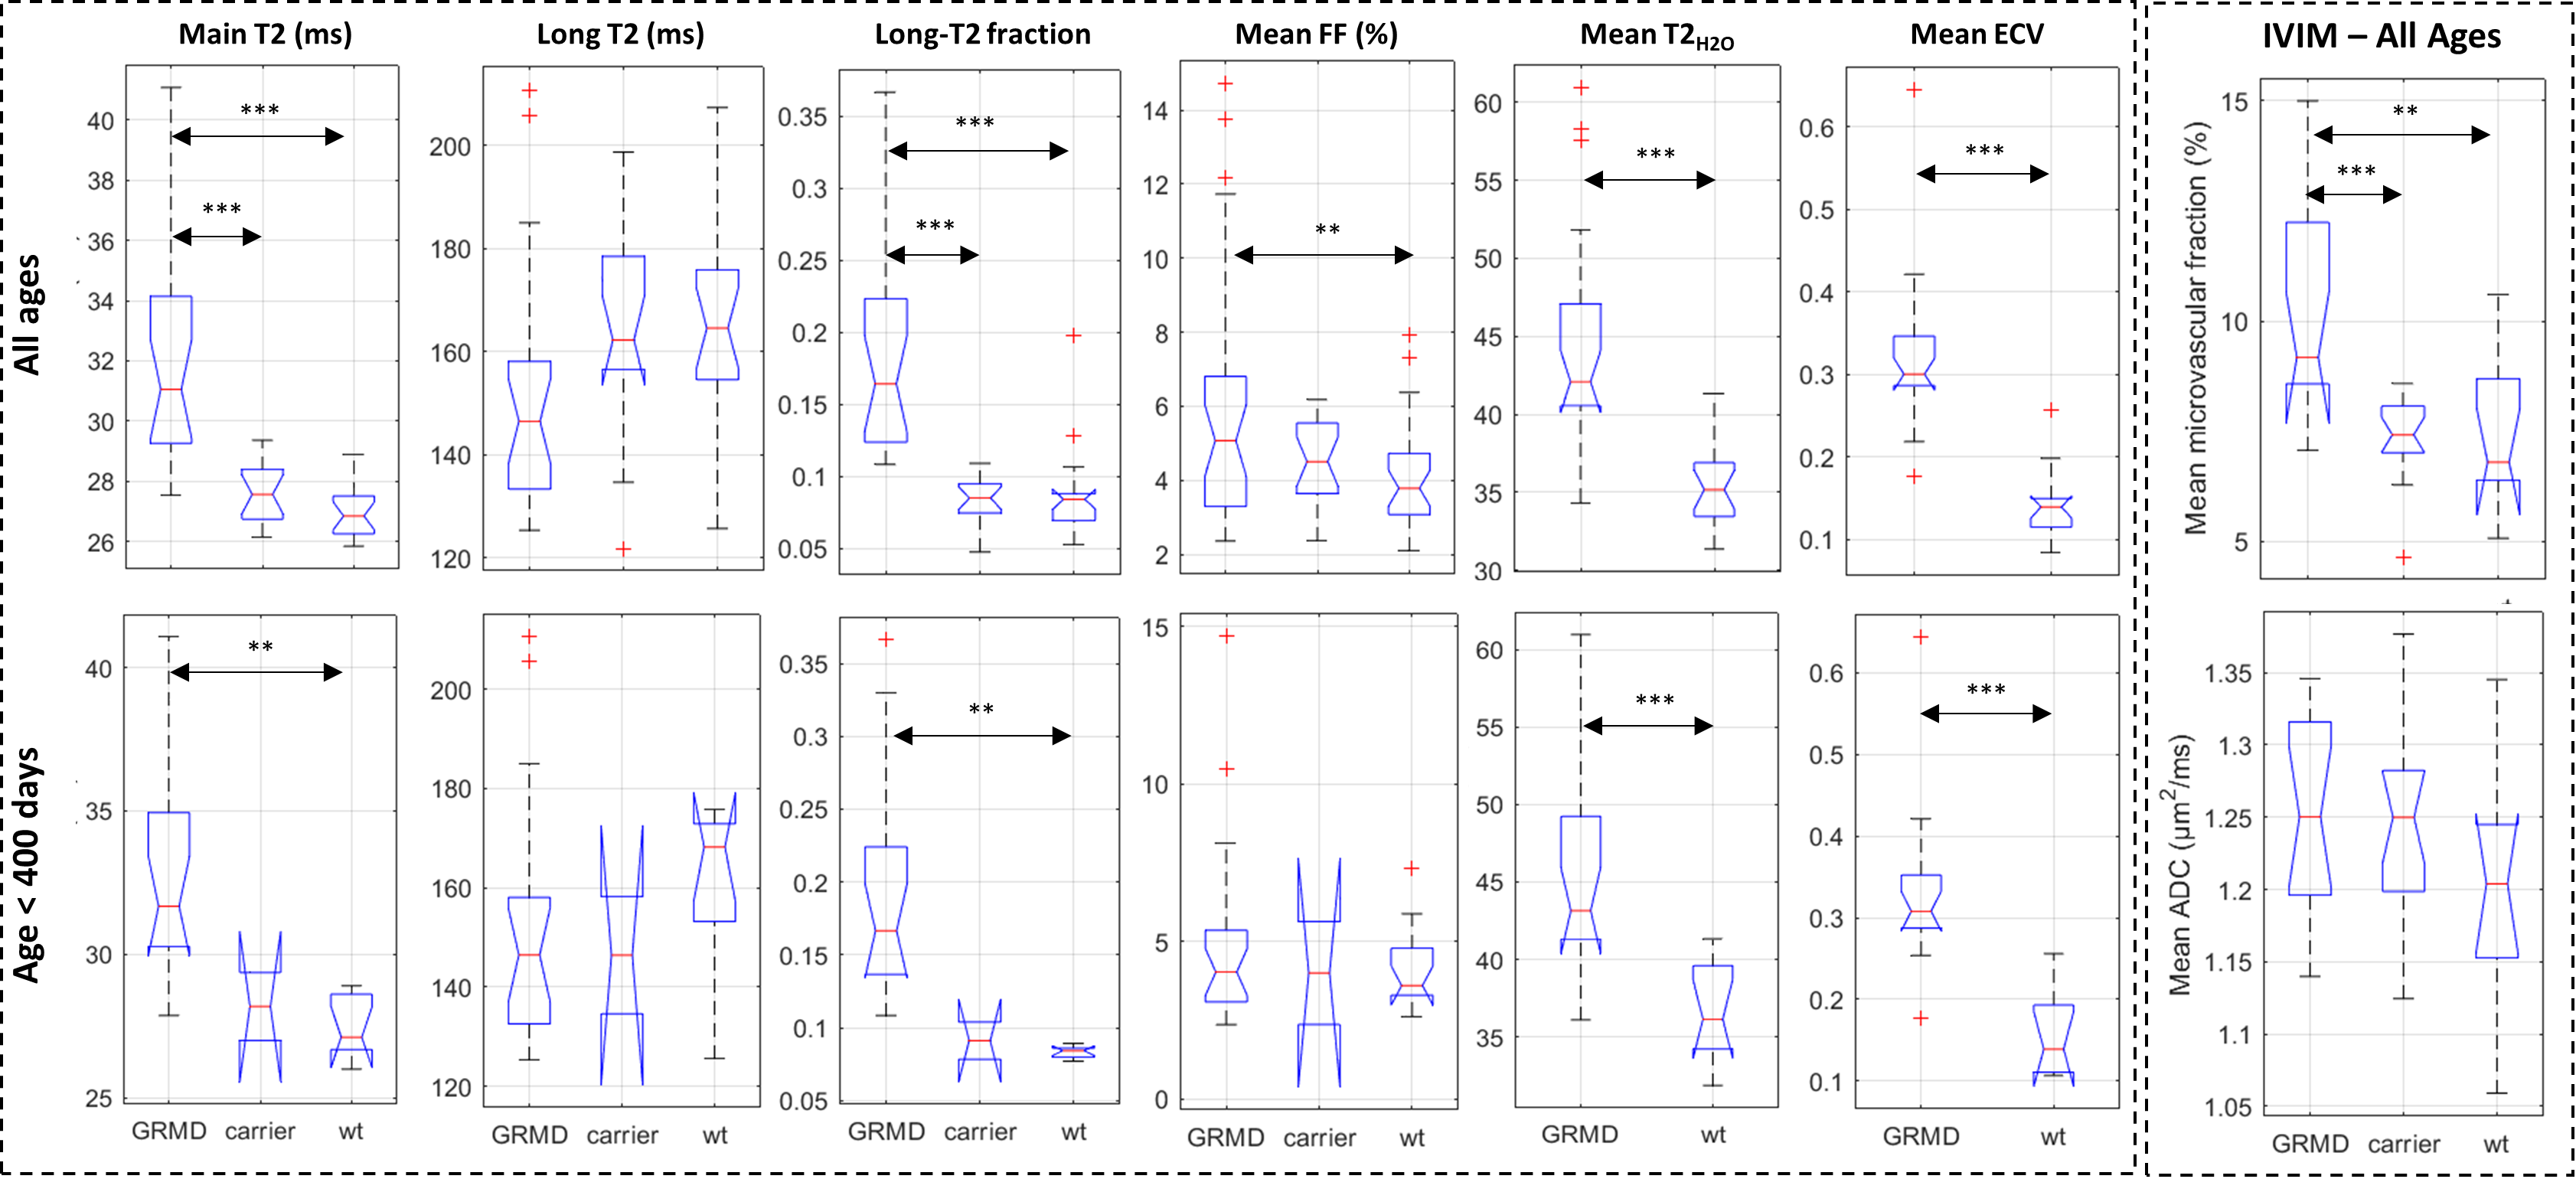
The results are presented in figure 2. The T2H2O and FF were abnormally elevated in GRMD (p < 0.001). When restricting the analysis to dogs under one year of age, T2H2O remained elevated in GRMD (p < 0.001), but FF was no longer different from wild type. In carriers, FF was not significantly different from GRMD or wild type dogs. In addition, in GRMD, the 1st water component’s T2, T21, the relative fraction of the 2nd water-T2 component, A2, and the microvascular fraction, f, were significantly higher than in carrier and wild type dogs (p<0.001). When restricting the analysis to dogs under one year of age, both T21 and A2 remained significantly higher than in wild type dogs (p<0.01). ADC was not significantly different between groups. In GRMD, ECV was abnormally elevated independently of the age range (p<0.001).Discussion and Conclusion
Previous studies in healthy skeletal muscle suggested that the 1st and 2nd components characterizing the T2 relaxation of water represent the parenchymal and vascular compartments, respectively6,7. From this perspective, our CPMG results in GRMD suggest that there is an increase in the vascular compartment (higher A2) and in the transendothelial exchange rate (leading to lower T22), both suggestive of inflammation. Additionally, the abnormally elevated T21 indicates an increased water content in the parenchymal space tissue necrosis and remodeling. The IVIM and ECV results further supported the CPMG findings, showing abnormally elevated vascular and extracellular spaces in GRMD, respectively. Although the age distributions were different between groups, all the observed differences for the extracted parameters were still significant when restricting the groups to a similar age range. Carrier dogs are expected to present mild symptoms8, and indeed this is suggested by the FF data and the CPMG data in dogs under one year of age. Multi-component water T2 seems to provide some level of histopathologic specificity, which could allow distinguishing vascular from parenchymal changes in the skeletal muscle tissue.Acknowledgements
No acknowledgement found.References
1. Wary, C. et al. Splitting of Pi and other 31P NMR anomalies of skeletal muscle metabolites in canine muscular dystrophy. NMR Biomed. 25, 1160–1169 (2012). 2. Kornegay, J. N. The golden retriever model of Duchenne muscular dystrophy. Skelet. Muscle 7, 1–21 (2017). 3. Azzabou, N., de Sousa, P. L., Araujo, E. C. A. & Carlier, P. G. Validation of a generic approach to muscle water T2 determination at 3T in fat-infiltrated skeletal muscle. J. Magn. Reson. Imaging 41, 645–653 (2015). 4. Marty, B. et al. Bloch Equations-Based Reconstruction of Myocardium T1 Maps from Modified Look-Locker Inversion Recovery Sequence. PLoS One 10, e0126766 (2015). 5. Le Bihan, D. et al. Separation of diffusion and perfusion in intravoxel incoherent motion MR imaging. Radiology 168, 497–505 (1988). 6. Araujo, E. C. A., Fromes, Y. & Carlier, P. G. New Insights on Human Skeletal Muscle Tissue Compartments Revealed by In Vivo T2 NMR Relaxometry. Biophys. J. 106, 2267–2274 (2014). 7. Le Rumeur, E., De Certaines, J., Toulouse, P. & Rochcongar, P. Water phases in rat striated muscles as determined by T2 proton NMR relaxation times. Magn Reson Imaging 5, 267–272 (1987). 8. Fornander, F. et al. Quantitative Muscle MRI and Clinical Findings in Women With Pathogenic Dystrophin Gene Variants. Front. Neurol. 12, (2021).Figures