1537
Reproducibility of in vivo measurements of carnosine in muscles with 1H-MR spectroscopy1Medical Physics Group, University Clinic and Outpatient Clinic for Radiology, University Hospital Halle (Saale), Halle (Saale), Germany, 2Halle MR Imaging Core Facility, Medical Faculty, Martin-Luther-University Halle-Wittenberg, Halle (Saale), Germany
Synopsis
Keywords: Muscle, Spectroscopy
Motivation: Due to its pH-buffering function in skeletal muscle, carnosine reveals muscle fibre specific concentrations and is therefore suitable as a marker for the evaluation of muscle fibre composition in pathologies.
Goal(s): This study examines the reproducibility of muscle carnosine quantitation with 1H-MRS, and is further targeting to adjust scan parameters for future clinical studies.
Approach: 1H-MRS was applied in healthy volunteers to evaluate carnosine lateralization in leg muscles as well as quantitation reproducibility and precision in various parameter settings.
Results: Muscular carnosine can be measured with a sufficient precision and reproducibility in less than four minutes and in small voxels.
Impact: 1H-MRS enables reliable in vivo measurements of carnosine in skeletal muscles in clinical protocol settings, which is important for the assessment of disease- and age-related as well as myodegenerative changes in muscle fibre composition.
INTRODUCTION
Among others, carnosine (β-alanyl-L-histidine) acts as a pH buffer in skeletal muscles1. Consequently, anaerobic, fast twitching muscle fibres (type2), which rapidly accumulate lactate and H+-ions during exhaustive exercise, reveal higher carnosine concentrations compared to the oxidative, slow twitching fibres (type1)2. Carnosine levels can be measured in vivo using 1H-MR-spectroscopy (1H-MRS). It is therefore eligible to approximate muscle fibre composition, which might change in physiological and pathological conditions, e.g. during training or in denervation-related fibre atrophies3,4. In this study, we conducted 3 Tesla MRS in leg muscles of healthy volunteers to compare the carnosine levels between body sides, to investigate the reproducibility of carnosine measurements and further to set up parameter settings for future clinical protocols.METHODS
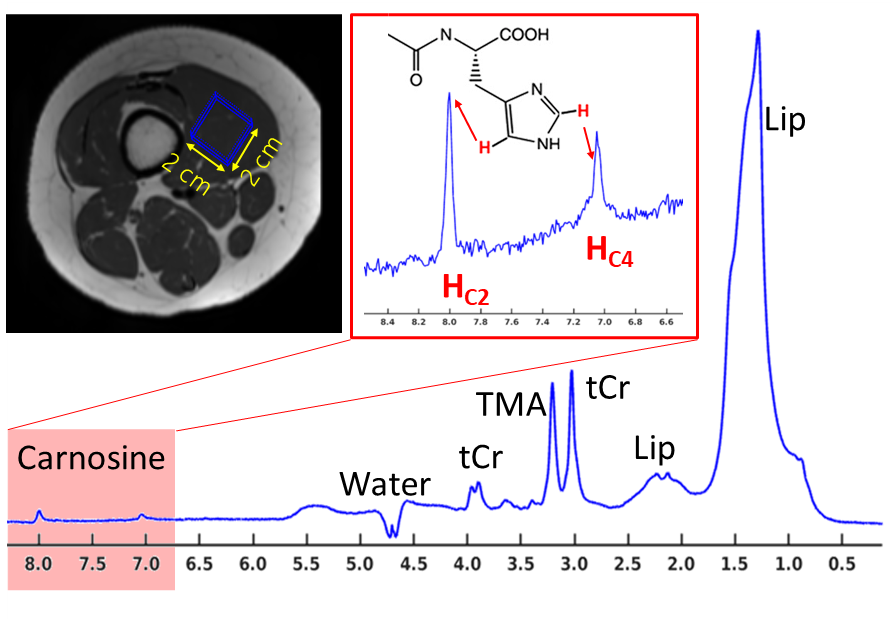
Six healthy volunteers (one female, age: 40±8years) were examined in a 3T MR scanner (MAGNETOM Skyra, Siemens Healthineers, Erlangen, Germany) equipped with a transmit/receive knee coil (18 receive channels). 1H-MR PRESS spectra were acquired in 12ml voxel located in left and right musculus vastus medialis (MVM) (TE/TR: 30/3000ms, NA: 128, 2048 FID points, receiver bandwidth: 2000Hz; manual shim, fig.1). In one volunteer, right MVM scans were repeated five times within a week to test the reproducibility of carnosine quantitation. In the same volunteer, right MVM scans were also performed in 4.5ml and 8ml voxels to test the effects of lower SNR on carnosine quantitation. Single FIDs were frequency and eddy current corrected by using a reference scan, acquired without water suppression. Besides calculating the mean spectra by using all acquired FIDs, for each volunteer, bootstrapping approach was applied to generate six pools of mean spectra computed by averaging an elevating number of single FIDs (NA: 16, 32, 48, 64, 80, 96). AMARES fitting approach5 (jMRUI package) was used for the quantitation of intensities of carnosine (HC2 singlet at 8ppm) and other metabolite resonances (see fig.1). Finally, carnosine to total creatine ratios (Carn/tCr) were computed to enable comparability between particular data sets. In each NA specific pool including six mean spectra, the SNR was computed as a ratio of baseline corrected magnitude of HC2 singlet at 8ppm and noise standard deviation obtained in the signal free spectrum range (9-10 ppm). Accordingly, the variation coefficient (CV=100·SD/mean) was computed over carnosine intensities in six mean spectra in each pool.RESULTS
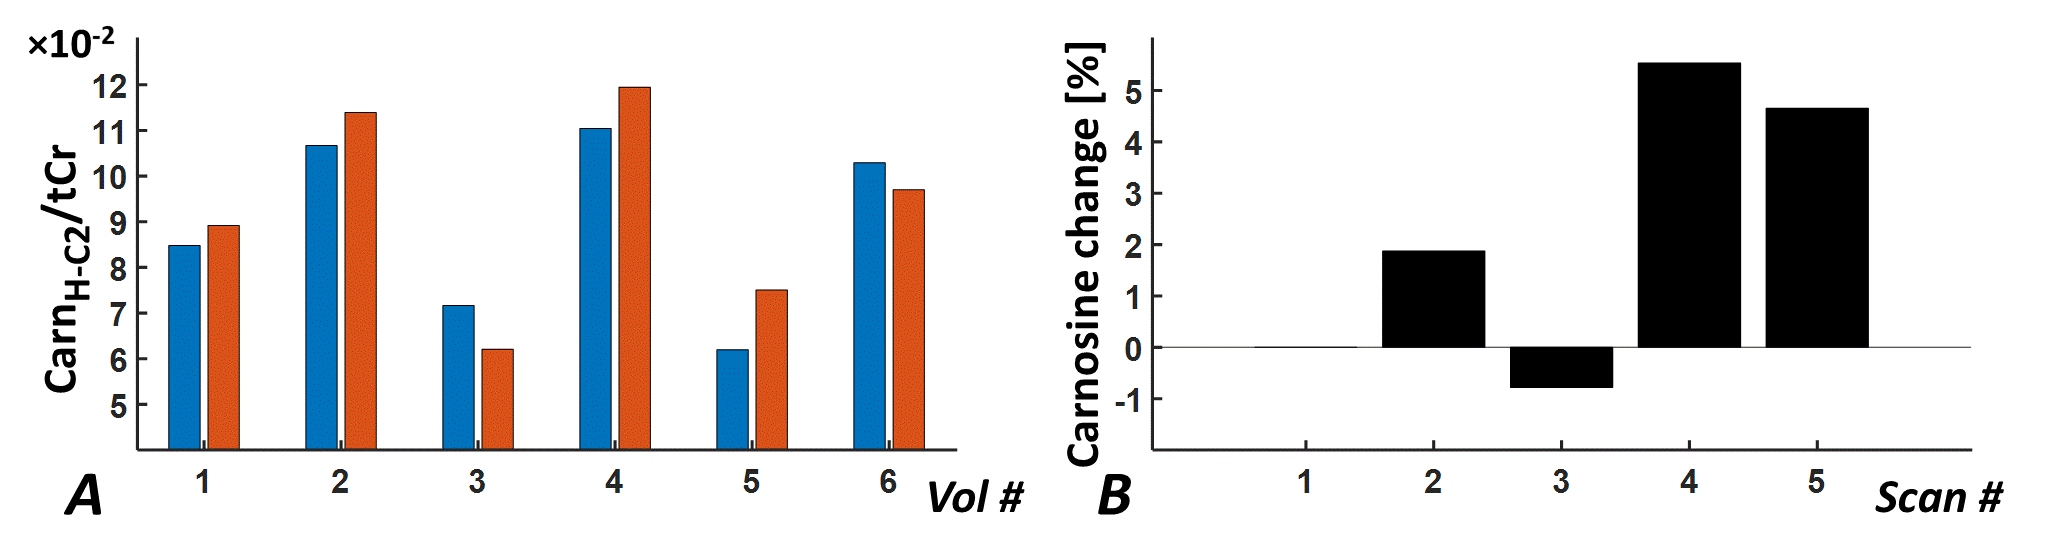
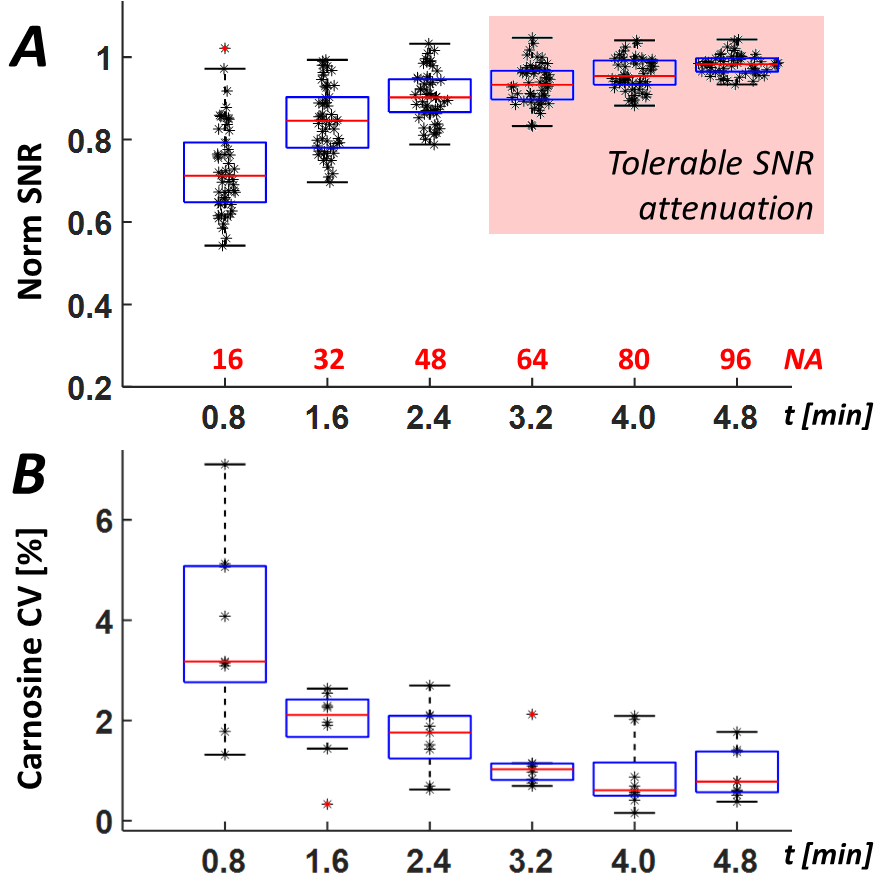
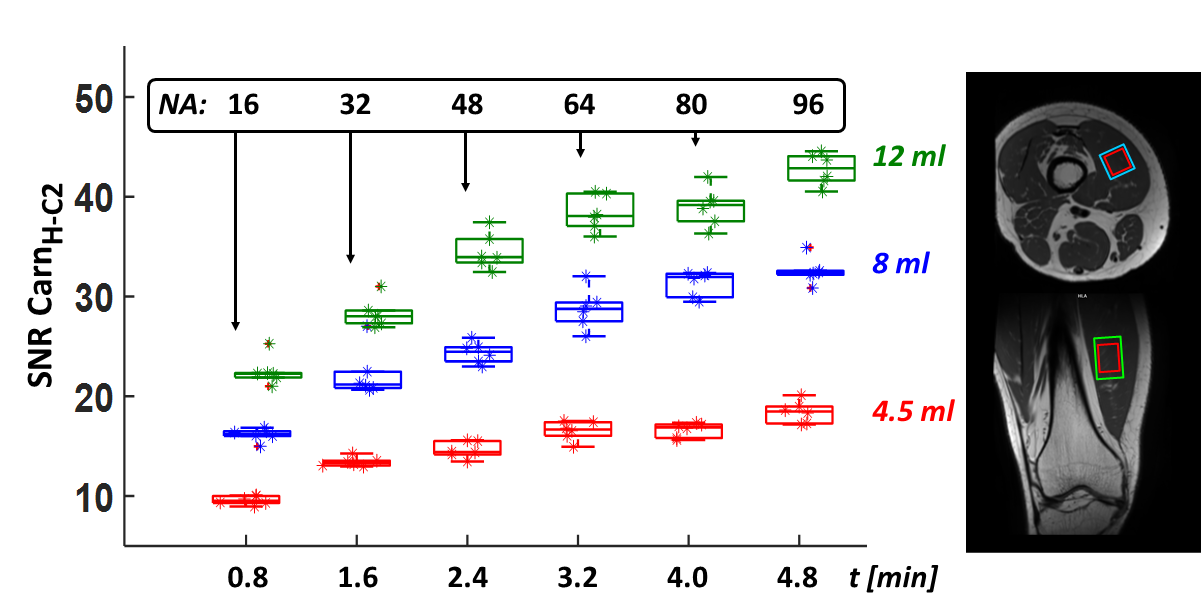
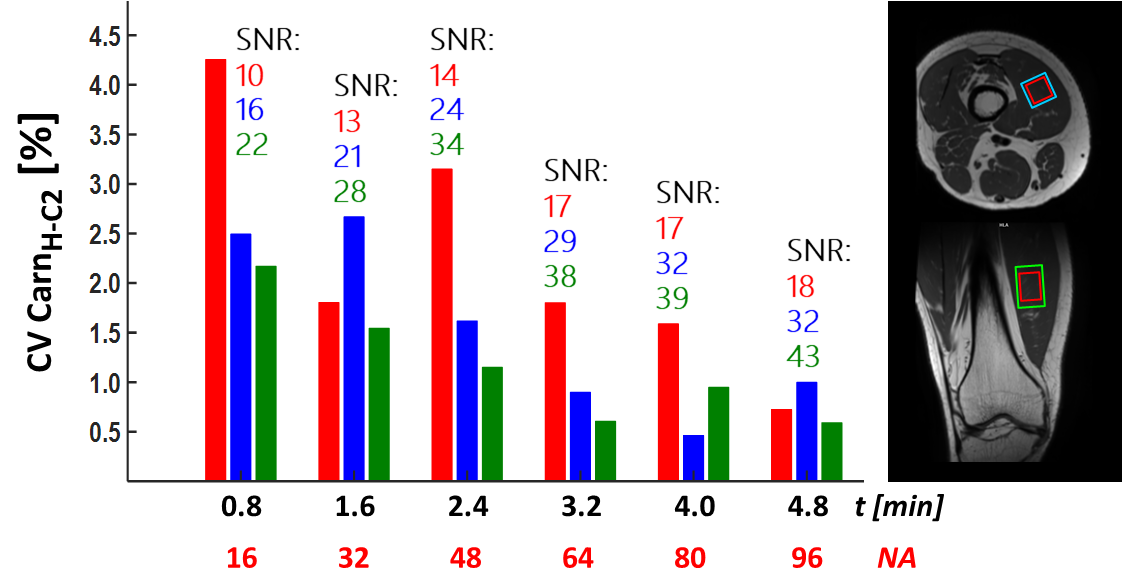
Fig.2A shows Carn/tCr ratios obtained in the left and right MVM of six examined volunteers (maximum body side difference: 17.5%). Fig.2B illustrates changes of carnosine levels obtained in the right MVM of one volunteer within five days (maximum change: <6%). Fig.3 demonstrates evolutions of increasing HC2-carnosine resonance SNR (Fig.3A) and corresponding, decreasing variation coefficients of carnosine levels (Fig.3B), which were obtained in generated mean spectra pools with elevating numbers of averaged single FIDs. It shows, that in a 12ml voxel, 64 averages are sufficient to achieve a tolerable SNR attenuation below 10% and an appropriate variation below 2%. Finally, fig.4 shows the carnosine SNRs obtained for varying number of averages in one volunteer, whose right MVM was examined by using the voxel sizes 4.5ml (red boxes), 8ml (blue boxes) and 12ml (green boxes). In addition, Fig.5 illustrates corresponding CVs, which as expected decrease with an increasing voxel volume and number of averaged FIDs.DISCUSSION
Besides showing an appropriate body side comparability, our study demonstrates a sufficient reproducibility of carnosine measurements at different days. Observed carnosine differences between left and right MVM might potentially be ascribed to different muscle fibre compositions in dominant and non-dominant legs, which however has to be examined more systematically in a larger sample. The remaining inter-individual variation in repetitive scans might be due to slight position differences of manually selected voxel, which can be reduced by defining appropriate anatomical markers. Finally, we have shown, that sufficient quantitation precision (CV<2%) of carnosine quantitation can be achieved by using small voxels (≤5ml) and relatively low number of averages (≤64).CONCLUSION
In summary, we have shown that muscular carnosine levels can be measured with a sufficient precision in less than four minutes and in relatively small voxels (<5ml). This makes these scans eligible for future clinical protocols targeting on examinations of varying muscle fibre compositions in several physiological and pathological conditions (e.g. training effects, atrophy of injured or aging muscles).Acknowledgements
This study was performed on a human research MR scanner founded by the German Research Foundation (DFG, Deutsche Forschungsgemeinschaft, INST 271/ 406-1 FUGG).References
[1] Begum G, Cunliffe A, Leveritt M. Physiological role of carnosine in contracting muscle. Int. J. Sport Nutr. Exerc. Metab. 2005; 15(5): 493-514. doi: 10.1123/ijsnem.15.5.493.
[2] Harris RC, Dunnett M, Greenhaff PL. Carnosine and taurine contents in individual fibres of human vastus lateralis muscle. Journal of Sports Sciences 1998; 16(7): 639-643
[3] Krššák M, Lindeboom L, Schrauwen-Hinderling V, Szczepaniak LS, Derave W, Lundbom J, Befroy D, Schick F, Machann J, Kreis R, Boesch C. Proton magnetic resonance spectroscopy in skeletal muscle: Experts' consensus recommendations. NMR Biomed. 2021; 34(5): e4266. doi: 10.1002/nbm.4266.
[4] Kukurová IJ, Valkovič L, Ukropec J, de Courten B, Chmelík M, Ukropcová B, Trattnig S, Krššák M. Improved spectral resolution and high reliability of in vivo (1) H MRS at 7 T allow the characterization of the effect of acute exercise on carnosine in skeletal muscle. NMR Biomed. 2016; 29(1): 24-32. doi: 10.1002/nbm.3447.
[5] Vanhamme L, van den Boogaart A, Van Huffel S, Improved method for accurate and efficient quantification of MRS data with use of prior knowledge. J Magn Reson, 1997. 129(1): p. 35-43.
Figures