1536
Large-scale analysis of subregional thigh muscle volumes on Dixon MRI and potential clinical utility1Department of Diagnostic Radiology, The University of Hong Kong, Hong Kong, Hong Kong
Synopsis
Keywords: Muscle, Muscle
Motivation: Asymmetrical muscle atrophy and hypertrophy are known to occur in muscular atrophy. Musclar subtle changes are important indicators for early detection and tracking changes longitudinally with intervention.
Goal(s): To automatically segment thigh muscle subregions and assess their muscular volume and trends with ageing on large-scale data.
Approach: We trained nnU-Net for thigh muscle segmentation, and applied on the UK-Biobank data to assess the association between muscular volume and aging and diseases.
Results: Thigh musclar volume decreases as we are aging, and is significantly inversely associated with type-2 diabetes, hyptertebnsion and dementia.
Impact: Lower volume of the anterior thigh muscle was found in type-2 diabetes, hypertension and dementia patients. Lower volumes of the medial and posterior thigh muscle were found in dementia patients.
Background
Muscle atrophy is known to occur as we age. Moreover, abnormal muscle fatty atrophy known as sarcopenia is a known biomarker for pathological ageing [1]. In addition, asymmetrical muscle atrophy and hypertrophy are known to occur in conditions such as muscular atrophy [2]. These conditions affect different muscle groups differently, thus it is important to segment and quantify muscle volumes accurately at a more granular level. We reasoned that automatic and accurate segmentation of individual muscle groups of the thigh is important to assess subtle changes in muscle in the early stage and to be able to track changes more accurately longitudinally with intervention.Purpose
To automatically segment four thigh muscle compartments (i.e., anterior compartment, Sartorius, medial compartment and posterior compartment) and assess their muscular volume and trends with ageing on Dixon MRI in the UK-Biobank dataset [3].Population
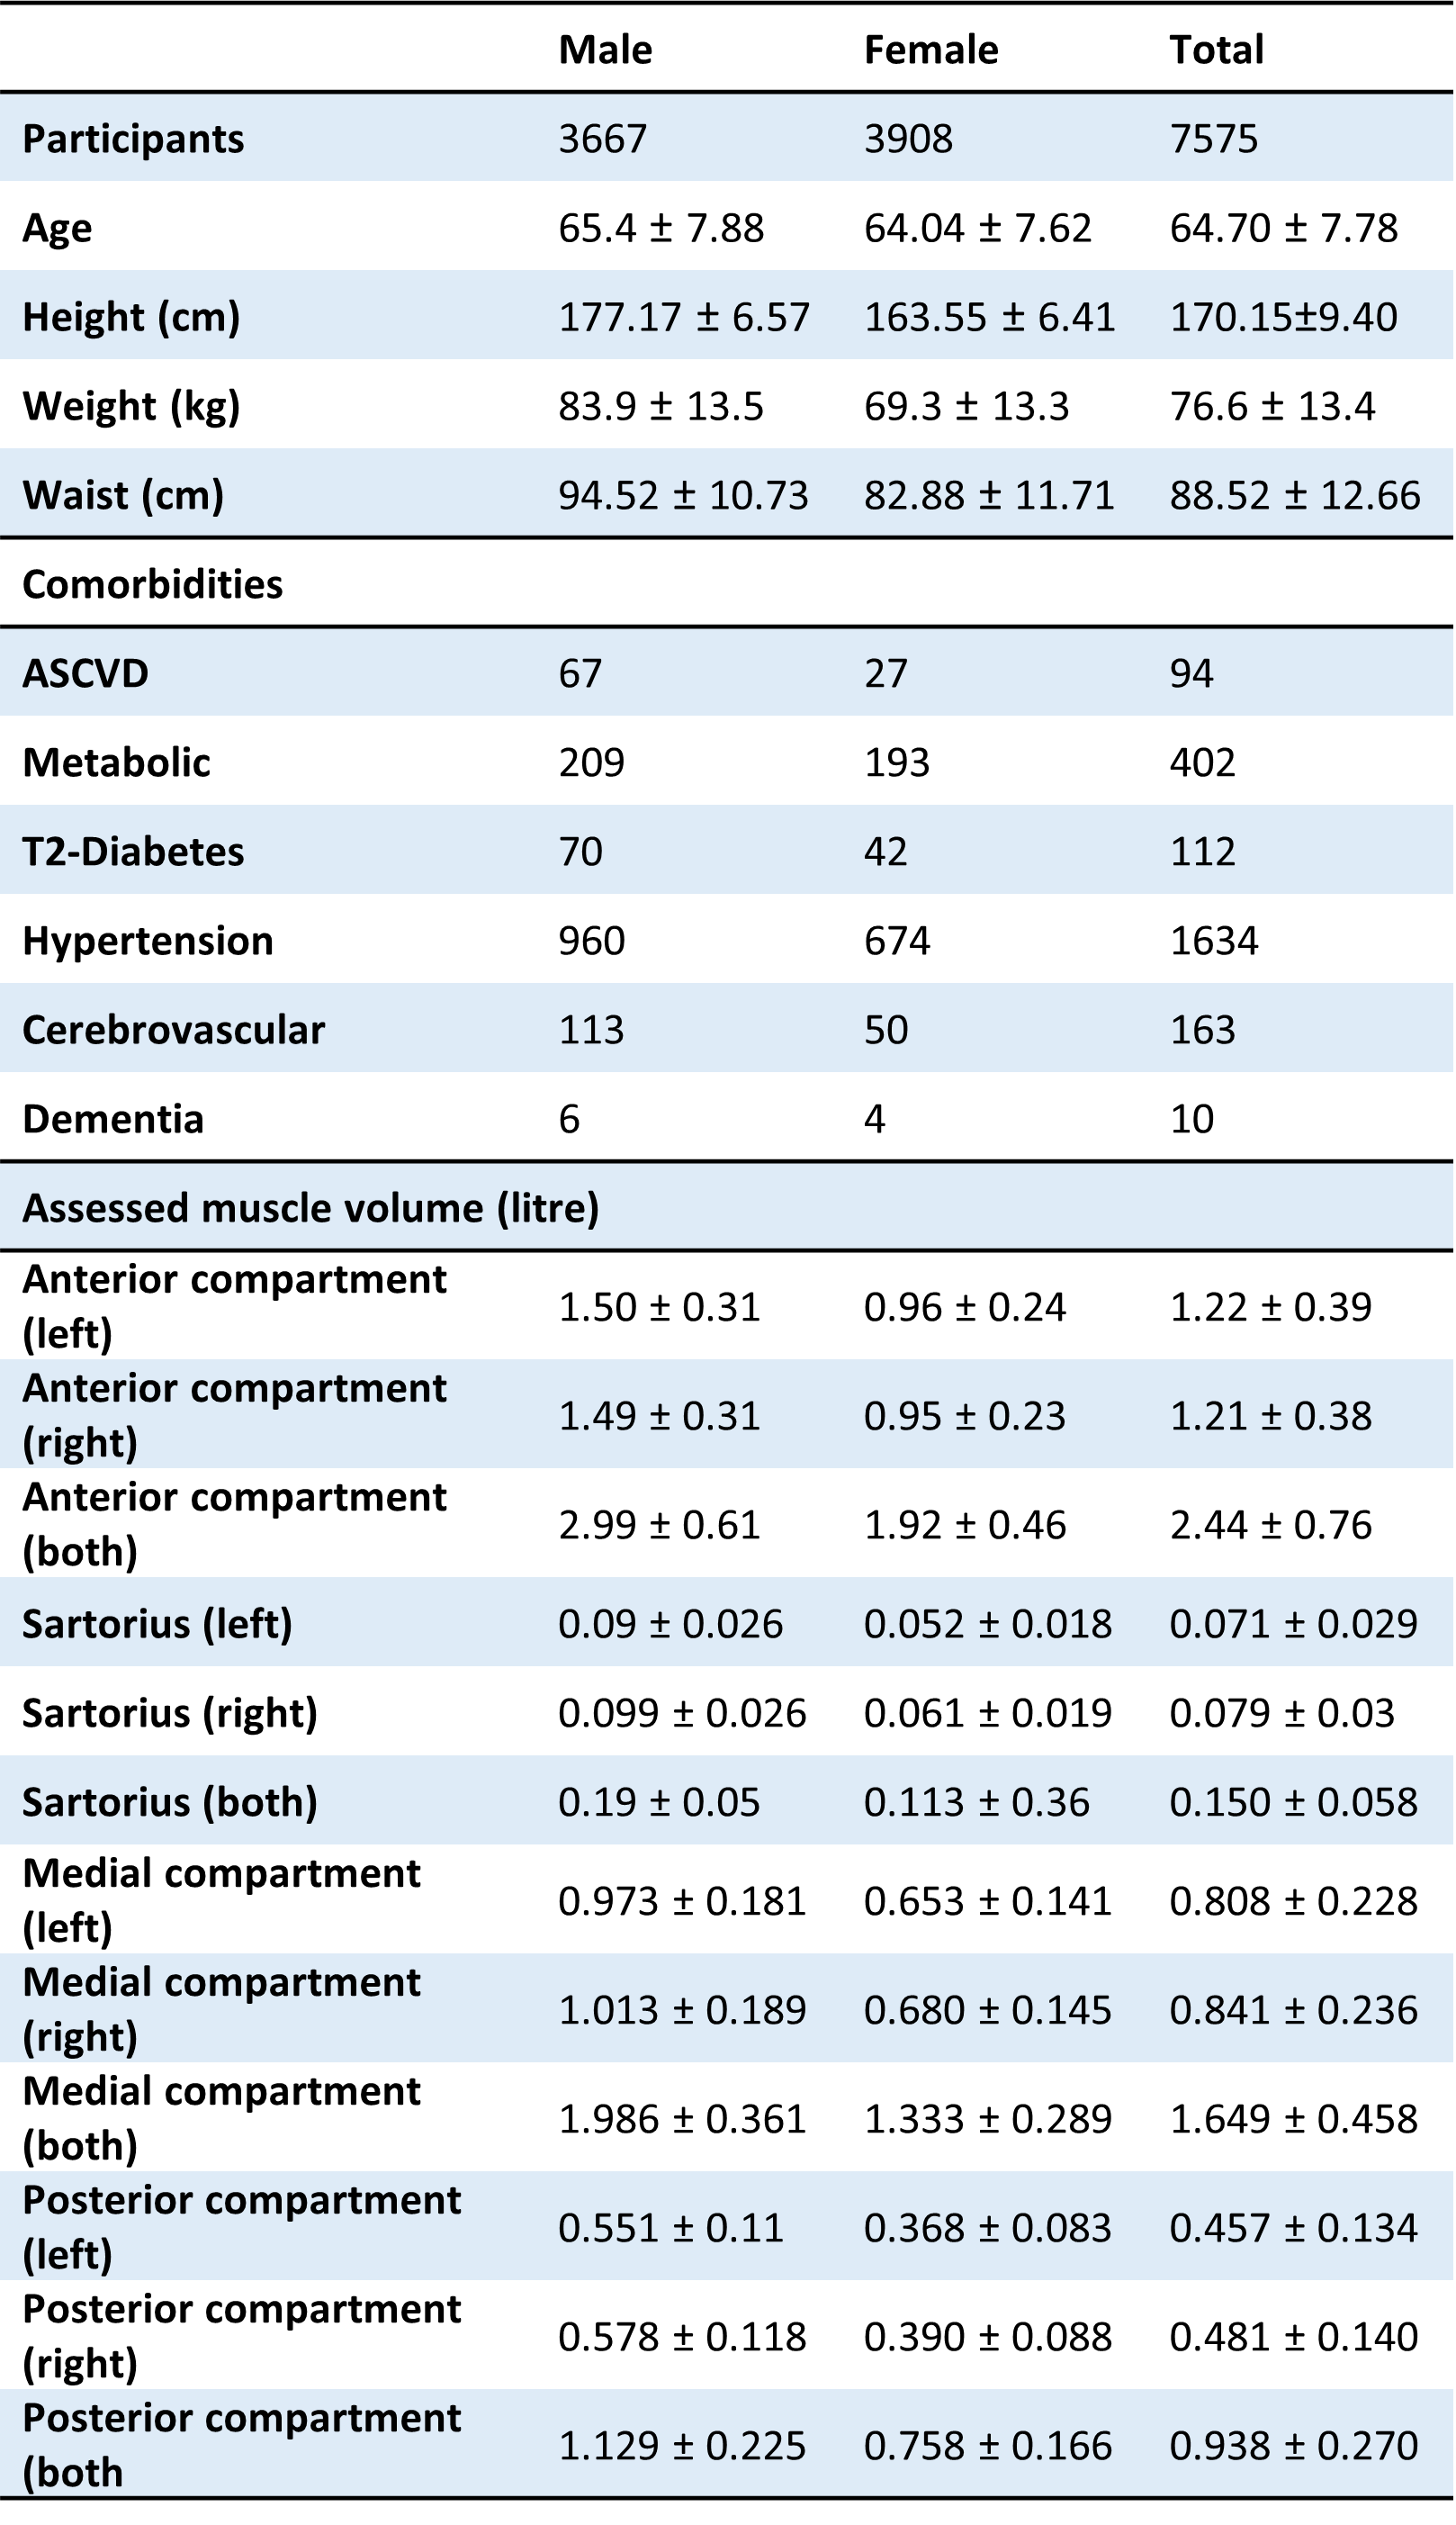
A total of 7575 subjects were randomly sampled from the UK-Biobank database (summarized in Table 1). Dixon MRI scans, including IDEAL in-phase, opposed-phase, water and fat of the sampled subjects were retrieved for analysis.Methods
A default nnU-Net architecture was utilized for segmenting the four muscle compartments in this study [4]. The network was multi-modal, where it took the four IDEAL sequences as input. It was trained with 5-fold cross-validation with our institutional MR data (N = 100, training: 80, validation: 20). The ground truths were manually delineated by two radiologists according to in-phase images using ITKSnap 3.8 [5]. The obtained segmentation was subtracted by the fat percentages>50% regions to obtain the fat-free muscle regions [6].Statistical test
All statistics were performed using the R software and SPSS27. The correlation between variables was assessed via Spearman’s correlation coefficient. The means between groups were compared by the Mann-Whitney test. The odd ratios between muscle volume and various systemic diseases were examined via multinomial logistic.Results
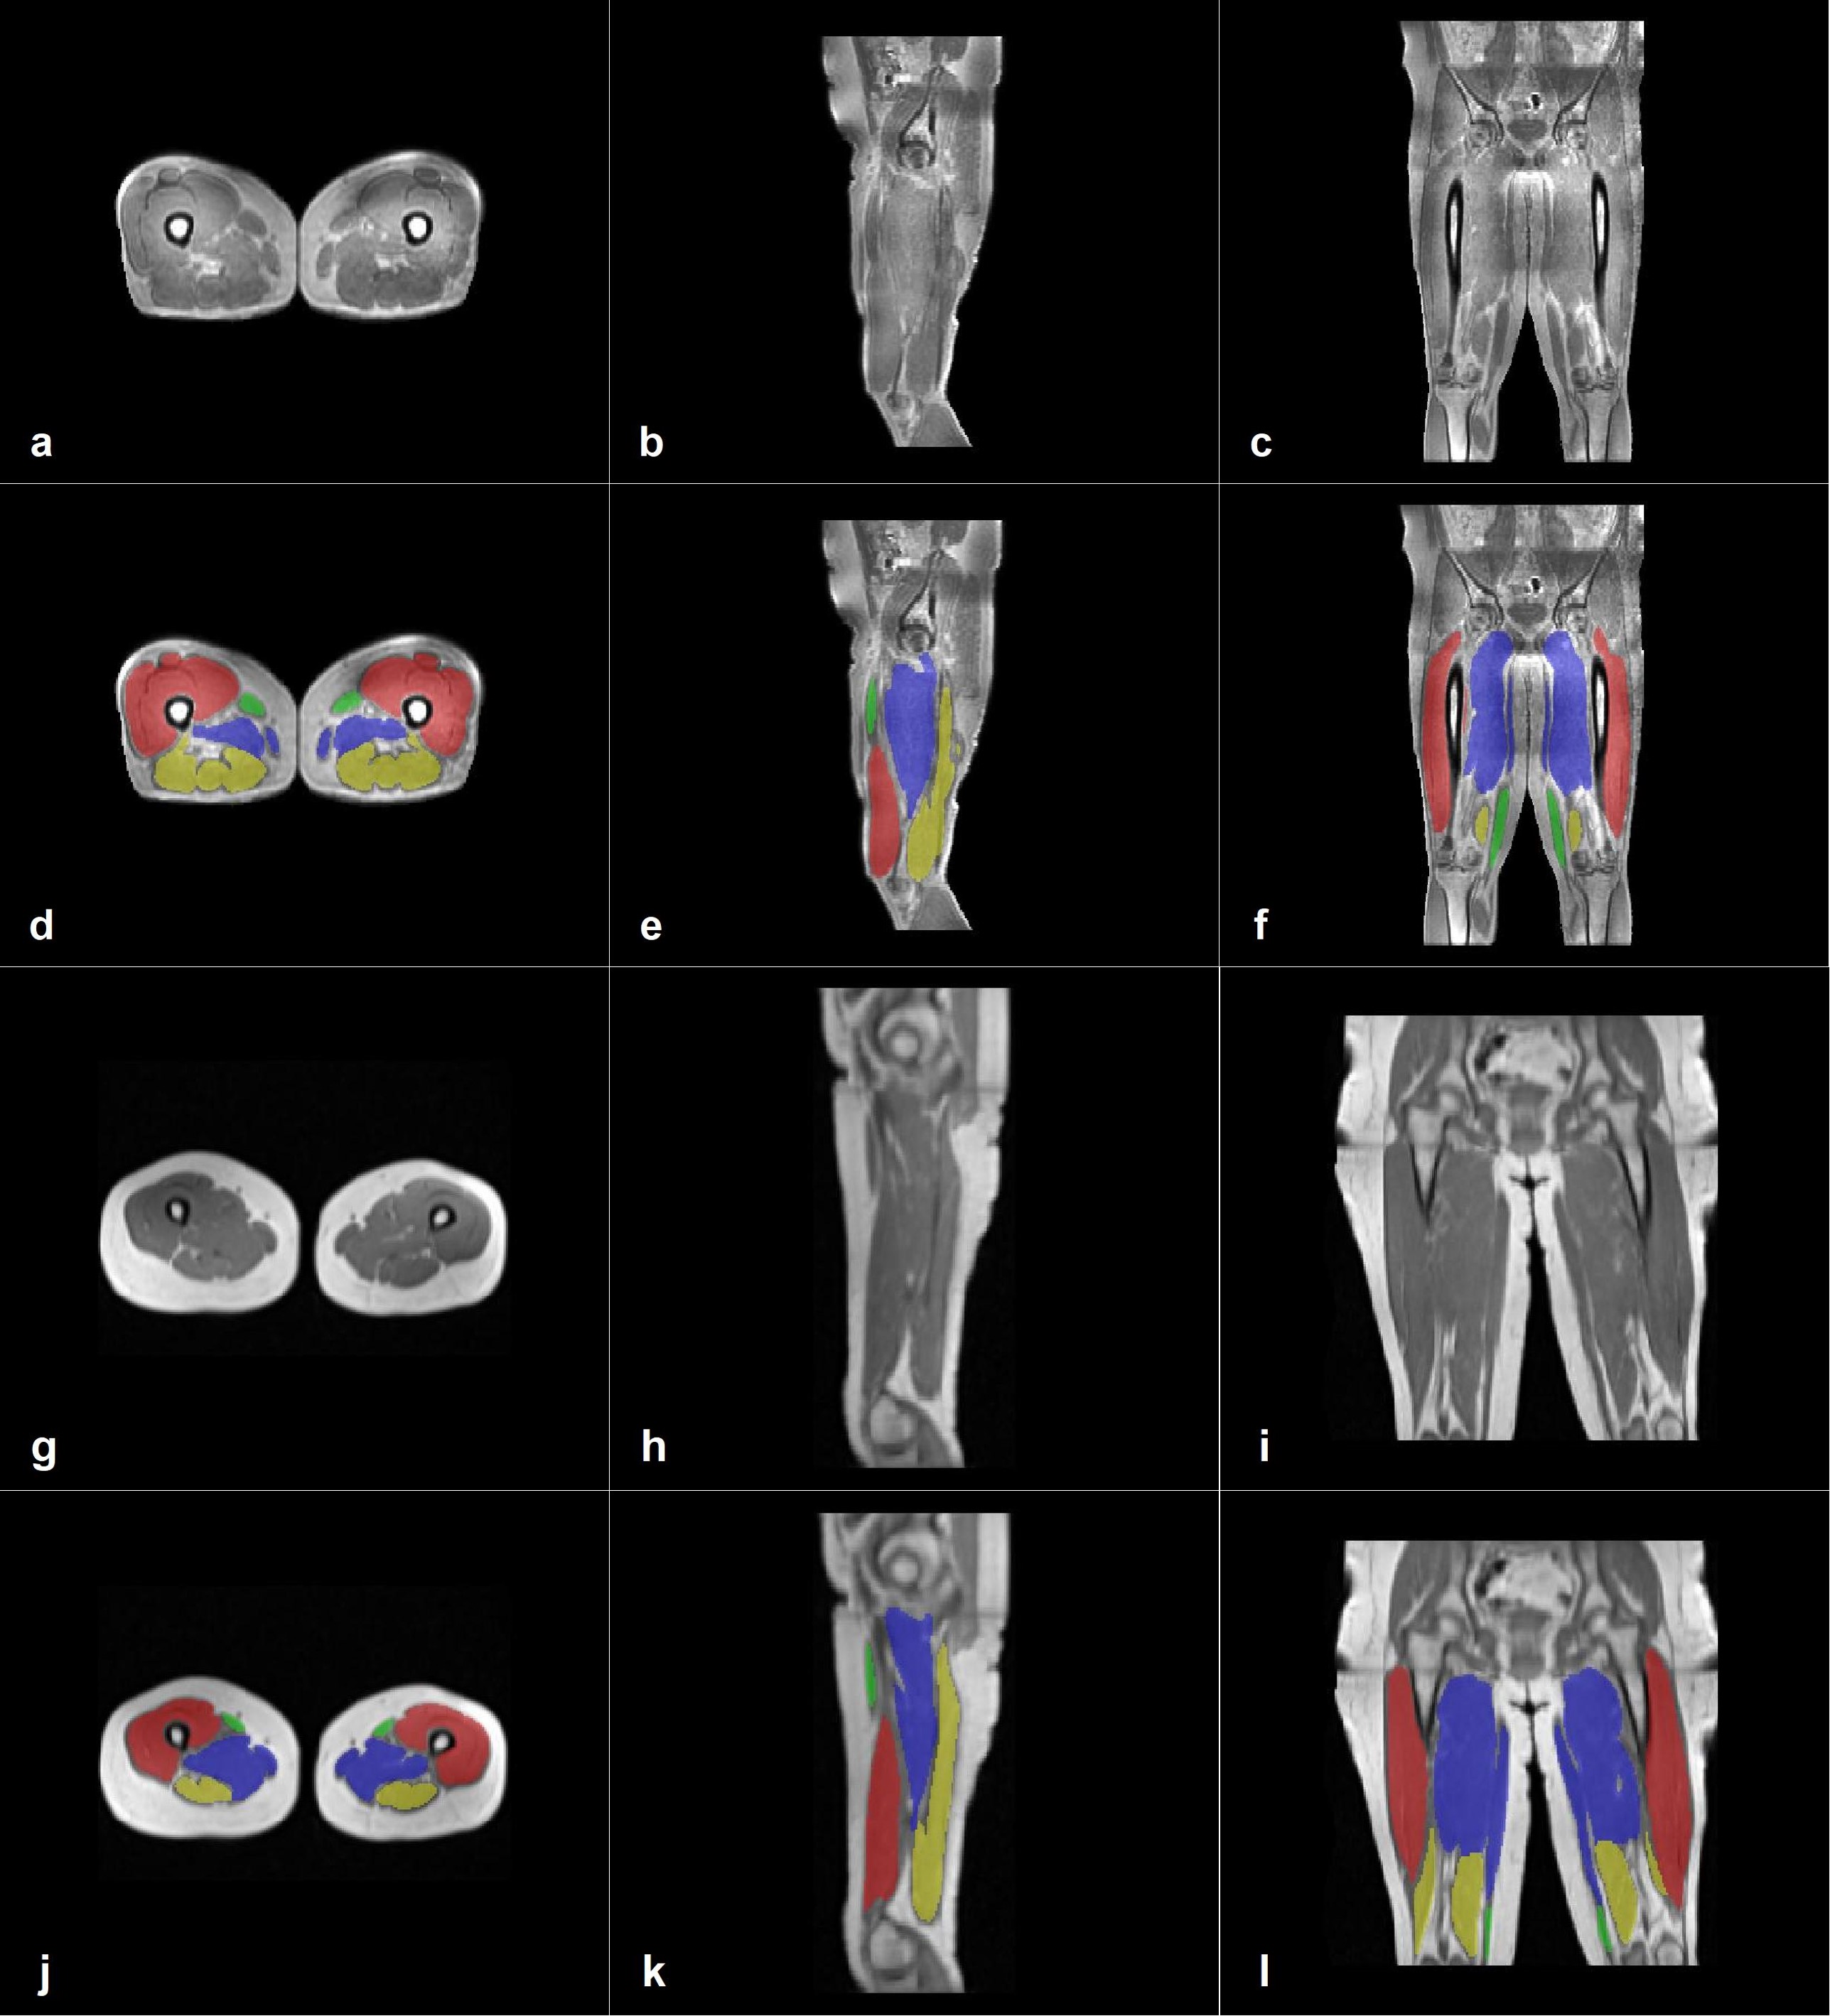
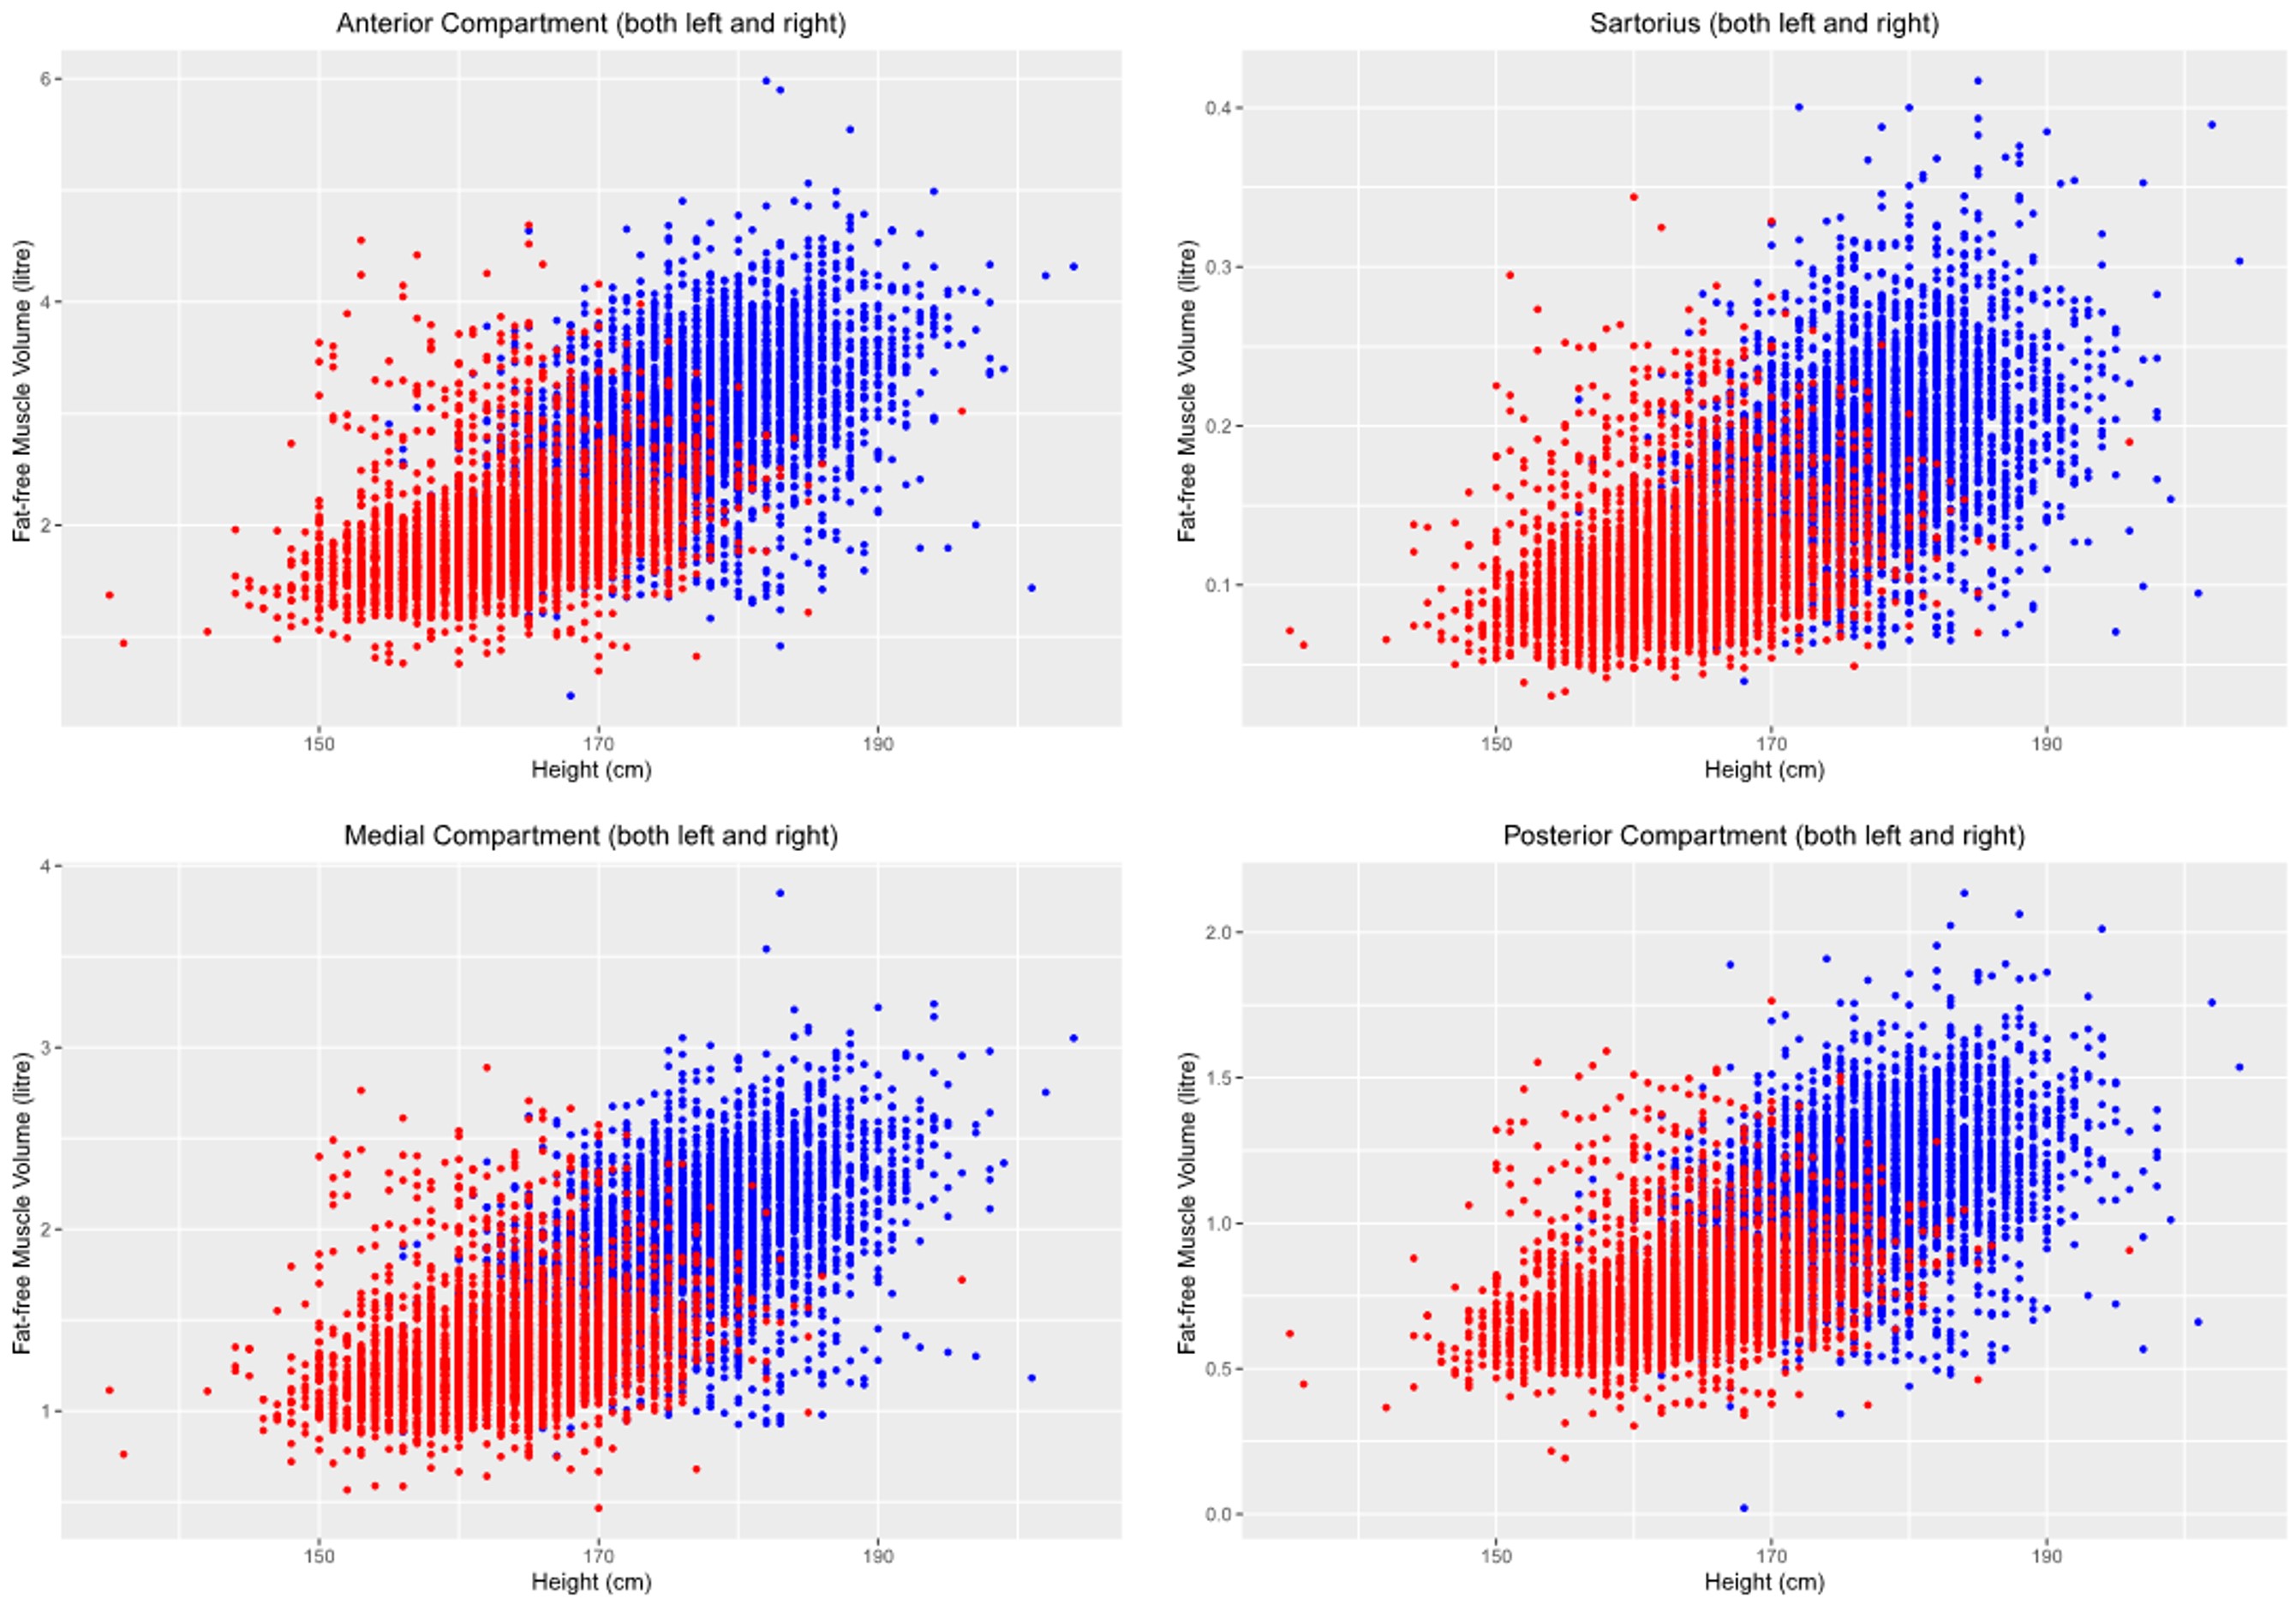
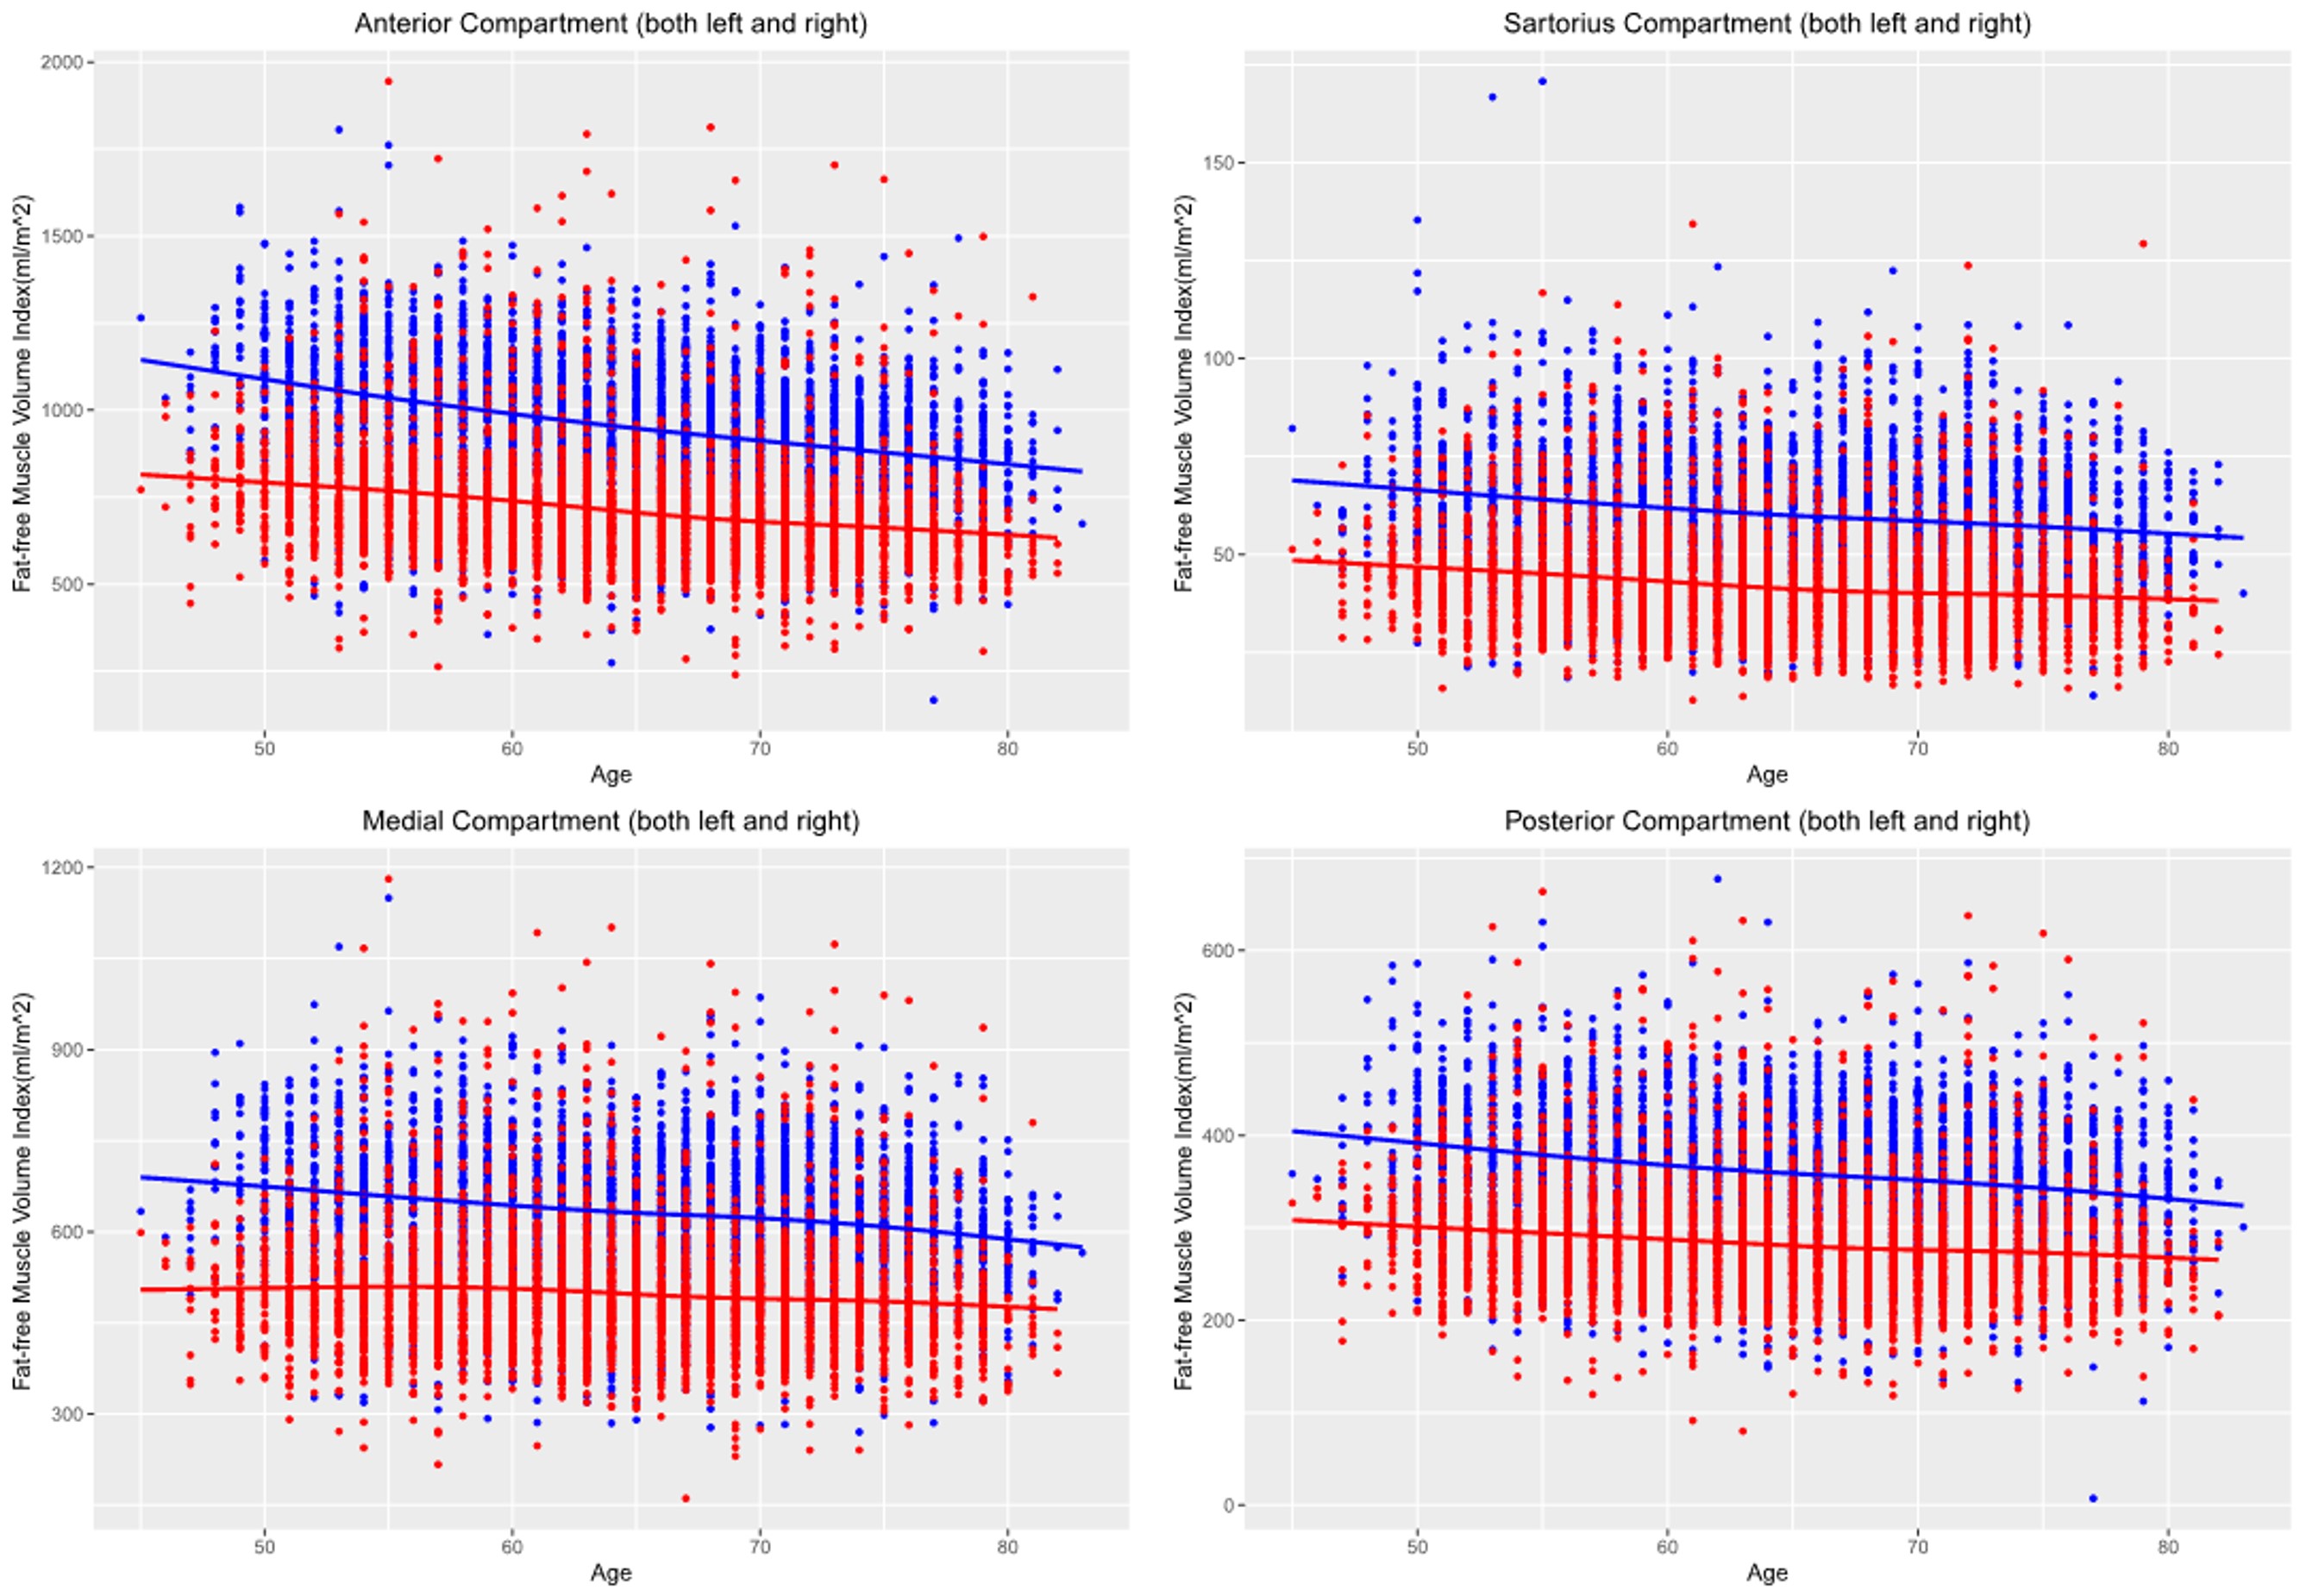
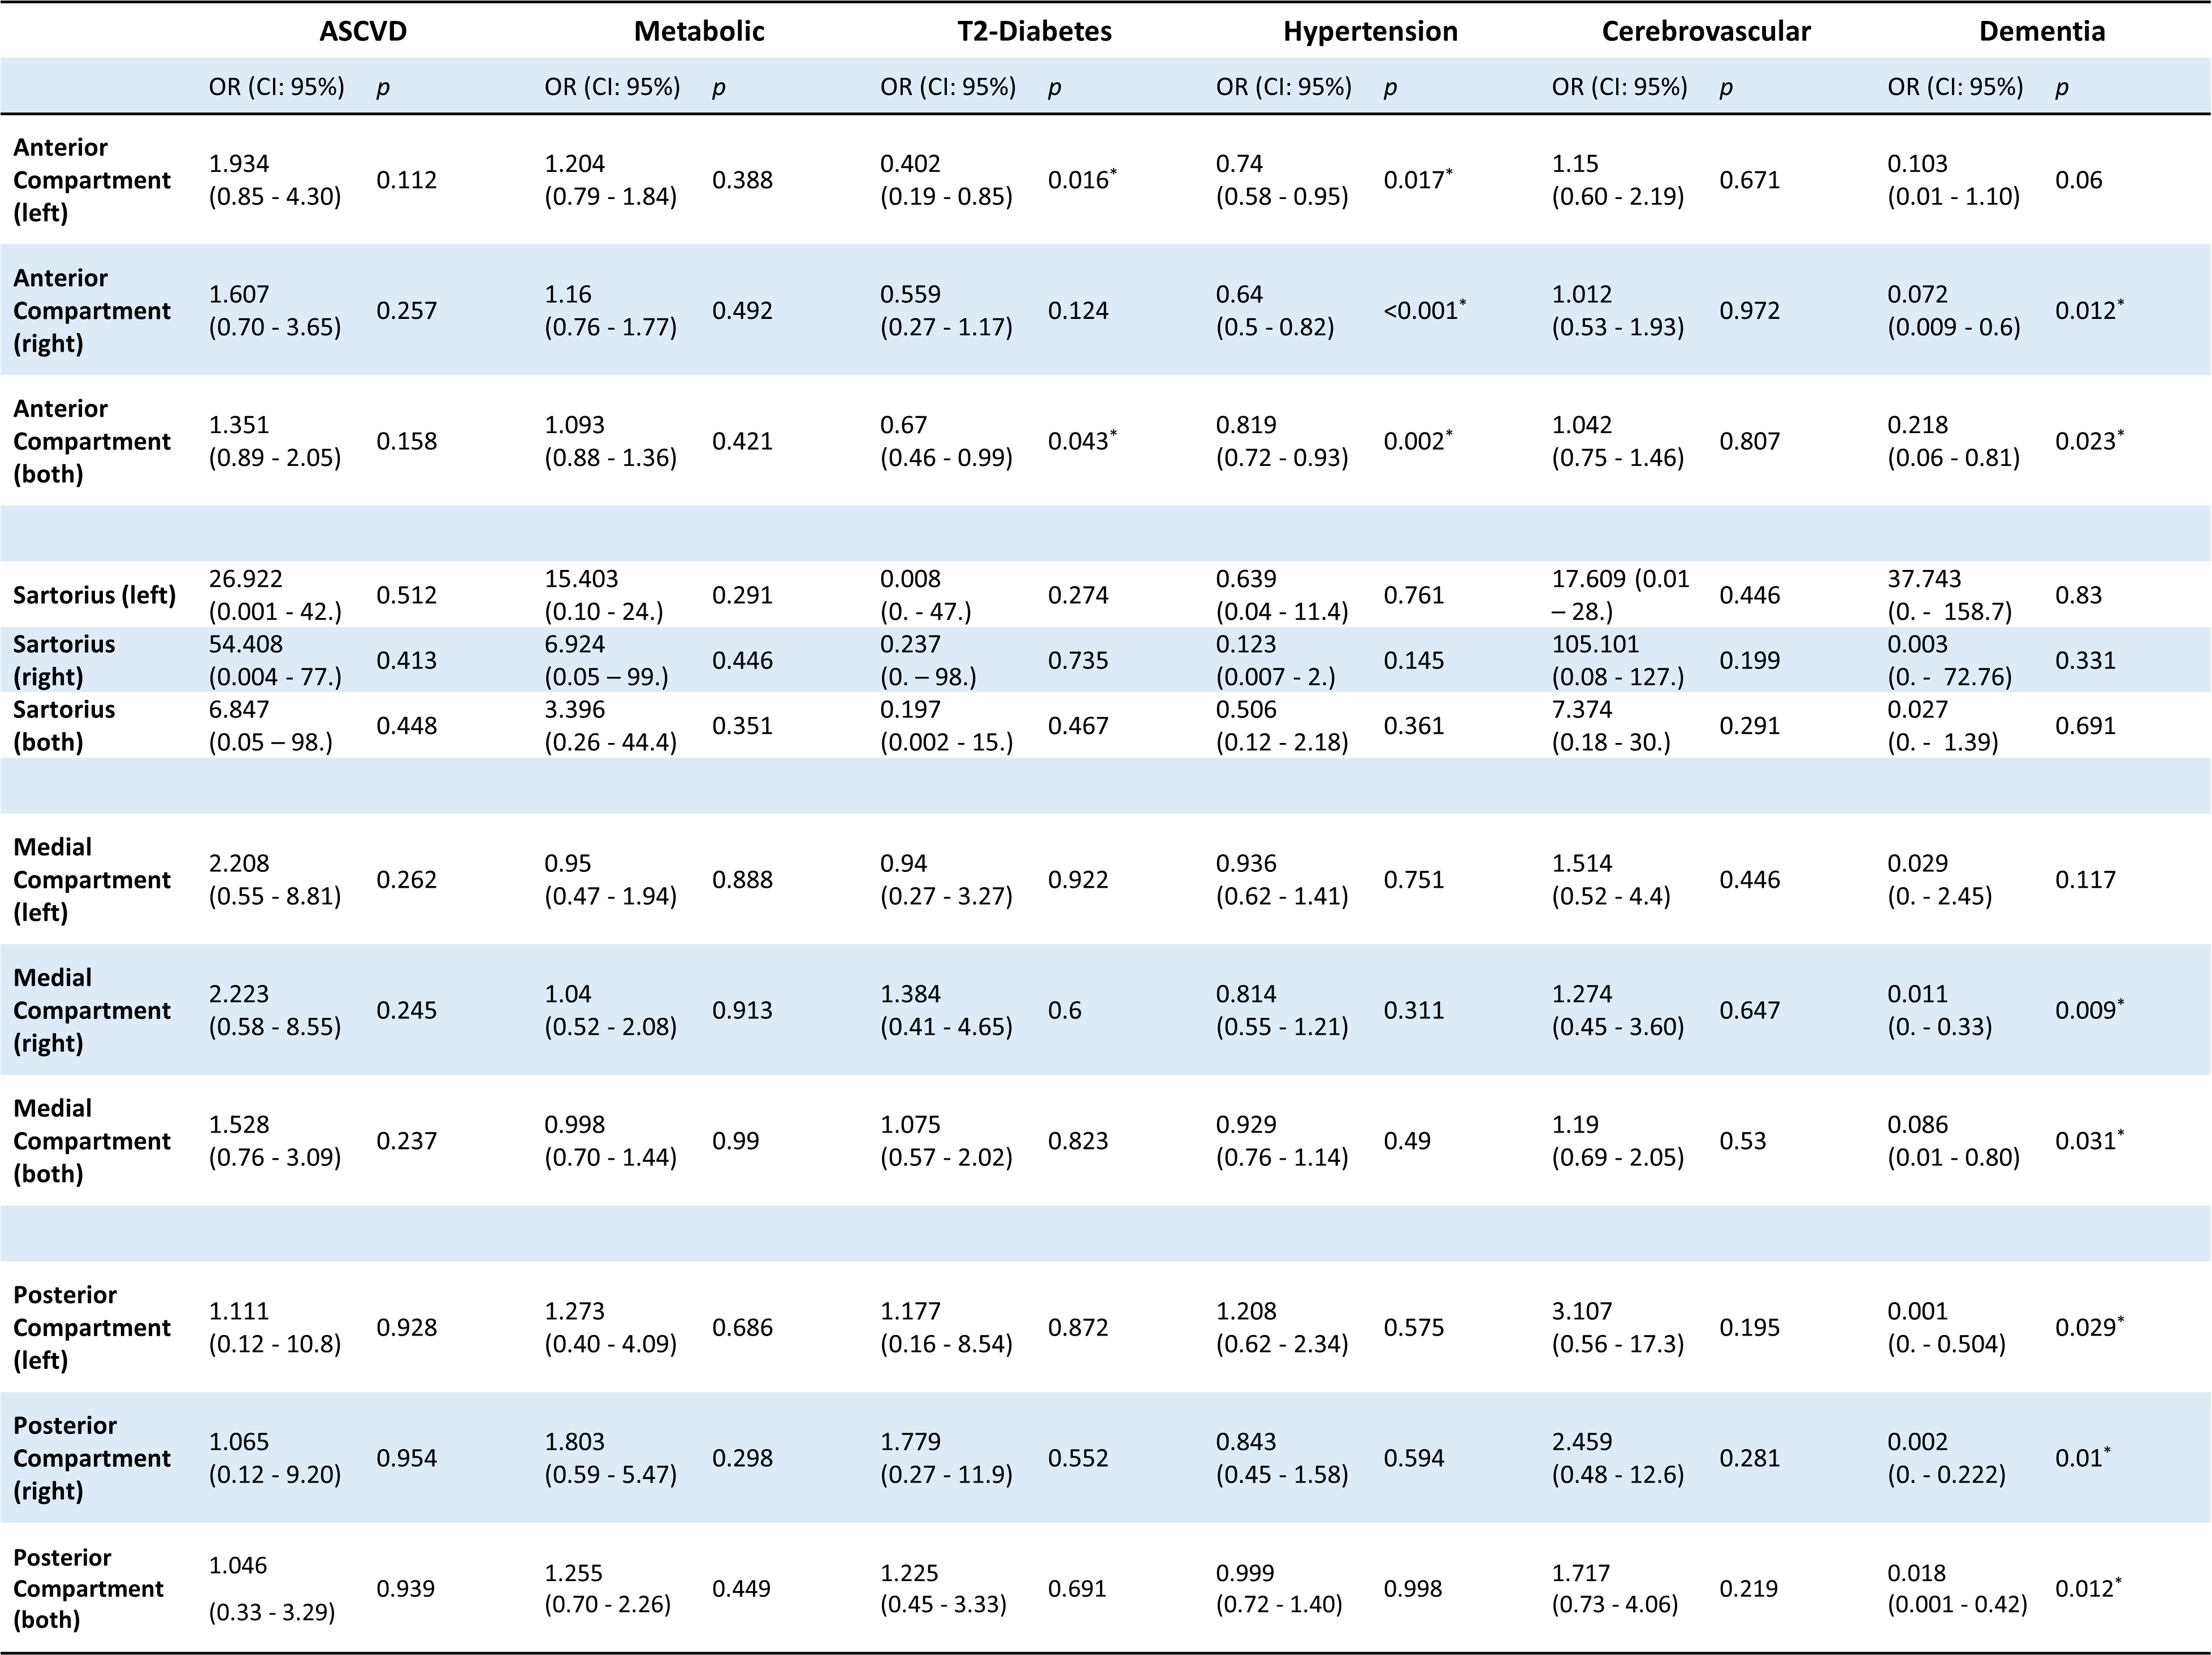
The dice coefficient on the validation set are 0.90±0.05 for the anterior compartment, 0.83±0.02 for Sartorius, 0.88±0.04 for the medial compartment, and 0.85±0.03 for the posterior compartment. Figure 1 shows the segmentations of our institutional data and the UK-Biobank data. The assessed muscle volumes were highly correlated with the reported values in UK-Biobank database[1]. According to Spearman’s correlation test, the correlation coefficients for the anterior and posterior fat-free muscle volume is ρ=0.858 and ρ=0.978, respectively. Figure 2 shows the scatter plots of total anterior, Sartorius, medial and posterior muscle volume (litre) by height (cm), separated by gender. Significant positive correlation coefficients between fat-free muscle volume and height were observed (anterior: ρ=0.707, Sartorius: ρ=0.652, medial: ρ=0.70, posterior: ρ=0.682). Moreover, the Mann-Whitney test indicated that all four muscle volume indexes of male were significantly greater than those of female (p-values < 0.01), which is consistent with previous studies demonstrating higher muscle volume in male compared with female [7]. Figure 3 shows the scatter plots for the fat-free muscle volumes index by age with fitted linear regression curve. Significant negative correlation coefficients were observed between the muscle index and age in both genders (anterior: male: ρ=−0.376; female: ρ=−0.327; Sartorius: male: ρ=−0.184; female: ρ=−0.194; medial: male: ρ=−0.204; female: ρ=−0.102; posterior: male: ρ=−0.222; female: ρ=−0.171, all p values<0.01). The trend of decreasing muscle mass with ageing is consistent with prior studies [7]. In Table 2, we summarized the result of multi-modal logistic regression which examined the odd ratio between muscles volumes and various age-related diseases including Atherosclerotic Cardiovascular Disease (ASCVD), metabolic disease, type 2-diabetes, hypertension, cerebrovascular disease and dementia. The models were adjusted by age, gender, height, weight and waist. The results show that the total anterior fat-free muscle volumes were significantly inversely associated with type-2 diabetes (OR=0.67 (95%CI: [0.455, 0.987]), and hypertension (OR=0.819(95%CI:[0.721, 0.93]). The anterior, medial and posterior compartment fat-free muscle volumes were also significantly inversely associated with dementia, with OR=0.218(95%CI:[0.059, 0.81]), OR=0.086 (95%CI:[0.009, 0.795]) and OR=0.018(95%CI:[0.001-0.42)), respectively. [1] The total fat-free muscle volume of our automatic segmented anterior compartment and Sartorius corresponds to the anterior fat-free muscle volume reported in UK-Biobank database. Similarly, the total volume of automatic segmented medial and posterior compartment corresponds to the posterior fat-free volume in UK-Biobank.Conclusion
We demonstrated that the developed nnU-Net model to segment four individual thigh muscle groups demonstrate reasonable accuracy when applied to large datasets such as the UK Biobank with high correlation with previous applied methods. We demonstrated trends with ageing in this cohort as well as some negative association with various age-related diseases.Acknowledgements
The work is supported by the Health and Medical Research Fund (HMRF Ref. No: 09202366), Health Bureau (HHB), Hong Kong.References
[1] L. Larsson, H. Degens, M. Li, L. Salviati, Y. i. Lee, W. Thompson, J. L. Kirkland and M. Sandri, "Sarcopenia: aging-related loss of muscle mass and function," Physiological reviews, vol. 99, no. 1, pp. 427-511, 2019.
[2] H. Kim, C.-K. Lee, J. S. Yeom, J. H. Lee, J. H. Cho, S. I. Shin, H.-J. Lee and B.-S. Chang, "Asymmetry of the cross-sectional area of paravertebral and psoas muscle in patients with degenerative scoliosis," European Spine Journal , vol. 22, pp. 1332-1338, 2013.
[3] C. Sudlow, J. Gallacher, N. Allen, V. Beral, P. Burton, J. Danesh, P. Downey, P. Elliott, J. Green, M. Landray, B. Liu, P. Matthews, G. Ong, J. Pell, A. Silman, A. Young, T. Sprosen and T. Peakman, "UK Biobank: an open access resource for identifying the causes of a wide range of complex diseases of middle and old age," PLoS medicine, vol. 12, no. 3, p. e1001779, 2015.
[4] F. Isensee, P. F. Jaeger, S. A. Kohl, J. Petersen and K. H. Maier-Hein, "nnU-Net: a self-configuring method for deep learning-based biomedical image segmentation," Nature methods, vol. 18, no. 2, pp. 203-211, 2021.
[5] P. A. Yushkevich, Y. Gao and G. Gerig, "ITK-SNAP: An interactive tool for semi-automatic segmentation of multi-modality biomedical images," in 2016 38th annual international conference of the IEEE engineering in medicine and biology society (EMBC) (pp 3342-3345), IEEE, 2016.
[6] A. Karlsson, J. Rosander, T. Romu, J. Tallberg, A. Grönqvist, M. Borga and O. Dahlqvist Leinhard, "Automatic and quantitative assessment of regional muscle volume by multi-atlas segmentation using whole-body water-fat MRI," Journal of Magnetic Resonance Imaging, vol. 41, no. 6, pp. 1558-1569, 2015.
[7] J.-Y. Hogrel, Y. Barnouin, N. Azzabou, G. Butler-Browne, T. Voit, A. Moraux, G. Leroux, A. Behin, J. S. McPhee and P. G. Carlier, "NMR imaging estimates of muscle volume and intramuscular fat infiltration in the thigh: variations with muscle, gender, and age," Age, vol. 37, pp. 1-11, 2015.
Figures