1535
Imaging biomarkers of skeletal muscle strength across the lifespan1Bernard and Irene Schwartz Center for Biomedical Imaging, Department of Radiology, New York University, New York, NY, United States, 2Department of Radiology, Stanford University, Stanford, CA, United States, 3Mechanical Engineering, Stanford University, Stanford, CA, United States
Synopsis
Keywords: Muscle, Aging
Motivation: Physical therapy and exercise are proposed to slow down the aging-associated loss in muscle strength, but it is currently not known which compositional or architectural aspects of skeletal muscle cause reduced muscle strength.
Goal(s): Our goal was to exploit quantitative MRI to identify determinants of muscle strength production across the lifespan.
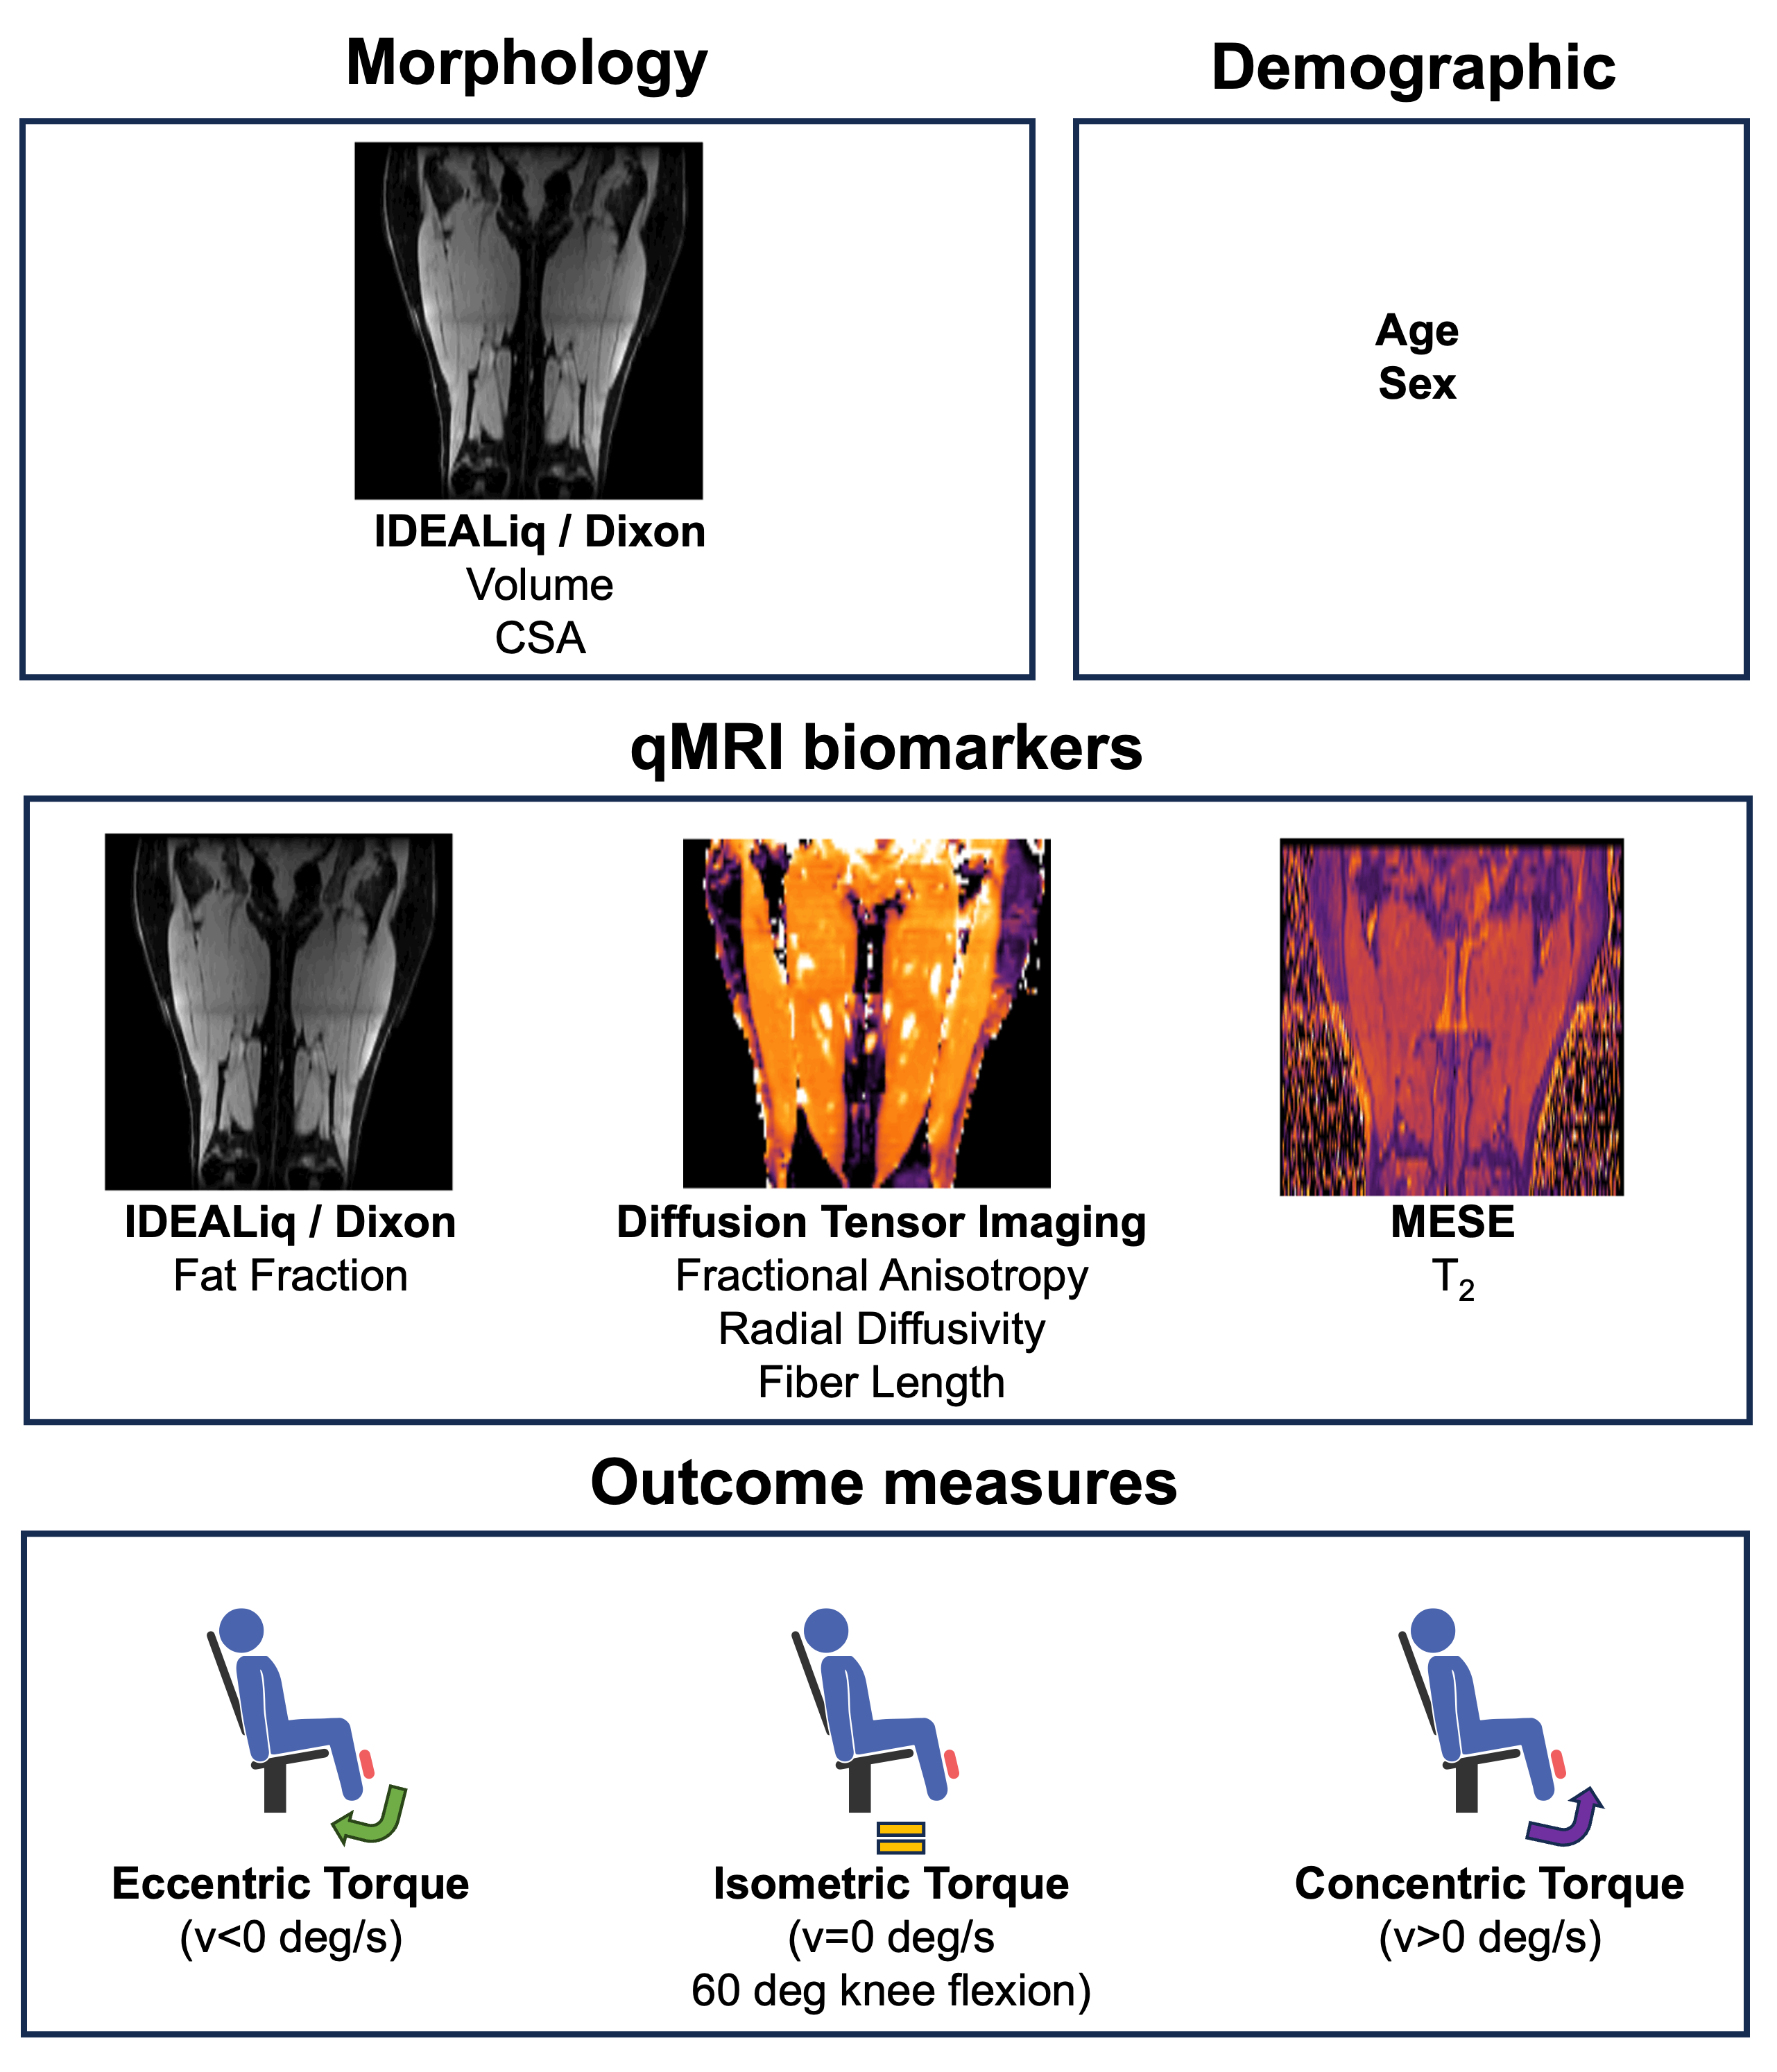
Approach: We used quantitative MRI (fat fraction, diffusion parameters, fiber length and muscle T2) to predict quadriceps torque (n=24, 30-80 y/o).
Results: We found that the inclusion of FA greatly improved the prediction of torque over morphology alone. This might be explained with modifications of fiber typing with aging.
Impact: We have demonstrated that DTI parameters provide quantitative metrics of muscle quality which can be used to study force production in skeletal muscle, independently of volume. These compositional aspects might be amenable to interventions and provide specific targets for treatment.
Introduction
Skeletal muscle weakness is a key feature of sarcopenia and other muscle-wasting conditions[1]. While the increasing muscle weakness with age can be partially explained by a loss of net muscle mass, the contribution of muscle composition to muscle strength remains unclear. Quantitative MRI (qMRI) biomarkers can provide insight into muscle composition and therefore offer the opportunity to investigate the causes of muscle weakness non-invasively. Furthermore, qMRI biomarkers can allow for a more objective weakness assessment, with less dependence on voluntary activation.Muscle strength has been shown to correlate with several qMRI biomarkers[2,3], including DTI, T2, and morphology,but their relative contribution to the increasing muscle weakness with aging has not been investigated. The goal of this study is to implement a multiparametric protocol to study the muscles of the upper leg in (older)adults, and to exploit qMRI to evaluate the (combination of) imaging parameters that best explain the age-related loss in muscle strength.
Methods
MRI acquisition24 subjects (12 female, age 58±15y (30-79y)) were scanned at 3T (GE Healthcare) with the following parameters: Dixon TR=13.3ms, TE1=1.14ms, ETL=12, voxel size=1.76x1.76x6mm3, matrix size=256x256x42, NSA=1, DTI: TR=3500ms, TE=43ms, voxel size=3.6x3.5x6mm3, matrix size=126x126x42, water excitation+SSGR fat-suppression, 15 diffusion-encoding directions (b=400 mm2/s) + 3 non-diffusion-weighted volumes, NSA=3. T2 maps: MESE, TR=4000ms, 5.6<TE1<7.4ms, ETL=16, voxel size=1.76x1.76x6mm3, matrix size=256x256x21, 6mm slice gap, NSA=0.5. Every scan was repeated for two stacks, to completely cover the upper leg.
Data analysis
Volume and CSA: Muscle volume was calculated from 8 masks obtained through manual segmentation of the quadriceps (left and right) on the Dixon water images. The slice with the largest segmentation area was used to calculate quadriceps CSA.
FA and RD: diffusion volumes were denoised using patch2self[4] and non-rigidly registered to the Dixon water images. After tensor fitting, FA, RD, and the eigenvectors were determined.
Fiber tracking: DTI-derived eigenvectors were utilized for fiber tracking. Seed points were uniformly distributed in each muscle. High tract density[5] or high fat percentage were used as stopping criteria. Fiber length was calculated as the average length of each reconstructed tract within the quadriceps(Figure 2).
Muscle T2: T2 was estimated using a non-linear least square fitting procedure based on extended phase graph (EPG) formalism using a two-component model (water+fat)[6].
Strength measurements
Quadriceps strength was determined during isokinetic and isometric knee extension and flexion exercises using an isokinetic dynamometer (HumacNorm). The torque was calculated as the force generated during knee extension/flexion multiplied by the distance from the center of the knee and the point on the tibia where the dynamometer was applied.
Statistical analysis
Spearman rank correlations were calculated between all variables. All p-values were Sidak-adjusted for multiple comparisons. Univariate assessment of effects of variables on torque were tested by linear regression adjusted for clustering between subjects. Multivariable assessment of effects of variables on torque were tested by a mixed-effect regression, with random intercepts of subjects and random slopes of velocity level. A p-value<0.05 was considered significant.
Results
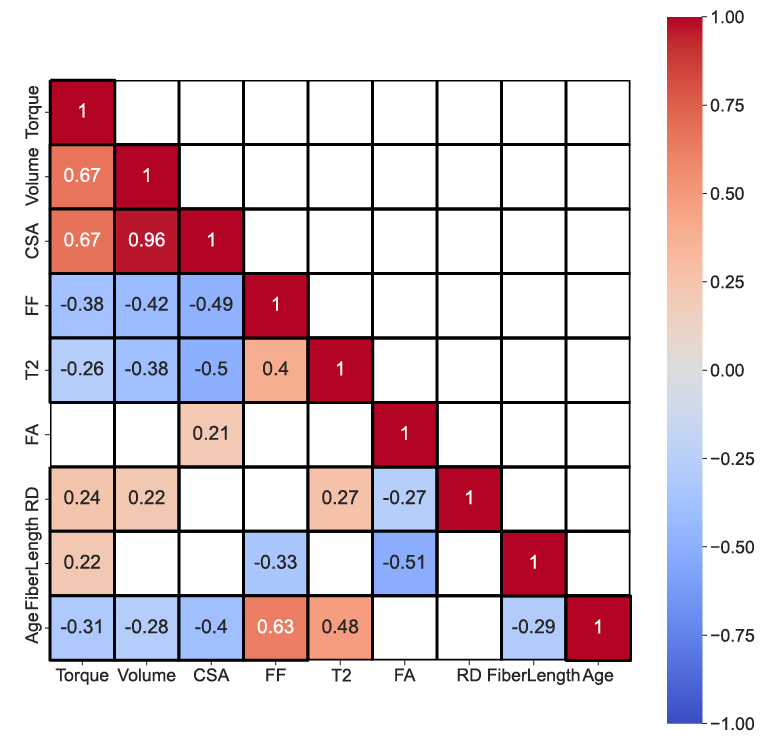
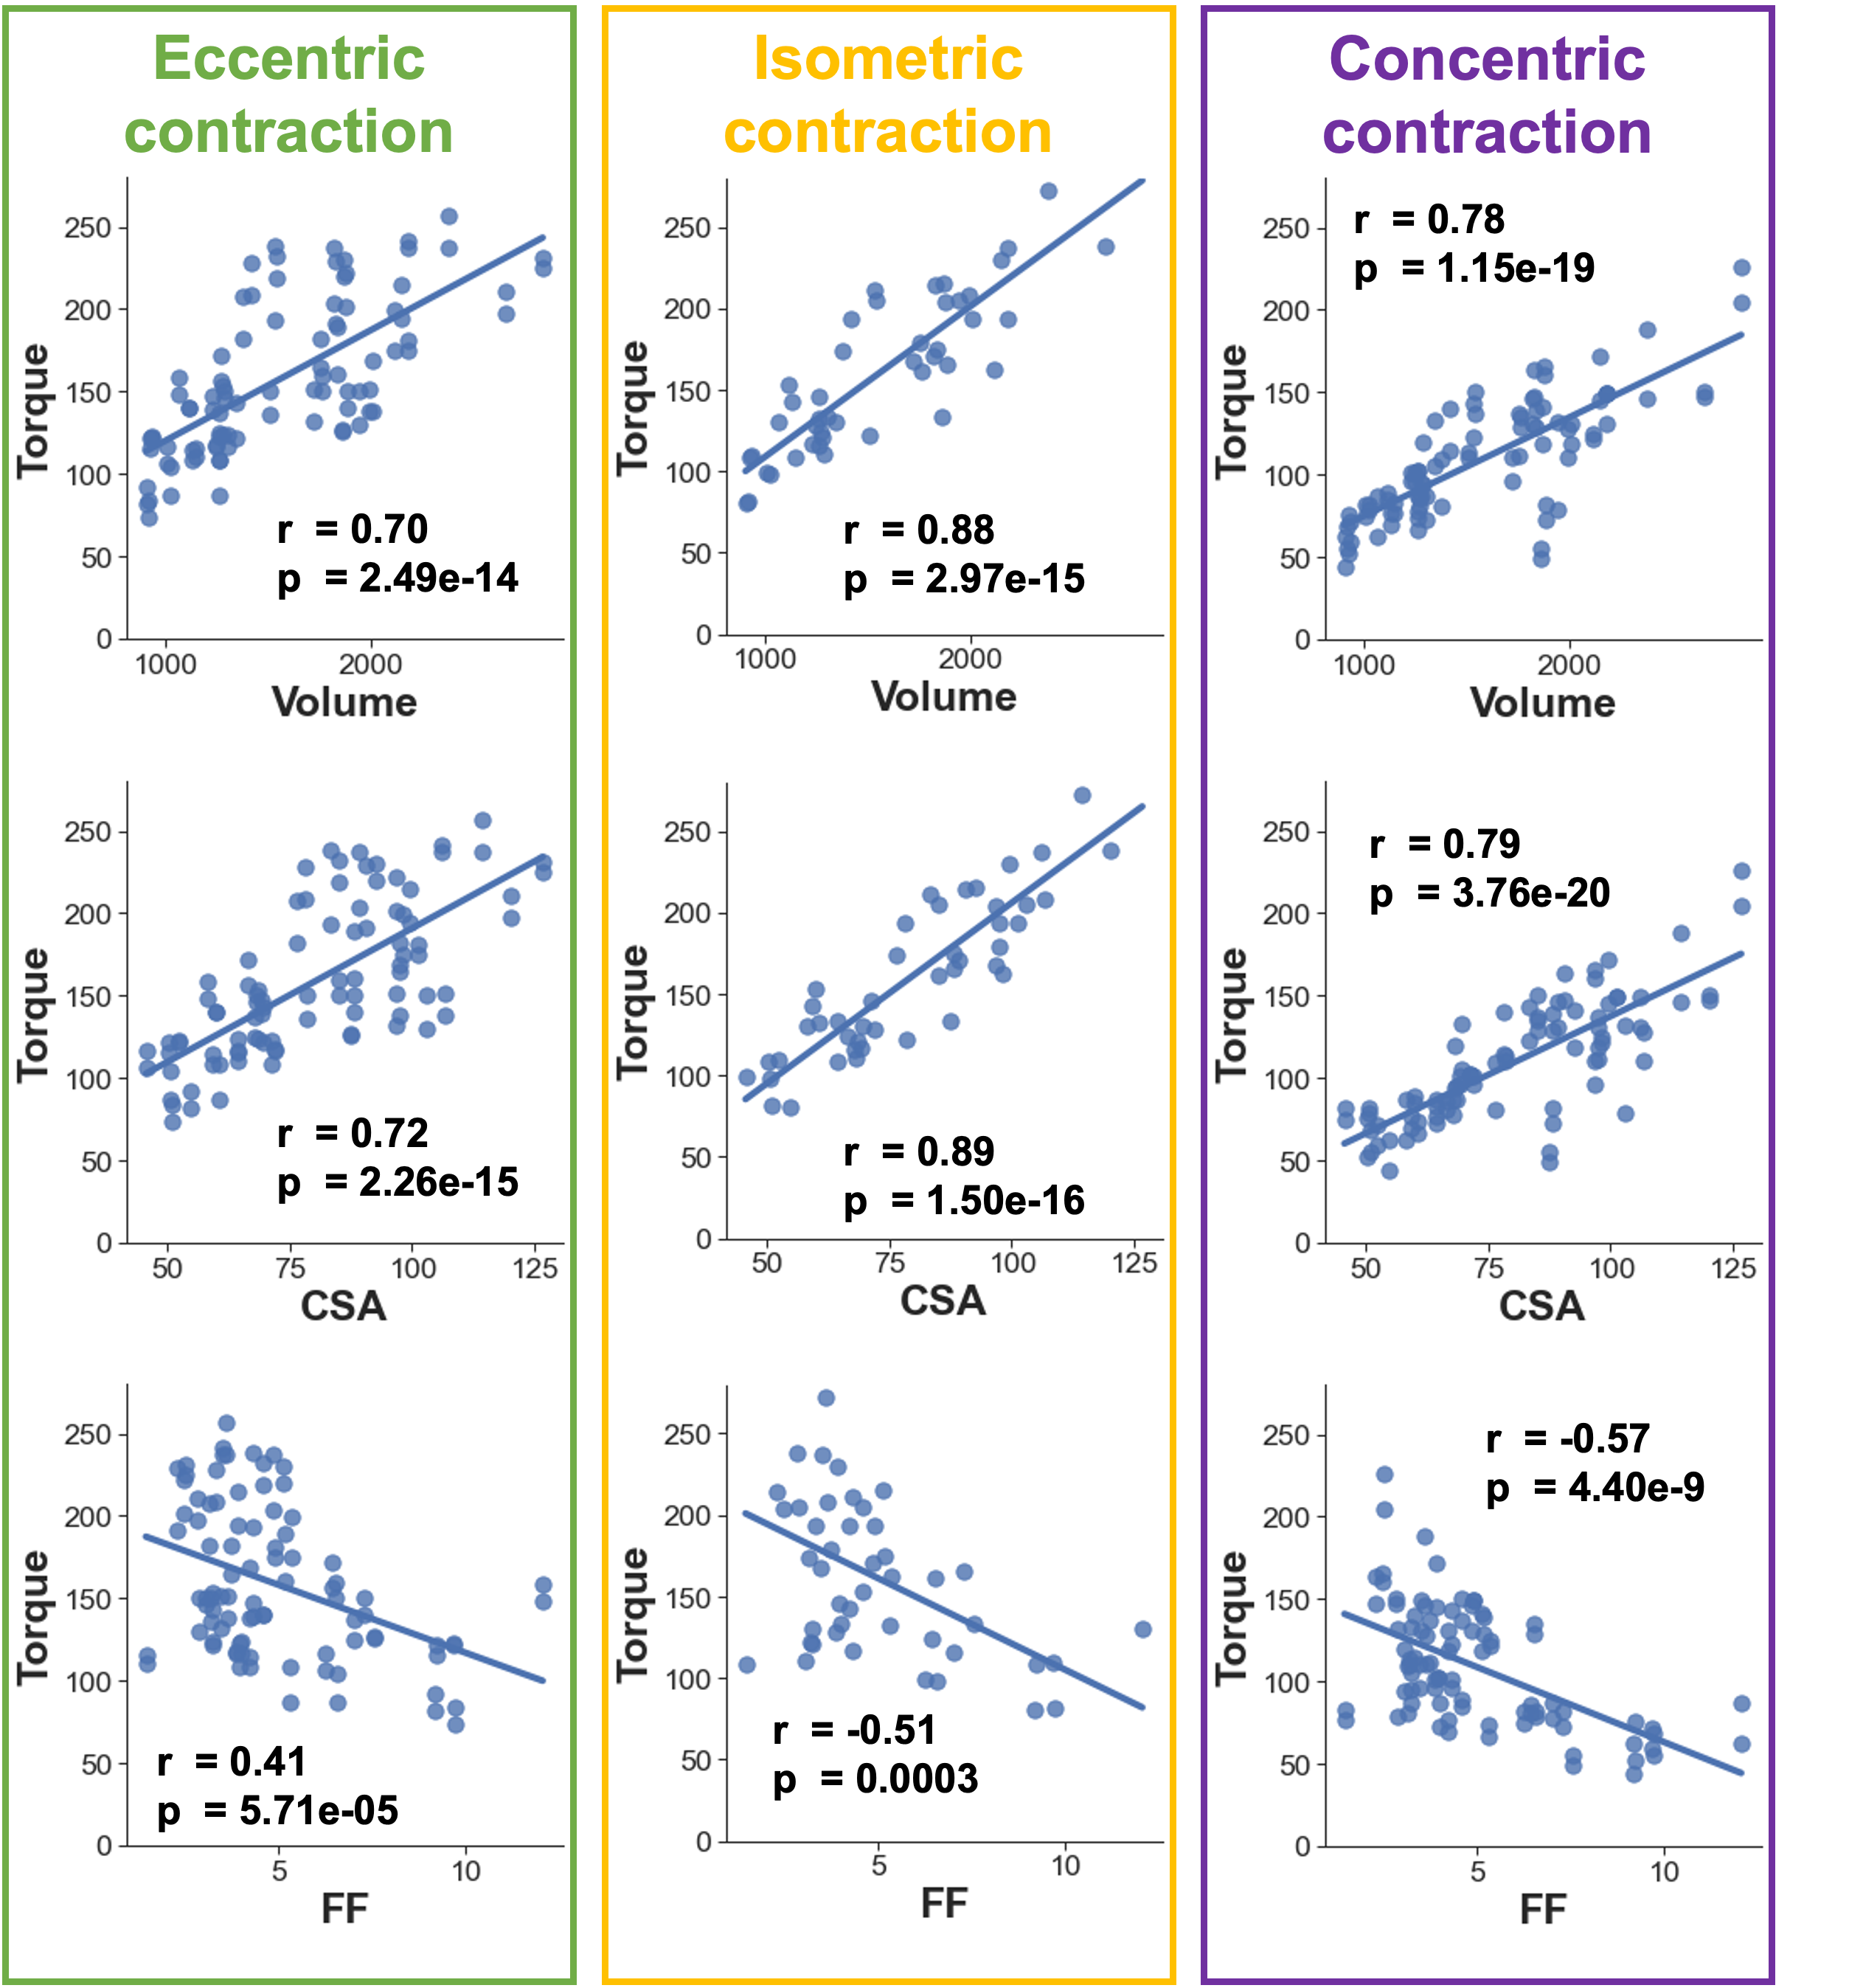
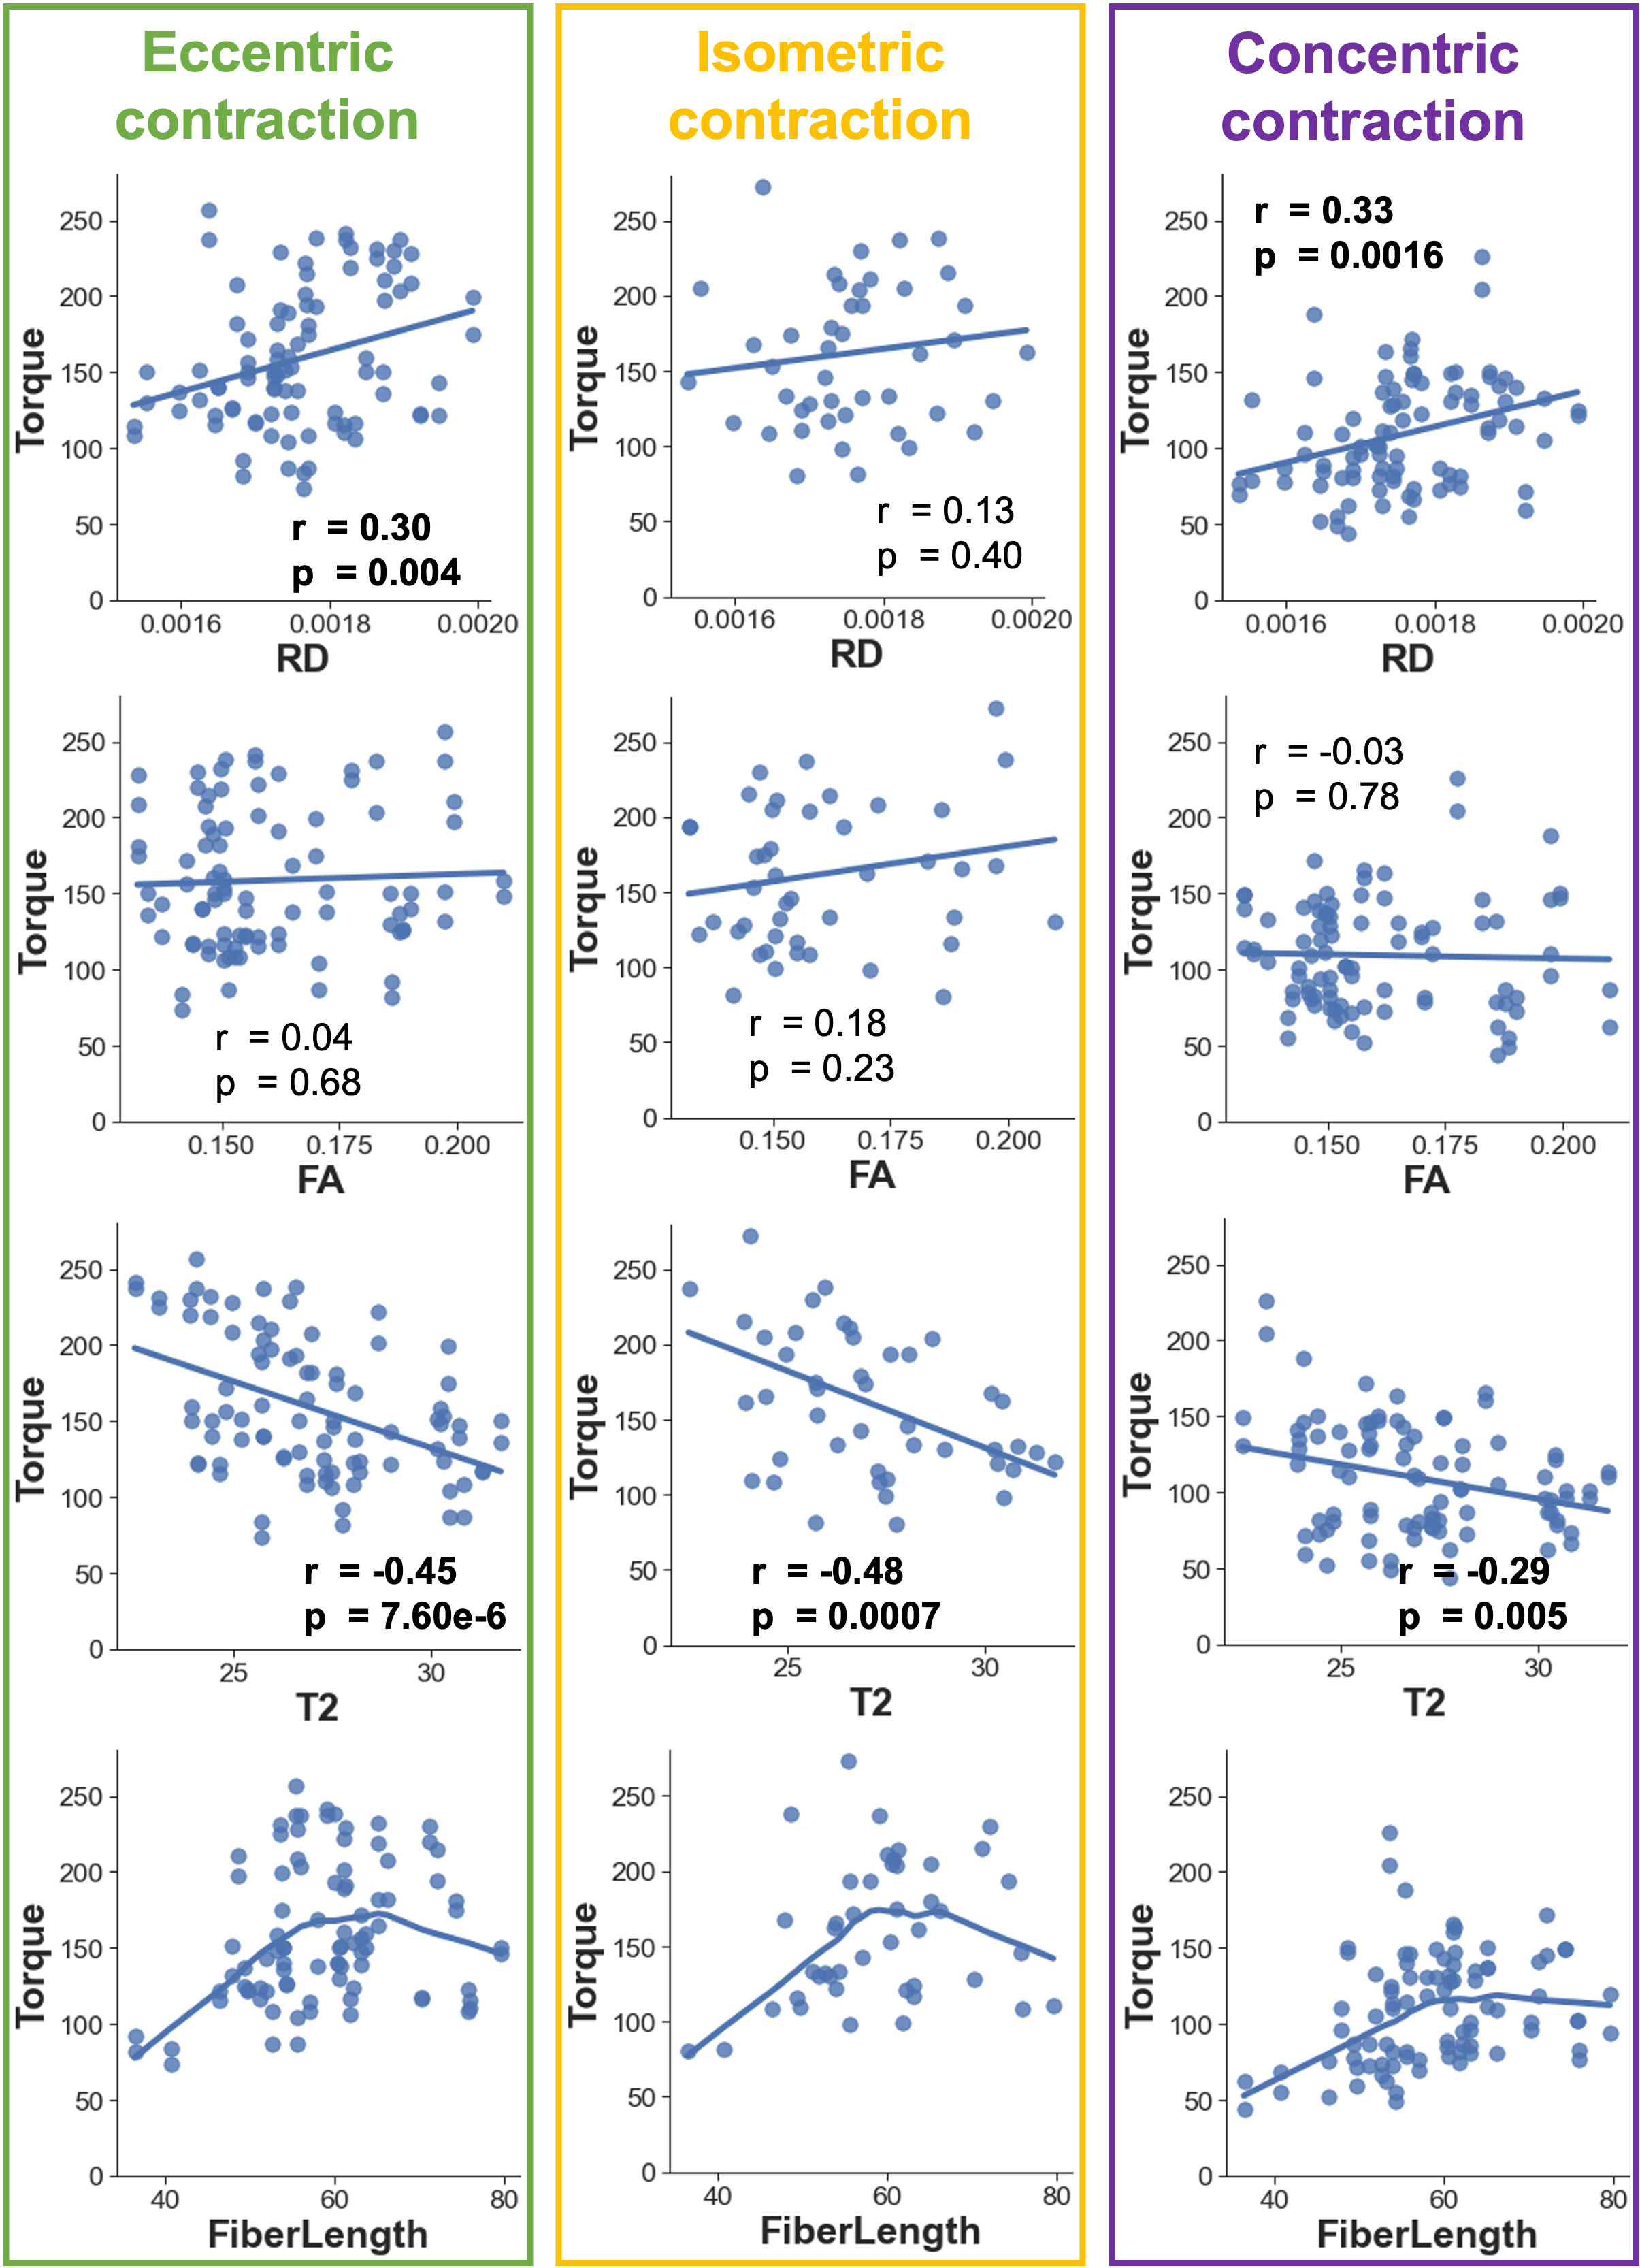
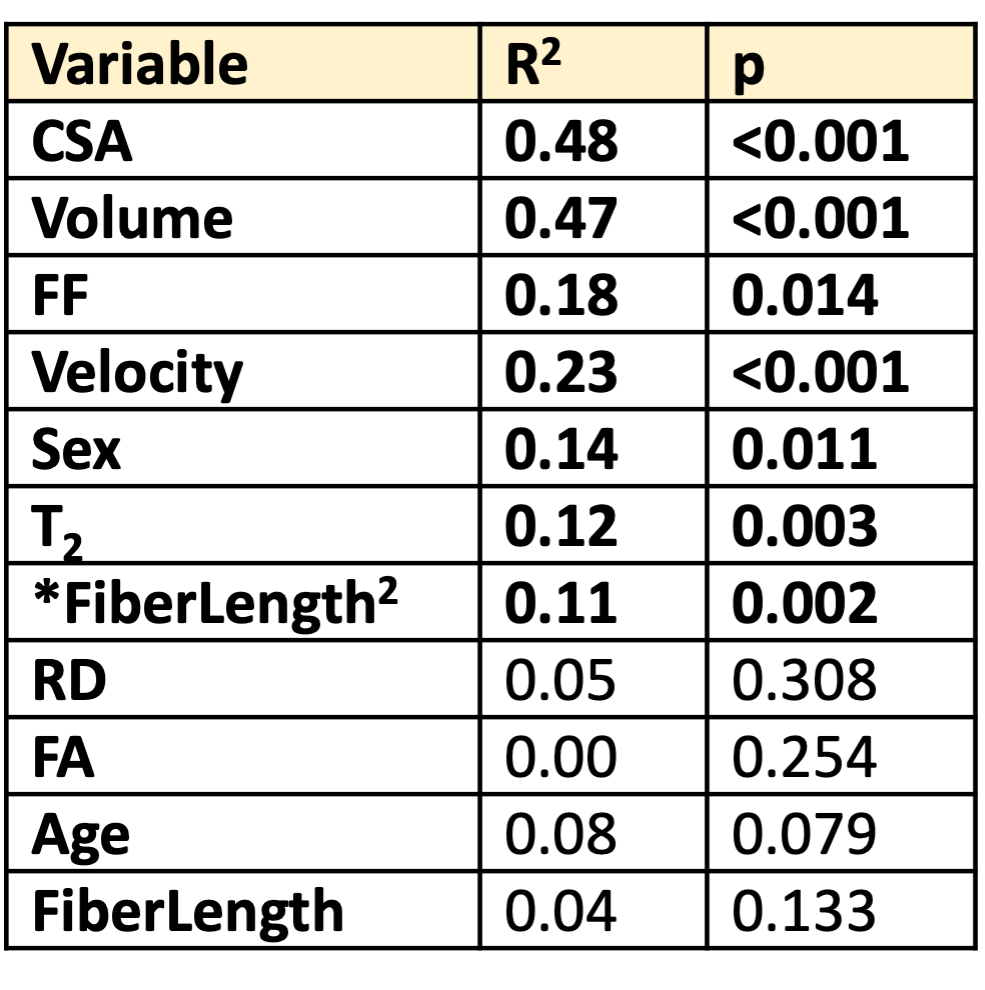
Increasing age was associated with lower torque, volume, and CSA, and shorter fibers, together with higher FF and higher T2(Figure 2). These parameters showed a weak/moderate correlation with torque(Figure 3,4).Loss of muscle volume (or CSA) was the strongest univariate predictor of loss in torque(Figure 5).In a multivariate analysis, torque was positively correlated with CSA (p<0.001) with significantly lower slope for concentric than for isometric or eccentric strength (p=0.008). Torque was negatively correlated with FA (p<0.001). The best model for torque prediction was CSA+FA (R2=0.72) or CSA+RD (R2=0.71). Sex did not improve torque prediction(p=0.22).Discussion
Our qMRI results showed increasing T2 and FF, and decreasing RD and fiber length with age, in agreement with previous studies[2,3,7]. Interestingly, despite their moderate correlation with torque, FF and T2 did not improve the model for torque prediction.The inclusion of FA greatly improved the prediction of torque (R2=0.72) over CSA or volume alone (R2=0.47). Increased FA and decreased RD have been associated with lower proportion of type2 muscle fibers[8], which could explain the lower torque measured in this study. Previous studies, using invasive muscle biopsies, showed that the loss of muscle fibers and the selective atrophy of type2 fibers are the main determinants of the overall weakness in aging, which is in agreement with our findings.Lastly, since CSA seems to provide similar information as volume, it might be possible in the future to shorten scan time by only scanning a stack in the middle of the leg, instead of the entire leg.In conclusion, we have shown that qMRI can provide complementary information to morphology for torque prediction, and might identify compositional changes responsible for muscle weakness.Acknowledgements
No acknowledgement found.References
1. McPhee, J.S., et al., The Contributions of Fiber Atrophy, Fiber Loss, In Situ Specific Force, and Voluntary Activation to Weakness in Sarcopenia. J Gerontol A Biol Sci Med Sci, 2018. 73(10): p. 1287-1294.
2. Farrow, M., et al., The effect of ageing on skeletal muscle as assessed by quantitative MR imaging: an association with frailty and muscle strength. Aging Clin Exp Res, 2021. 33(2): p. 291-301.
3. Cameron, D., et al., Age-related changes in human skeletal muscle microstructure and architecture assessed by diffusion-tensor magnetic resonance imaging and their association with muscle strength. Aging Cell, 2023. 22(7): p. e13851.
4. Garyfallidis, E., et al., Dipy, a library for the analysis of diffusion MRI data. Front Neuroinform, 2014. 8: p. 8.
5. Oudeman, J., et al., A novel diffusion-tensor MRI approach for skeletal muscle fascicle length measurements. Physiol Rep, 2016. 4(24).
6. Marty, B., et al., Simultaneous muscle water T2 and fat fraction mapping using transverse relaxometry with stimulated echo compensation. NMR Biomed, 2016. 29(4): p. 431-43.
7. Azzabou, N., J.Y. Hogrel, and P.G. Carlier, NMR based biomarkers to study age-related changes in the human quadriceps. Exp Gerontol, 2015. 70: p. 54-60.
8. Scheel, M., et al., Fiber type characterization in skeletal muscle by diffusion tensor imaging. NMR Biomed, 2013. 26(10): p. 1220-4.
Figures