1533
Calf muscle compartmental T1, T2, T1ρ, and Fat Fraction associations with Muscle Function in Patients with Heart Failure1Biomedical Engineering, Cleveland Clinic, Cleveland, OH, United States, 2Cardiovascular Medicine, Cleveland Clinic, Cleveland, OH, United States
Synopsis
Keywords: Muscle, Muscle, Multiparametric, relaxometry, biomarkers, fat
Motivation: Skeletal muscle degeneration (sarcopenia) is more prevalent in patients with heart failure (HF) than the general population and is associated with worsened outcomes. However, HF-associated muscle degeneration remains incompletely understood.
Goal(s): To evaluate quantitative MRI in calf muscle compartments of HF patients and to investigate associations with function and overall condition.
Approach: Relaxometric (T1/T2/T1ρ) and proton density fat fraction (PDFF) measures were obtained in calf muscle compartments of patients with HF. Functional and survey measures were obtained. Correlation analyses between all measures were performed.
Results: Relaxometry and PDFF correlated with muscle function but differed by muscle compartment, suggesting heterogeneous changes as function declines.
Impact: Quantitative MRI, including relaxometry and fat fraction as complementary measures, may detect muscle compartmental changes in heart failure associated sarcopenia. Characterization of degradation in patients’ specific muscle compartments may provide insight to the degenerative process and targets for intervention.
Introduction
Sarcopenia, the loss of skeletal muscle mass and function, occurs in a higher proportion of heart failure (HF) patients (31%) as compared to the general population (6-12%)1 and is independently associated with poorer clinical outcomes.2 While the loss of muscle in the HF population is well-documented, the connection between HF and sarcopenia is not yet fully understood and may be influenced by many factors.Quantitative MRI can be used as a noninvasive tool to investigate changes in skeletal muscle quality relevant to sarcopenia evaluation. Proton density fat fraction (PDFF) can quantify the degree of fatty infiltration in muscle, where fat is elevated in the muscle of sarcopenic patients.3 Relaxometry can complement PDFF, as it has been reported to relate to inflammation (T2),4 muscle fiber type proportion (T1ρ),5 and extracellular space expansion (T1).6 Given the complex changes that occur in muscle tissues, it is unlikely that a single quantitative MRI property can adequately characterize the tissue alterations that accompany HF-associated sarcopenia. Furthermore, it is likely that muscle compartments are impacted differently given their compositional and functional properties (e.g. fiber type proportion, biomechanics).
In this preliminary analysis of an ongoing study, we investigate associations between quantitative MRI of calf muscle compartments, muscle function, and survey measures of sarcopenia and HF quality of life in patients with HF.
Methods
The study consisted of functional testing, surveys, and a calf muscle MRI of study participants. N=8 patients with an existing HF diagnosis were included. Functional testing comprised 6-minute walk test (6MWT) and grip strength test. Surveys included the five-item sarcopenia questionnaire (SARC-F)7 to assess sarcopenia severity and the twelve-item Kansas City Cardiomyopathy Questionnaire (KCCQ-12)8 to assess HF-associated overall quality of life. MRI included a calf muscle scan in the patient-indicated dominant leg.MRI data were acquired on a 3T scanner using a knee coil (Prisma, Siemens). The protocol consisted of an axial T1-weighted turbo spin echo scan to determine the largest muscle cross-section to be used for quantitative MRI evaluation. Quantitative sequences consisted of inversion recovery turbo spin echo (T1), fat-suppressed magnetization prepared MAPSS (T2, T1ρ), and monopolar gradient 6-point Dixon (PDFF). Quantitative maps were computed using Matlab-based software for voxelwise curve fitting (T1, T2, T1ρ) and FattyRiot software for magnitude image-based processing.9
Data analysis consisted of measuring muscle compartment quantitative MRI values and correlation analysis with all MRI, functional, survey measures. Muscle compartments consisted of the soleus (SOL, gastrocnemius lateral and medial heads (GL, GM), tibialis anterior (TA), deep flexors (DF), flexor hallucis longus (FHL), and lateral compartment (LC).10 Muscle compartments were manually segmented to obtain average PDFF, T1, T2, and T1ρ values. Correlation analysis was performed to explore associations between muscle function, survey, and MRI measurements.
Results
Patient characteristics and measures from functional testing, surveys, and MRI are shown in Table 1. Example quantitative maps are shown in Figure 1 for three patients spanning the range of observed function and HF severity. Heterogeneity of quantitative MRI between muscle compartments appears to increase as muscle function and HF severity worsens. Correlation analyses showed significant correlation of quantitative MRI in some compartments with muscle function, e.g. LC PDFF, T2, and T1ρ with 6MWT distance. Trends were observed in other compartments, but associations were not strong enough to reach statistical significance. Some correlations between quantitative metrics were consistently observed, such as between PDFF, T2, and T1ρ, whereas others were not, such as T1 vs T2 and T1ρ.Discussion
In this preliminary analysis of an ongoing study of HF patients, quantitative MRI measurements of muscle compartments were observed to have heterogeneous associations with muscle function and HF-related quality of life. PDFF had the strongest correlation with function and quality of life related surveys (6MWT distance, SARC-F, KCCQ-12 score), but associations differed substantially across muscle compartments. No quantitative MRI measurements had significant correlation with grip strength, however, T1, T2 and T1ρ suggest inverse relationships with grip strength that may be significant if studied in a larger sample size. Strong correlations between PDFF, T2, and T1ρ may be explained by concomitant fatty infiltration, inflammation, and fiber type transition. The inverse correlation of T1 with PDFF is expected by the known T1 lowering effect of fatty infiltration, although the non-uniformity across muscle compartments may suggest T1 is being influenced by other tissue compositional features such as fluid accumulation that would increase T1. While the number of cases are limited, observations suggest that the relationship between HF-associated muscle degeneration and quantitative MRI may be heterogeneous across muscle compartments and warrant multiparametric evaluation.Acknowledgements
This work was funded in part by the following sources: NIH/NIAMS T32AR007505, NIH/NIA K25AG070321, and the Cleveland Clinic PAMI Pilot Project Program. The content is solely the responsibility of the authors and does not necessarily represent the official views of the NIH.
References
1. Chen R, Xu J, Wang Y, et al. Prevalence of sarcopenia and its association with clinical outcomes in heart failure: An updated meta-analysis and systematic review. Clin Cardiol. 2023;46(3):260-268. doi:10.1002/clc.23970
2. Mirzai S, Eck BL, Chen PH, Estep JD, Tang WHW. Current Approach to the Diagnosis of Sarcopenia in Heart Failure: A Narrative Review on the Role of Clinical and Imaging Assessments. Circ Heart Fail. 2022;15(10):e009322. doi:10.1161/CIRCHEARTFAILURE.121.009322
3. Grimm A, Meyer H, Nickel MD, et al. Repeatability of Dixon magnetic resonance imaging and magnetic resonance spectroscopy for quantitative muscle fat assessments in the thigh. J Cachexia Sarcopenia Muscle. 2018;9(6):1093-1100. doi:10.1002/jcsm.12343
4. Yao L, Yip AL, Shrader JA, et al. Magnetic resonance measurement of muscle T2, fat-corrected T2 and fat fraction in the assessment of idiopathic inflammatory myopathies. Rheumatol Oxf Engl. 2016;55(3):441-449. doi:10.1093/rheumatology/kev344
5. Peng XG, Wang Y, Zhang S, et al. Noninvasive assessment of age, gender, and exercise effects on skeletal muscle: Initial experience with T1ρ MRI of calf muscle. J Magn Reson Imaging. 2017;46(1):61-70. doi:10.1002/jmri.25546
6. Huber AT, Lamy J, Bravetti M, et al. Comparison of MR T1 and T2 mapping parameters to characterize myocardial and skeletal muscle involvement in systemic idiopathic inflammatory myopathy (IIM). Eur Radiol. 2019;29(10):5139-5147. doi:10.1007/s00330-019-06054-6
7. Ida S, Kaneko R, Murata K. SARC-F for Screening of Sarcopenia Among Older Adults: A Meta-analysis of Screening Test Accuracy. J Am Med Dir Assoc. 2018;19(8):685-689. doi:10.1016/j.jamda.2018.04.001
8. Spertus JA, Jones PG. Development and validation of a short version of the Kansas City Cardiomyopathy Questionnaire. Circ Cardiovasc Qual Outcomes. 2015;8(5):469-476.
9. Comparative review of algorithms and methods for chemical‐shift‐encoded quantitative fat‐water imaging - Daudé - Magnetic Resonance in Medicine - Wiley Online Library. https://onlinelibrary.wiley.com/doi/full/10.1002/mrm.29860. Accessed November 7, 2023.
10. Heikkinen J, Lantto I, Flinkkila T, et al. Soleus Atrophy Is Common After the Nonsurgical Treatment of Acute Achilles Tendon Ruptures: A Randomized Clinical Trial Comparing Surgical and Nonsurgical Functional Treatments. Am J Sports Med. 2017;45(6):1395-1404. doi:10.1177/0363546517694610
Figures
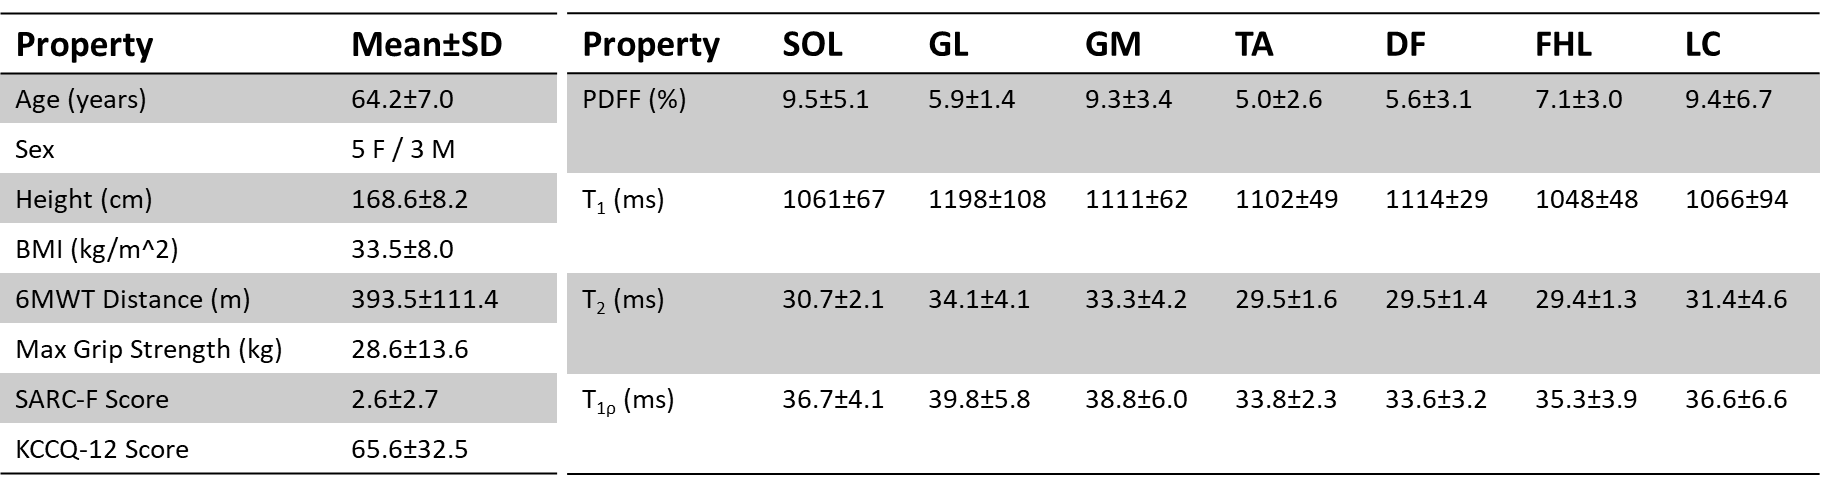
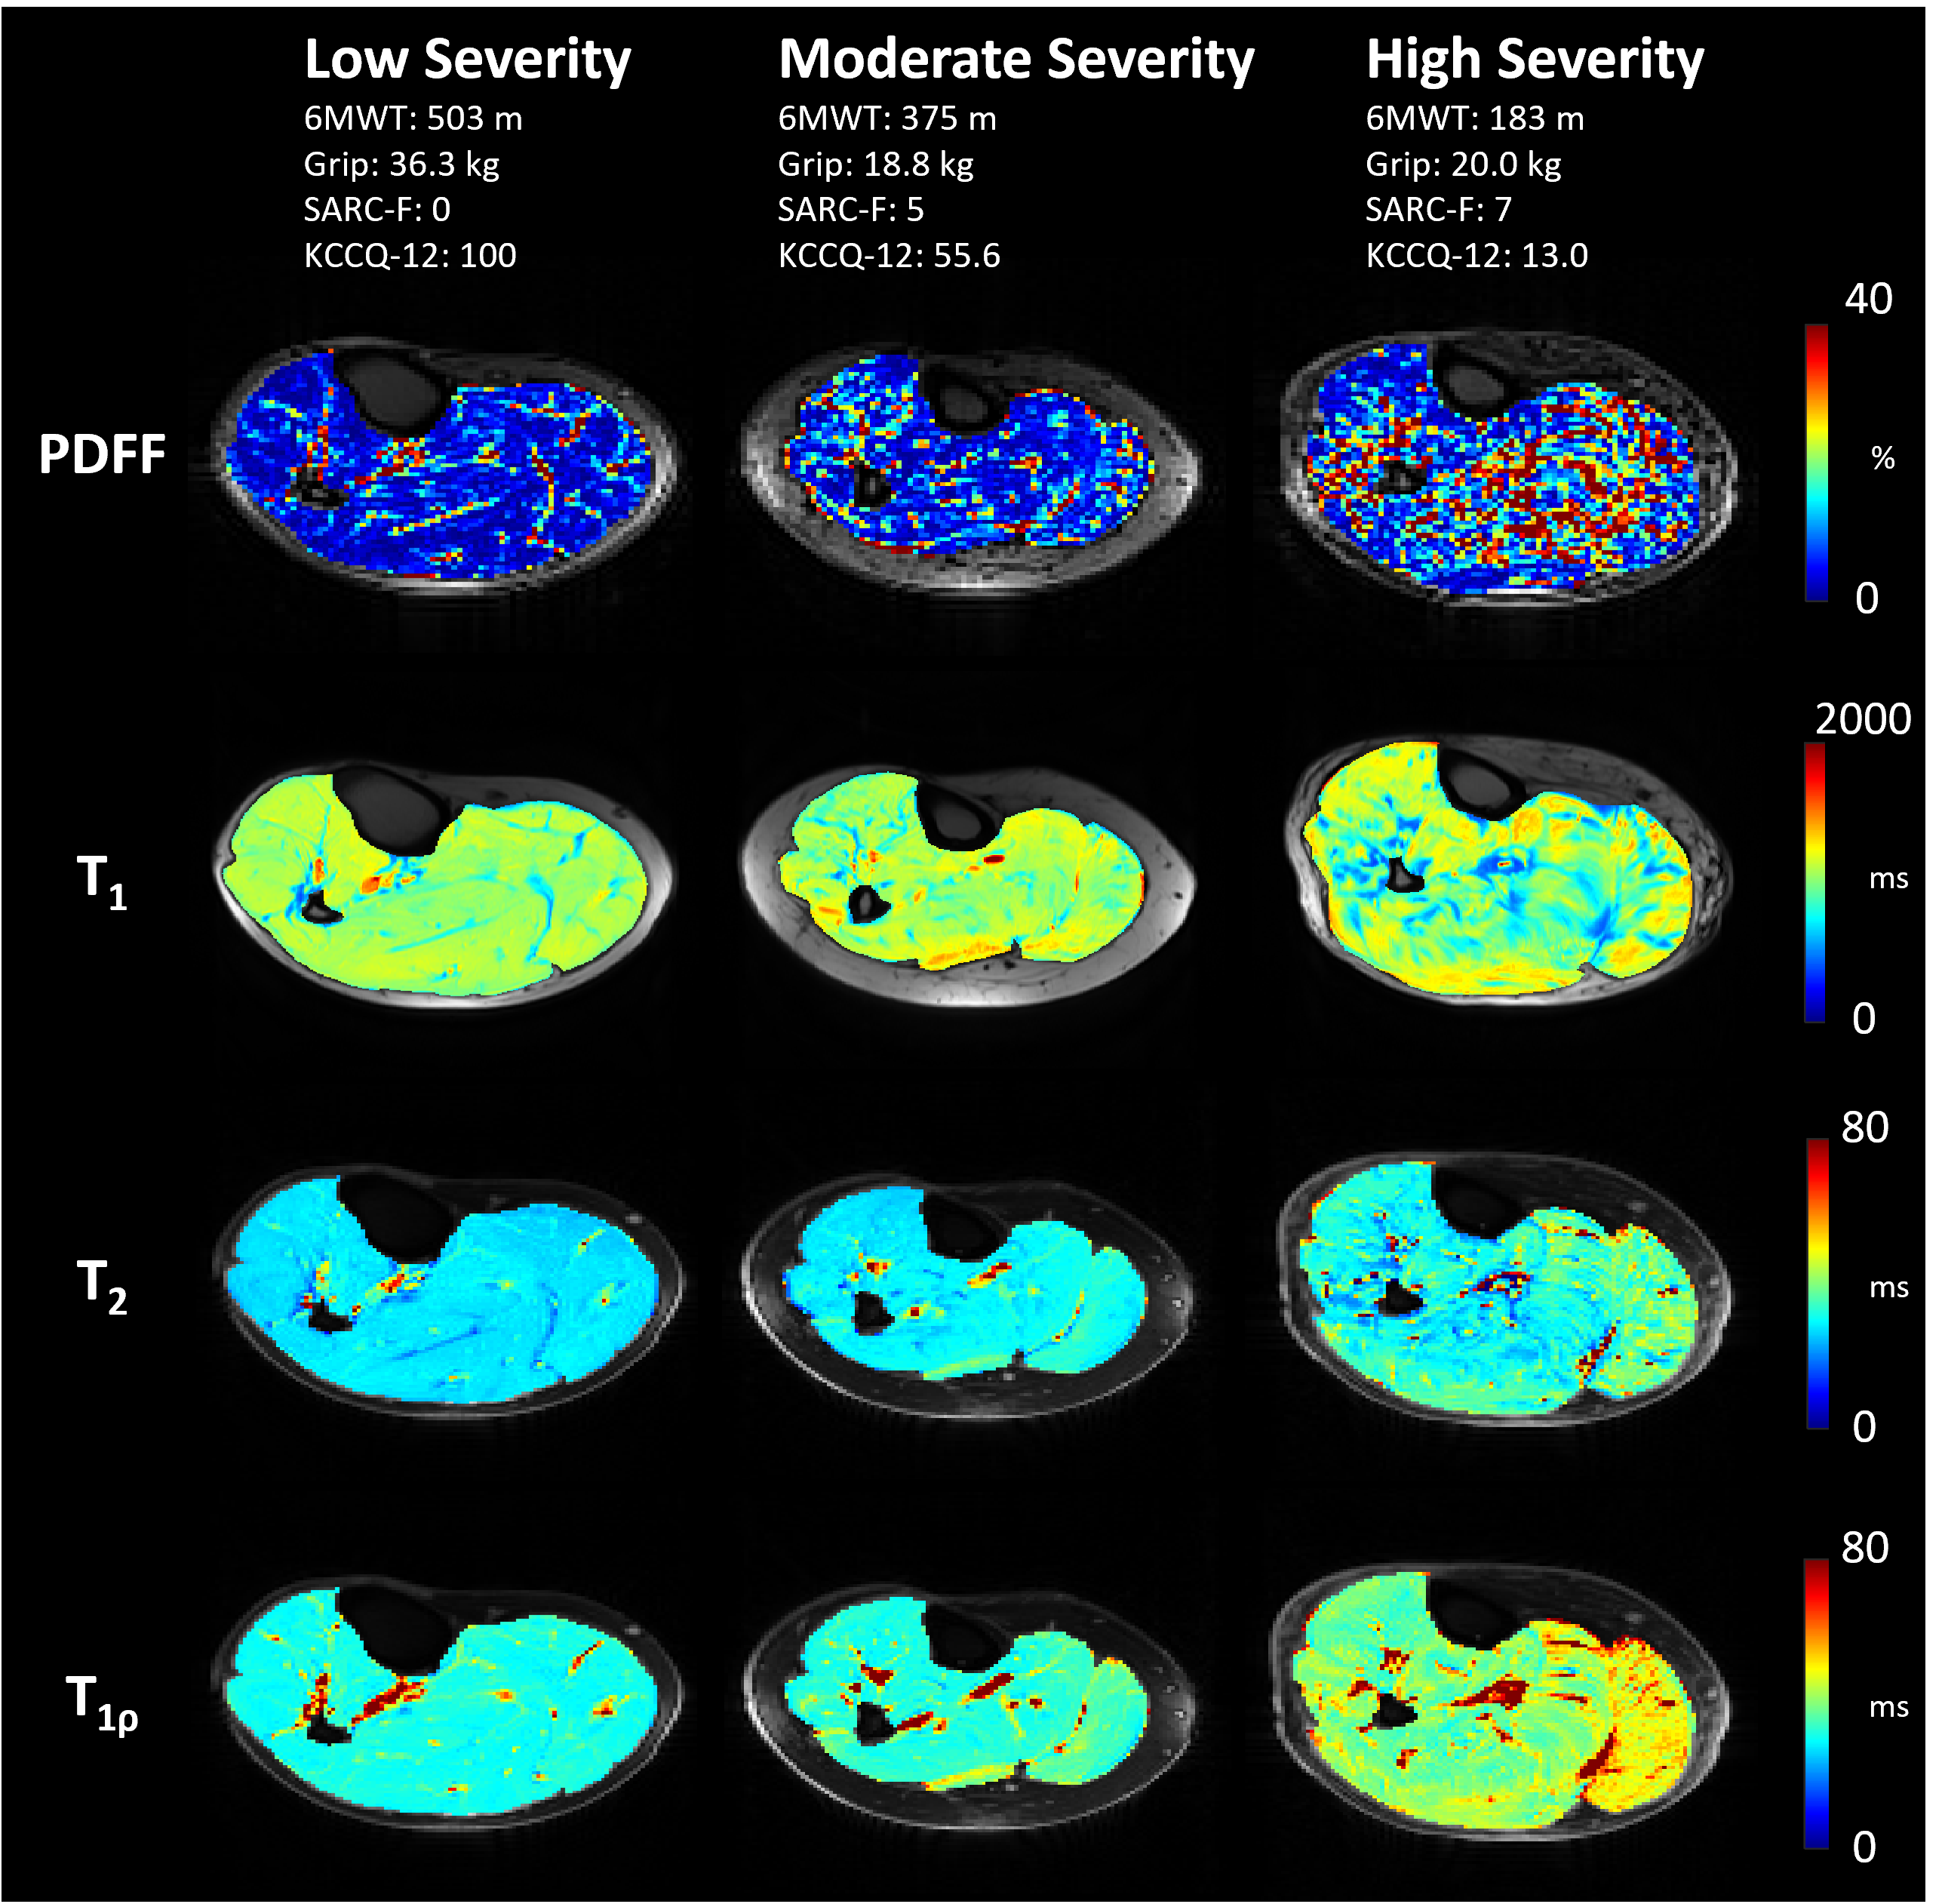
Figure 1. Example quantitative MRI maps of three patients with heart failure (HF). The left column is a patient with an overall low severity of muscle dysfunction, the middle column is a patient with moderate severity dysfunction, and the right column is a patient with severe dysfunction. Proton density fat fraction (PDFF), T1, T2, and T1ρ relaxation time maps are shown. Note the increased heterogeneity across muscle compartments in quantitative maps as muscle degradation is more severe.
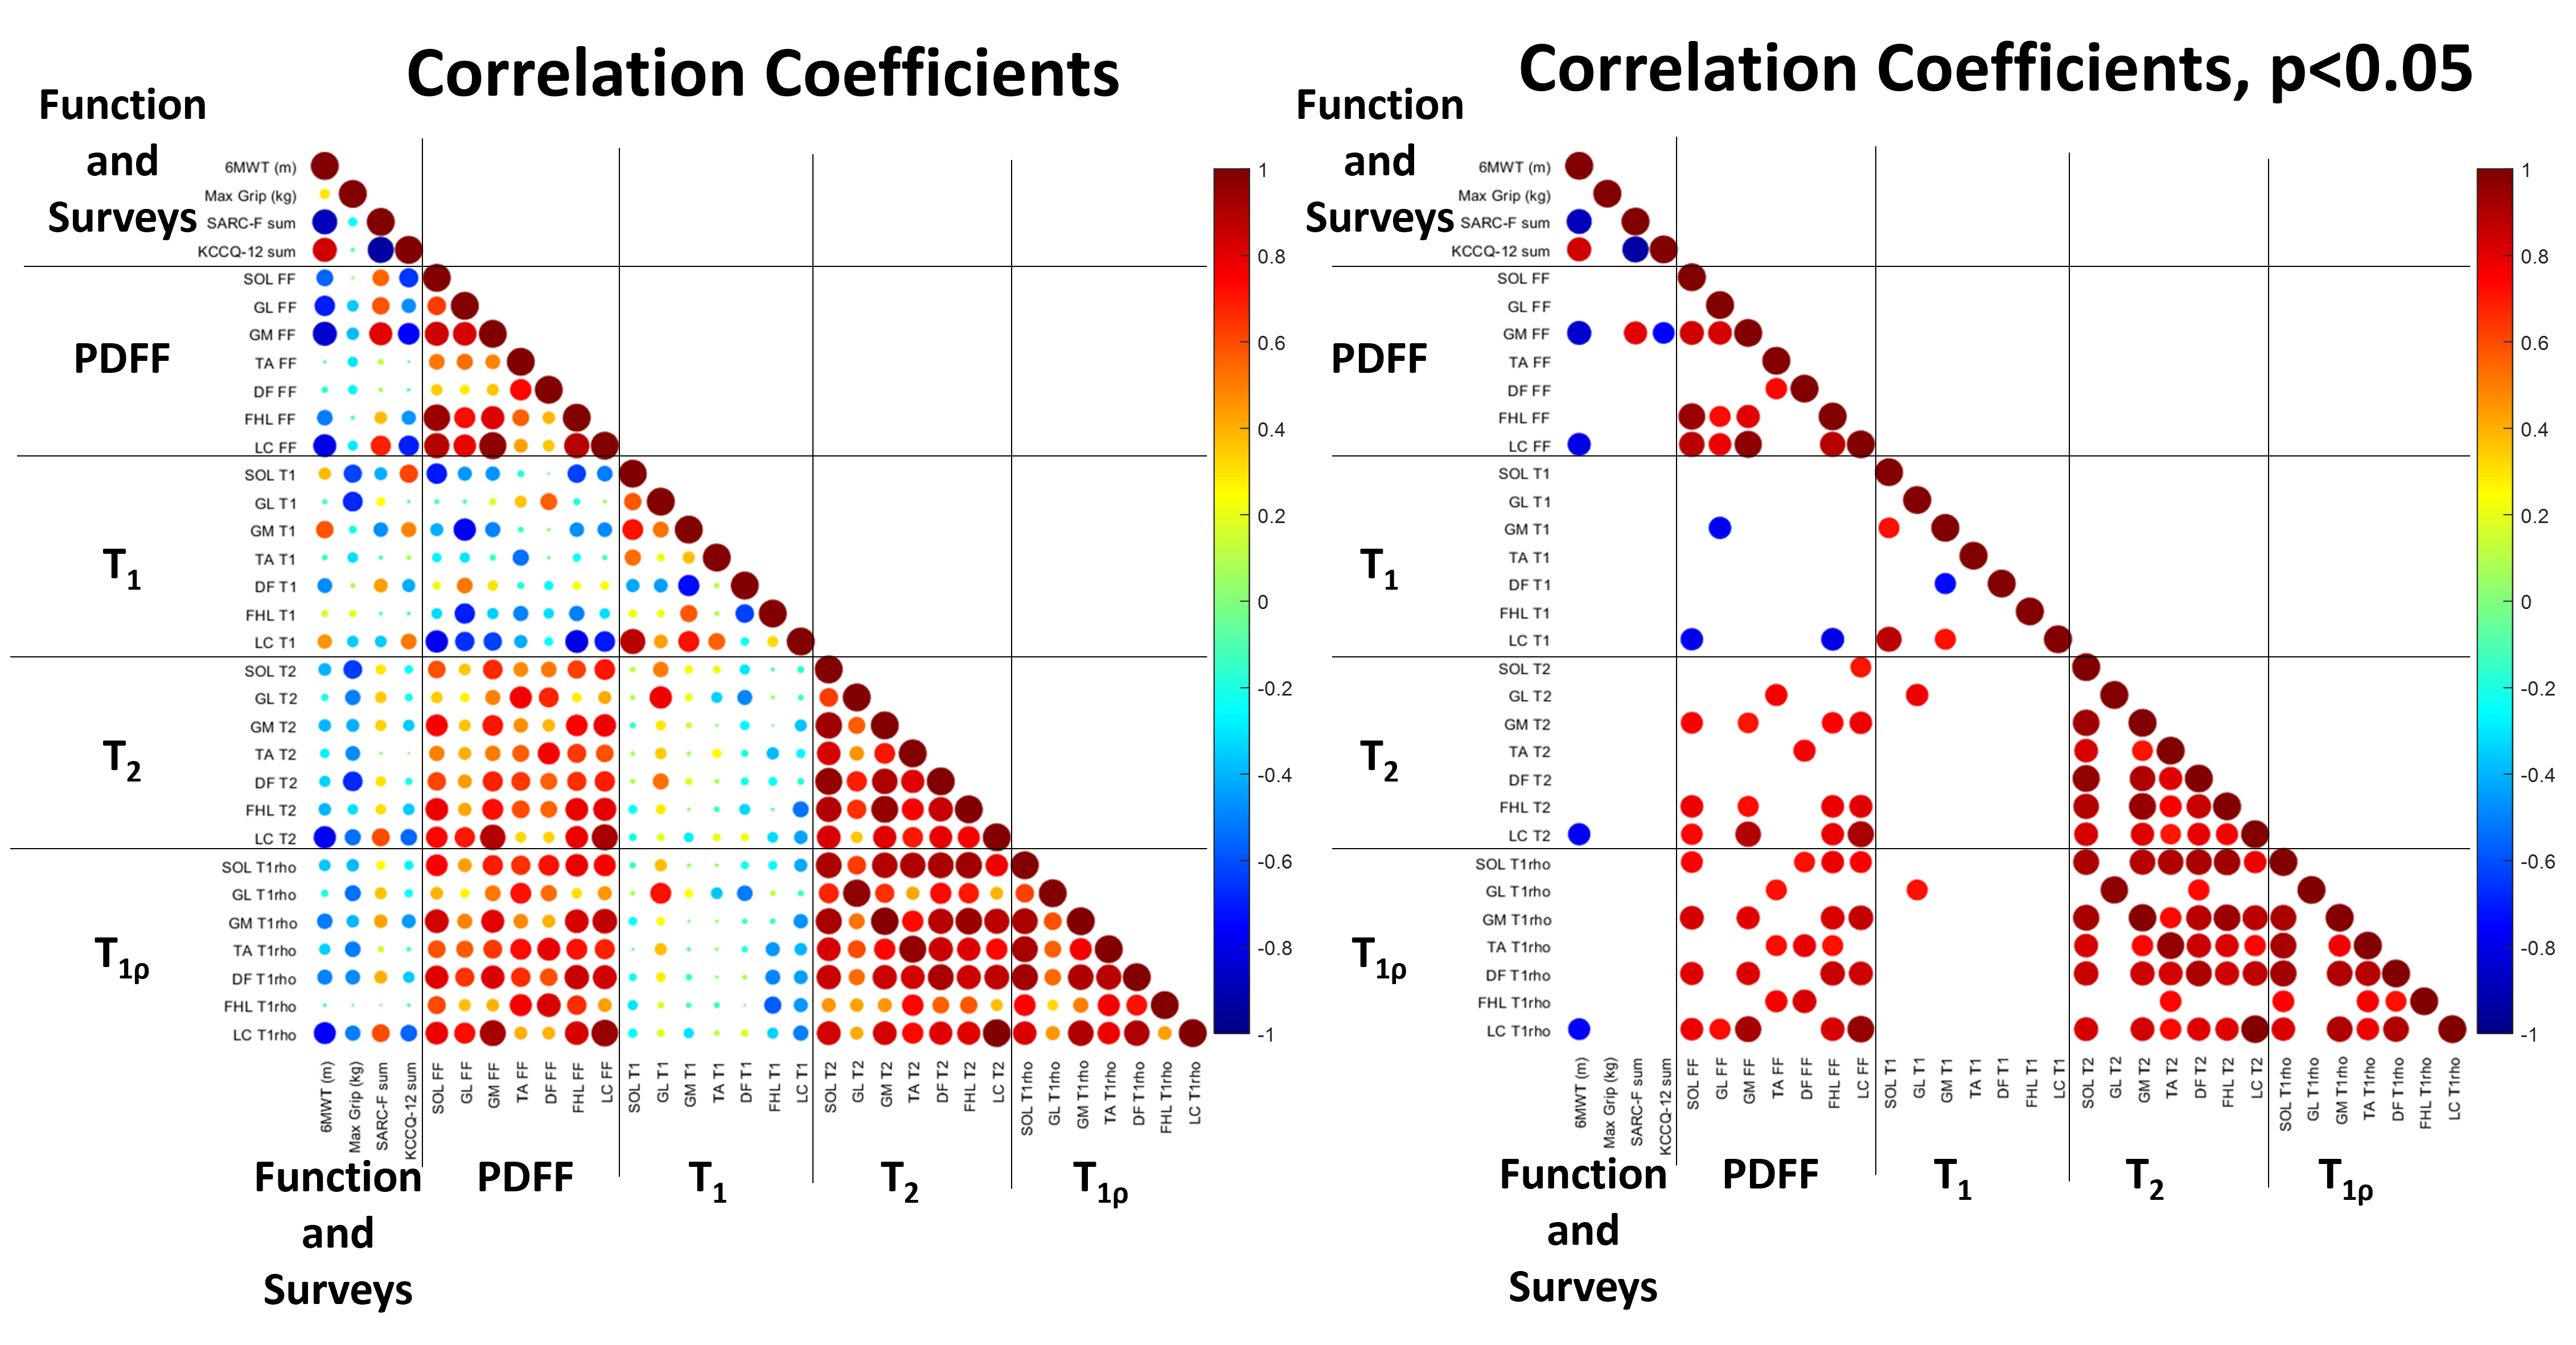
Figure 2. Correlation coefficients for muscle function and quantitative MRI measurements of muscle compartments. (Left) Correlation coefficient values for all comparisons. (Right) Correlation coefficient values for statistically significant correlations at p<0.05 (N=8 patients). Size of each circle indicates correlation magnitude and color indicates correlation coefficient value. PDFF, T2, and T1ρ tend to increase with degraded function, although muscle compartments differ in strength of the association, potentially due to heterogeneity of muscle changes.