1532
Comparison of water T1 and T2 dynamics in lower extremity muscles under cuff compression paradigm1NMR Laboratory, Neuromuscular Investigation Center, Institute of Myology, Paris, France
Synopsis
Keywords: Muscle, MSK
Motivation: Water-T2 (T2H2O) is a frequently used biomarker of neuromuscular active muscle damage. Complementarity with water-T1 (T1H2O) has been recently suggested, with significant correlations found between T1H2O and T2H2O values in subject with different neuromuscular disorders.
Goal(s): In this work, we aimed to explore the behavior of these two biomarkers in the calf muscles of healthy volunteers under different physiological conditions.
Approach: T1H2O and T2H2O were measured under different vascular filling conditions expected to modify muscle extracellular volume.
Results: There was a significant correlation between T1H2O and T2H2O values in all conditions.
T1H2O and T2H2O variations correlated only between the draining and recovery condition.
Impact: Water relaxation times T1H2O and T2H2O were measured in the calves of volunteers under different vascular filling conditions. Their distinct behavior suggests that these two biomarkers are complementary in the study of neuromucular diseases.
Introduction
Quantitative muscle MRI is a robust tool to monitor patients with neuromuscular disorders. In clinical trials, the intramuscular fat fraction (FF) and water-T2 relaxation time (T2H2O) are typically used as imaging biomarkers of disease severity and active muscle damage, respectively (1). More recently, some studies have also investigated the relevance of water-T1 (T1H2O) measurement, in view of the use of T1 as a biomarker in cardiac imaging (2). Significant correlations were found between T1H2O and T2H2O values in subject with different neuromuscular disorders. T1 might even provide more reliable indicators in muscles with such a significant increase in T2H2O that it approach fat-T2 values, rendering T2-relaxation based separation inaccurate (3). However, it is still unclear to what extent the two biomarkers T2H2O and T1H2O are sensitive to the same underlying physiological mechanisms, notably the influence of a change in extracellular compartment fraction. In this work, we aimed to explore the behavior of these two biomarkers in the calf muscles of healthy volunteers under different physiological conditions.Methods
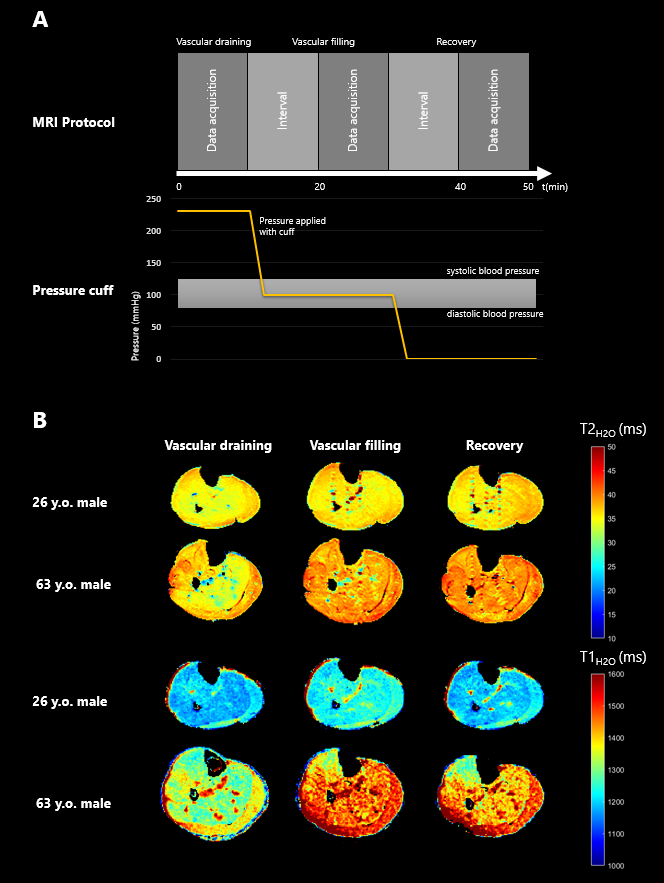
Acquisitions were performed at 3T (Magnetom PrismaFit, Siemens Healthineers, Germany) using a 15-channel knee coil on the right leg of seven healthy volunteers. The acquisition protocol consisted of a multi-TE MSME sequence (17TE from 6.5 to 161.5ms, 5 slices, Tacq = 3min05s), adjusted by a 3-exponential model to extract T2H2O(4), a radial MRF sequence (variable TE, TR, FA, 5 slices, Tacq = 50s) from which T1H2O was measured (2) and a 3D multi-TE GRE sequence (3 TEs, 48 slices, Tacq = 48s) from which 3-point Dixon was applied to extract FF(5). For all sequences, FOV was 170x170 mm2 and in plane resolution 1.3x1.3 mm2.This series of acquisitions was repeated under three different vascular conditions: draining, filling and recovery (Figure 1-A). 1/ Vascular draining was obtained using an Esmarch bandage and a transient ischemia of the lower limb by a blood pressure cuff placed above the knee and inflated to 230 mmHg, above the systolic pressure to block both the arterial inflow and the venous outflow. 2/ Vascular filling was obtained by releasing the cuff pressure under 100mmHg, between the systolic and diastolic pressures, to stop venous outflow while letting arterial inflow fill the vascular space. 3/ Finally, the recovery condition was reached after complete deflation of the cuff.
Seven muscles were delineated: tibialis anterior (TA), tibialis posterior (TP), Extensor digitorum (ED), peroneus (PER), gastrocnemius lateral head (GAS_LAT), gastrocnemius medial head (GAS_MED) and soleus (SOL) . For each muscle, the mean values of T1H2O and T2H2O were extracted. Repeated-measure ANOVA tests were performed comparing parameters across the three conditions. Relationships between the parameters (and their variations against the recovery condition) were analyzed by Spearman correlations.
Results
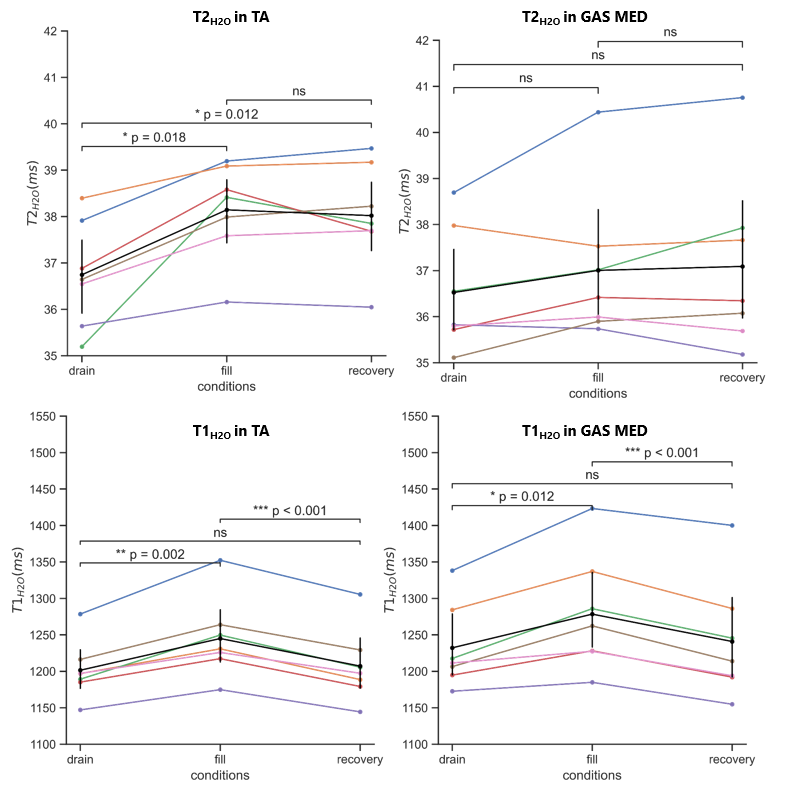
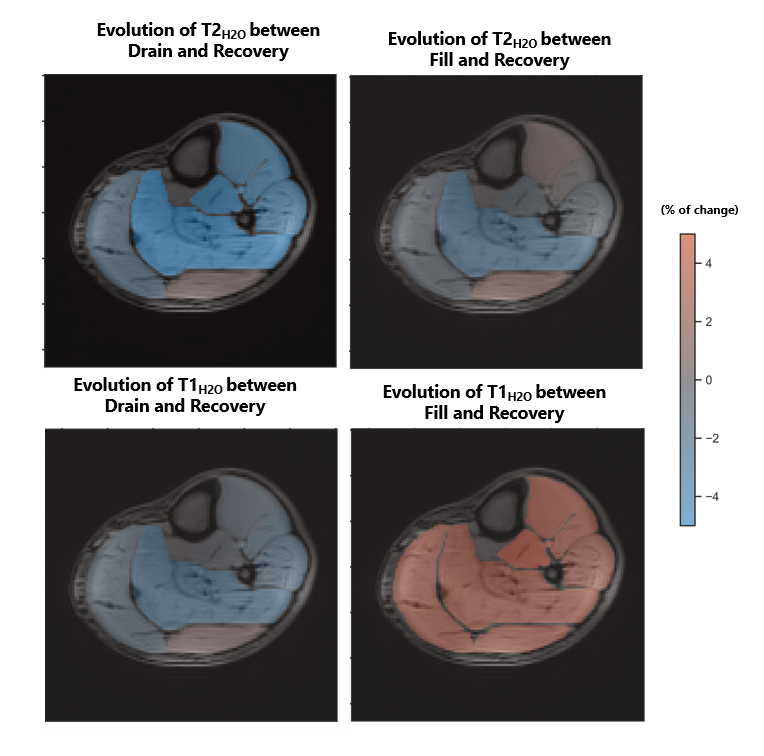
Figure 1-B shows T1H2O and T2 H2O maps obtained on two subjects with differing ages.Repeated measures ANOVA revealed significant variations of T1H2O between the 3 conditions for all muscles and significant variations of T2H2O for ED, PER, TA and SOL (Figure 2). Post hoc tests using the Bonferroni correction revealed that the T1H2O of all muscles except GAS_LAT presented significantly increase in the fill condition compared to drain and recovery conditions. T2H2O values of the ED, PER and TA were significantly lower during vascular draining compared to filling and recovery condition. While T1H2O variations during vascular filling presented a homogenous pattern of variations, T2H2O variations during draining depended on the muscle (Figure 3).
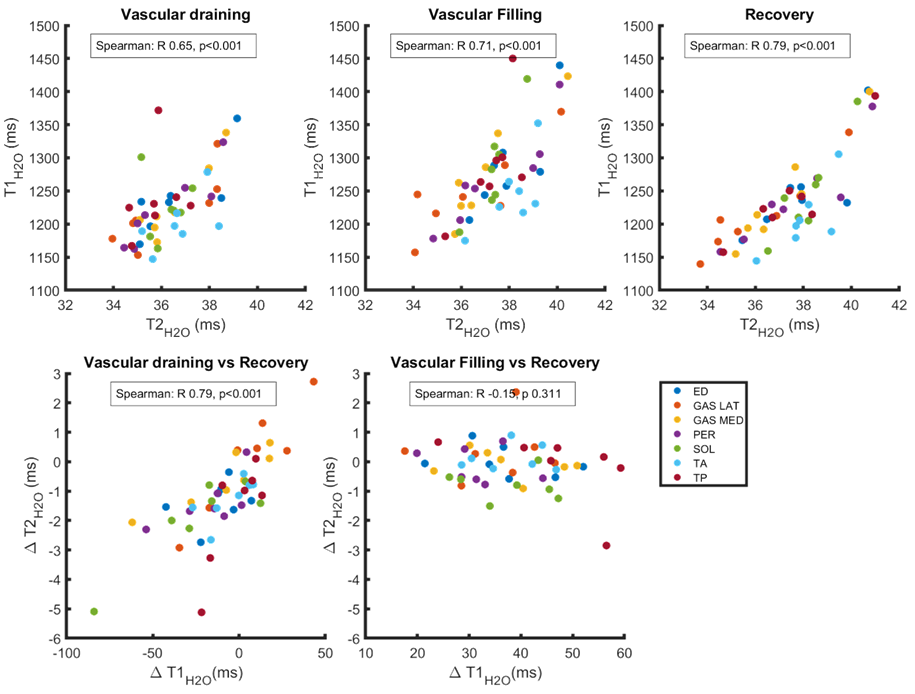
There was a significant correlation between T1H2O and T2H2O values in all conditions, however higher in recovery than in the draining and filling conditions. T1H2O and T2H2O variations correlated only between the draining and recovery condition (Figure 4).
Conclusions/Discussion
Here, the different vascular conditions aimed changing the extracellular space with changes to the vascular space. Interestingly, while T1H2O increase during filling could reflect the extracellular space expansion, T2H2O did not follow the same pattern. It is known that the muscle CPMG signal has several T2 components, principally a medium one (30-40ms, 80-90%) and a long one (~200ms, ~10%)(6). According to our results, MSME-T2 may not be very sensitive to vascular space changes, attributable to the long component. Signal suppression due to flow effects, or imperfect fat-water separation could explain this observation (3). Water T2 decrease during draining could reflect a decrease in both interstitial and vascular spaces in this condition. The obvious differences in muscle response might be attributed to differences in fiber types or vascularization index. This preliminary study suggests the complementarity of MRI biomarkers and the benefits of performing both in the context of neuromuscular diseases.Acknowledgements
This study was funded by ANR-20-CE190004References
1. Carlier, P. G. et al. Skeletal muscle quantitative nuclear magnetic resonance imaging and spectroscopy as an outcome measure for clinical trials. Journal of Neuromuscular Diseases 3, 1–28 (2016).
2. Marty, B. & Carlier, P. G. MR fingerprinting for water T1 and fat fraction quantification in fat infiltrated skeletal muscles. Magn Reson Med 83, 621–634 (2020).
3. Marty, B., Reyngoudt, H., Boisserie, J.-M., Baudin, P.-Y. & Carlier, P. G. Water T1: a quantitative biomarker of disease activity in neuromuscular disorders. in Proc. 28th ISMRM 340 (2020).
4. Azzabou, N., Loureiro de Sousa, P., Caldas de Almeida Araújo, E. & Carlier, P. G. Validation of a generic approach to muscle water T2 determination at 3T in fat-infiltrated skeletal muscle. Journal of Magnetic Resonance Imaging 41, 645–653 (2015).
5. Glover, G. H. Multipoint dixon technique for water and fat proton and susceptibility imaging. J. Magn. Reson. Imaging 1, 521–530 (1991).
6. Caldas de Almeida Araújo, E., Fromes, Y. & Carlier, P. G. New insights on human skeletal muscle tissue compartments revealed by in vivo T2 NMR relaxometry. Biophysical Journal 106, 2267–2274 (2014).
Figures