1530
Mapping human skeletal muscle glycogen in Pompe disease patients1Russell H. Morgan Department of Radiology and Radiological Science, Johns Hopkins University School of Medicine, Baltimore, MD, United States, 2F.M. Kirby Research Center for Functional Brain Imaging, Kennedy Krieger Institute, Baltimore, MD, United States, 3Department of Physiology and Functional Genomics, University of Florida, Gainesville, FL, United States, 4Department of Pediatrics, University of Florida, Gainesville, FL, United States, 5Department of Biochemistry & Molecular Biology, College of Medicine, University of Florida, Gainesville, FL, United States, 6Center for Advanced Spatial Biomolecule Research, University of Florida, Gainesville, FL, United States
Synopsis
Keywords: Muscle, Rare disease, metabolism, molecular imaging
Motivation: Pompe disease is a glycogen storage disease which leads to abnormal glycogen accumulation in tissues such as skeletal muscle, but there is a lack of suitable noninvasive methods to assess disease progression and treatment response.
Goal(s): To develop an MRI method for assessing glycogen levels in skeletal muscle of Pompe disease patients.
Approach: We used glycoNOE MRI to detect glycogen and quantified signals using a Voigt and polynomial hybrid lineshape fitting model.
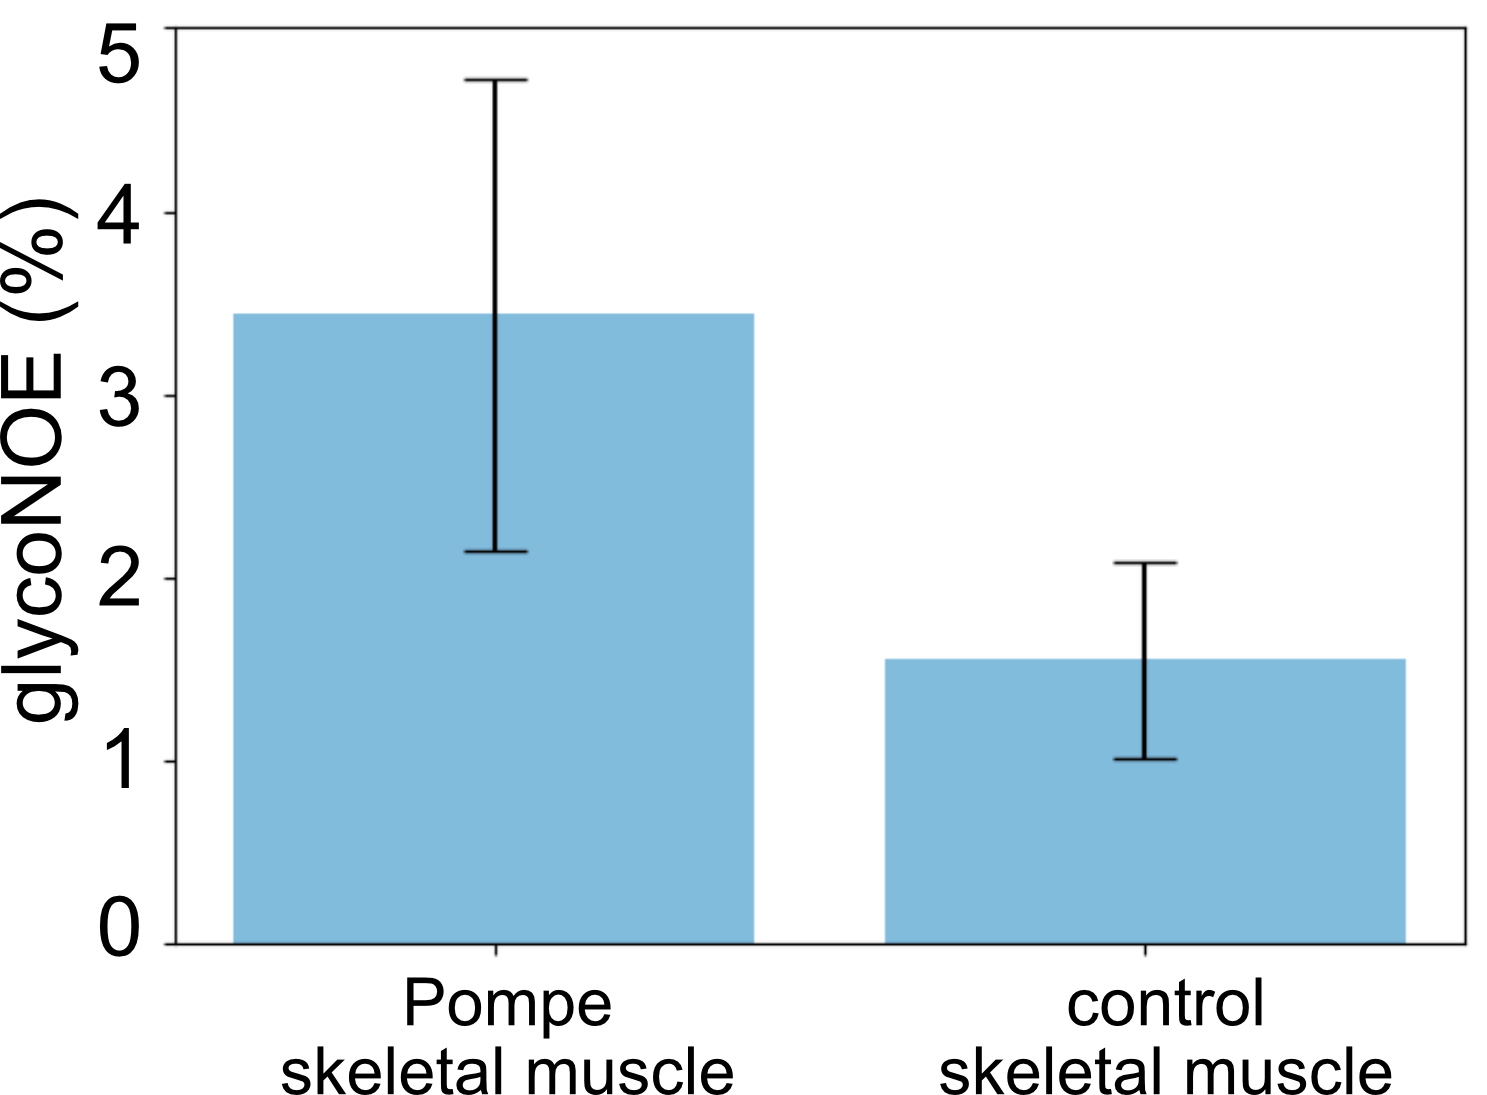
Results: The glycoNOE signals showed significantly higher glycoNOE contrast in skeletal muscle for Pompe patients compared to the control (p < 0.0001).
Impact: Glycogen level is an import marker for Pompe disease. Our proposed method is expected to be a useful tool for assessing disease progression and treatment response in Pompe disease and other glycogen storage diseases.
Introduction
Glycogen storage diseases (GSDs) are inherited, caused by mutations in genes that regulate the synthesis of breakdown of glycogen.1 Pompe disease (or GSD II) is caused by mutations in the acid alpha-glucosidase (GAA) gene leading to a deficiency of acid alpha-glucosidase.2, 3 It can result in abnormal glycogen accumulation in skeletal muscle, heart, and brain. A major symptom is muscle weakness and a variable degree of disability. Moreover, it is found that fat content in skeletal muscle progressively increases in late-onset Pompe disease (LOPD).3 There are treatments for Pompe disease, including diet modification and enzymatic replacement therapy (ERT). However, a suitable noninvasive method to measure tissue glycogen, the primary disease activity biomarker, is still lacking. Here, we employ the relayed nuclear Overhauser effect (rNOE) between glycogen aliphatic protons and water protons (glycoNOE)4 to detect glycogen in vivo through the water signal in MRI with enhanced sensitivity.Methods
Human studies were approved by the Johns Hopkins Medicine Institutional Review Board. Two Pompe disease patients and a healthy control were scanned on a 3 T Philips Elition RX system (Philips Healthcare) after informed consent was obtained. A multi-slice (10 slices) steady-state glycoNOE sequence consisting of a 50 ms sinc-Gaussian pulse with flip angle of 310° was used.5 A total of 40 saturation frequencies from 10 to -10 ppm with uneven intervals were used, and 3 extra frequencies at 100 ppm were used for S0.Z-spectral shifts caused by B0 inhomogeneity were corrected by fitting the water direct saturation curve. Then the Z-spectra were denoised using a PCA-based method to improve spectral quality. GlycoNOE signal was quantified by fitting the Z-spectra using Voigt and polynomial hybrid lineshape fitting based on the R1⍴ relaxation theory.6 The glycoNOE signal was estimated from the apparent relaxation rate contribution of glycoNOE signal (i.e. amplitude of the Voigt lineshape). For glyNOE maps, Z-spectra were fitted voxel by voxel. For ROI analysis, signals within each ROI were averaged before Z-spectral fitting.
Results
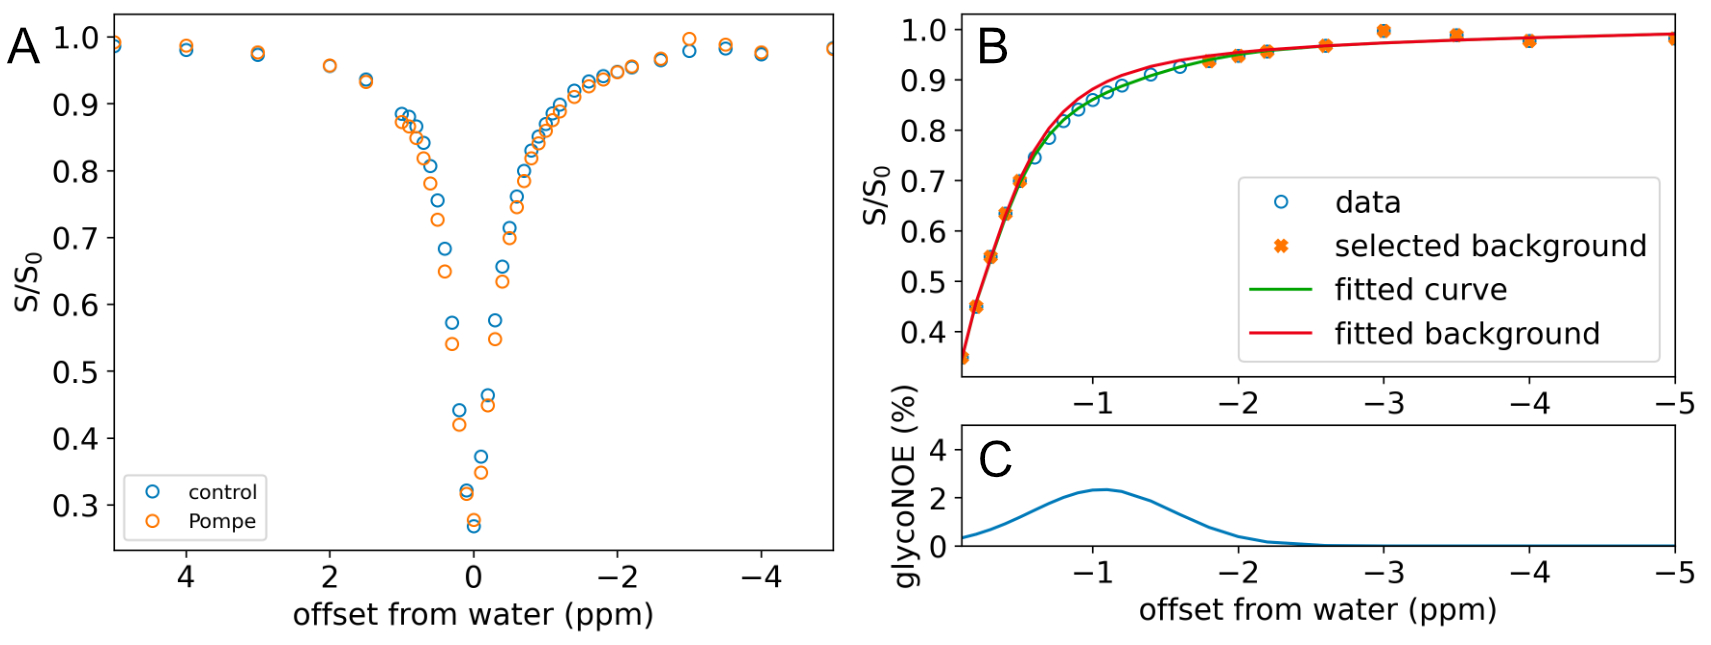
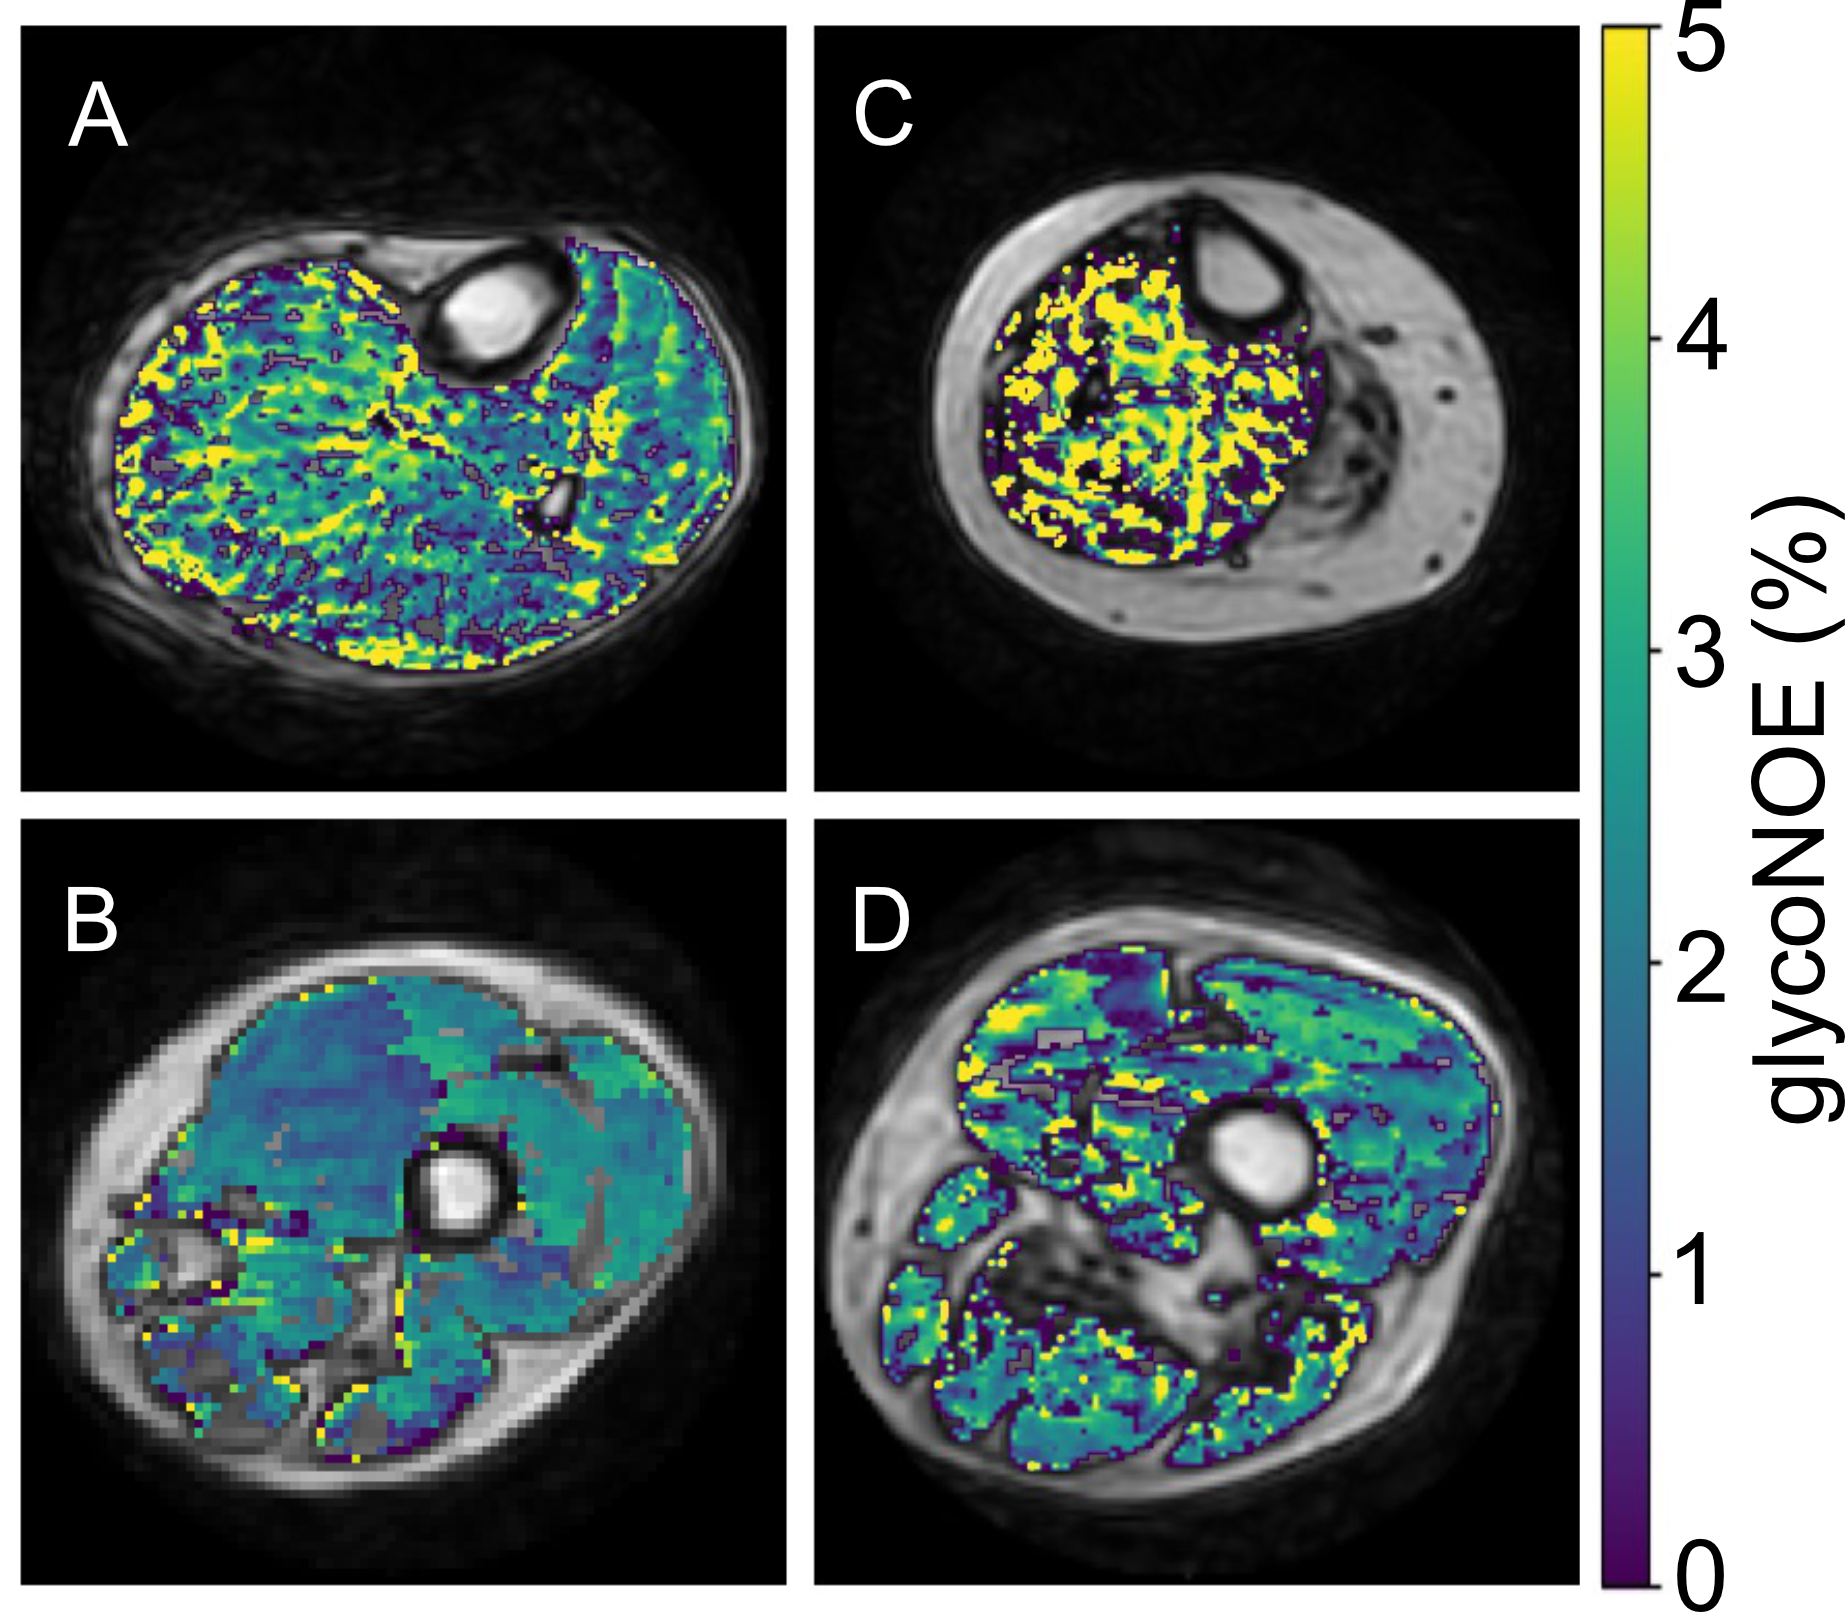
Figure 1A shows a comparison of Z-spectra taken from skeletal muscle tissue in a Pompe patient and normal control. For the acquisition parameters used in this study, the effects of direct water saturation (0 ppm) and conventional magnetization transfer (MTC, ~-2 to -4 ppm) are minimal, allowing for easier extraction of the glycoNOE signal at -1 ppm. This glycoNOE peak is extracted using a two-step fitting method, as shown in Fig. 1B-C. First, the Z-spectrum excluding the glycoNOE spectral range (-0.5 to -1.6 ppm) was used to fit the background. Then the background parameters were fixed and the glycoNOE signal was fitted using a Voigt lineshape. This glycoNOE signal was mapped across all 10 slices in each subject and the results for a representative slice for each subject are shown in Figure 2.A prominent feature in Pompe patients is a large fraction of fatty tissue compared to normal controls. The Z-spectral region between -2 to -4 ppm contains lipid signals. These signals were mapped and used to mask out fat tissue in the glycoNOE maps shown in Figure 2. Across all slices, Pompe patients have approximately twice the level of glycoNOE contrast compared to controls (Figure 3). This signal difference is significant (p < 0.0001) in skeletal muscle across all slices.Discussion
This study demonstrates the mapping the glycogen in the skeletal muscle of Pompe disease patients using glycoNOE MRI. These patients are known to have abnormally high glycogen levels in skeletal muscle and the glycoNOE maps in this study show twice the level of contrast compared to normal controls. GlycoNOE maps were heterogenous across the muscle. One reason for this heterogeneity could be due to fibrosis and fat replacement in muscle, a classic feature of the disease.3 This muscle fiber loss is the basis for current MRI methods for characterizing this disease, but this occurs in the latter stages of the disease when there is permanent muscle weakness. GlycoNOE MRI reports on glycogen content directly and thus may be more sensitive to disease progression at early time points. Still, studies on additional patients are required for more robust statistical analysis and investigating the effects of fibrosis and fat in glycoNOE signal characterization.Conclusion
Our preliminary study in a limited number of patients shows that GlycoNOE MRI can be used to detect abnormal glycogen levels in Pompe disease. It is expected to be a useful tool for assessing disease progression and treatment response in glycogen storage diseases.Acknowledgements
No acknowledgement found.References
(1) Hannah, W. B.; Derks, T. G. J.; Drumm, M. L.; Grünert, S. C.; Kishnani, P. S.; Vissing, J. Nature Reviews Disease Primers 2023, 9 (1), 46.
(2) Kohler, L.; Puertollano, R.; Raben, N. Neurotherapeutics 2018, 15 (4), 928-942.
(3) Díaz-Manera, J.; Walter, G.; Straub, V. Muscle Nerve 2021, 63 (5), 640-650.
(4) Zhou, Y.; van Zijl, P. C. M.; Xu, X.; Xu, J.; Li, Y.; Chen, L.; Yadav, N. N. Proc. Natl. Acad. Sci. U. S. A. 2020, 117 (6), 3144-3149.
(5) Chen, L.; Wei, Z.; Chan, K. W. Y.; Cai, S.; Liu, G.; Lu, H.; Wong, P. C.; van Zijl, P. C. M.; Li, T.; Xu, J. Neuroimage 2019, 188, 380-390.
(6) Chen, L.; Zeng, H.; Xu, X.; Yadav, N. N.; Cai, S.; Puts, N. A.; Barker, P. B.; Li, T.; Weiss, R. G.; van Zijl, P. C. M.; et al. NMR Biomed. 2017, 30 (12), e3834.
Figures