1528
Establishment and validation of a Nomogram Clinical prediction model for osteoporosis based on magnetic resonance Q-Dixon and MT techniques1Affiliated Hospital of Shaanxi University of Traditional Chinese Medicine, xianyang, China, 2MR Research Collaboration, Siemens Healthineers, Shanghai ,China, shang hai, China
Synopsis
Keywords: Other Musculoskeletal, Magnetization transfer, osteoporosis、Q-Dixon
Motivation: More research has confirmed the important role of new MRI techniques in early screening and efficacy evaluation of osteoporosis.
Goal(s): The purpose of this study is to construct a nomogram clinical prediction model for predicting osteoporosis based on Q-Dixon、MT technology and clinical data
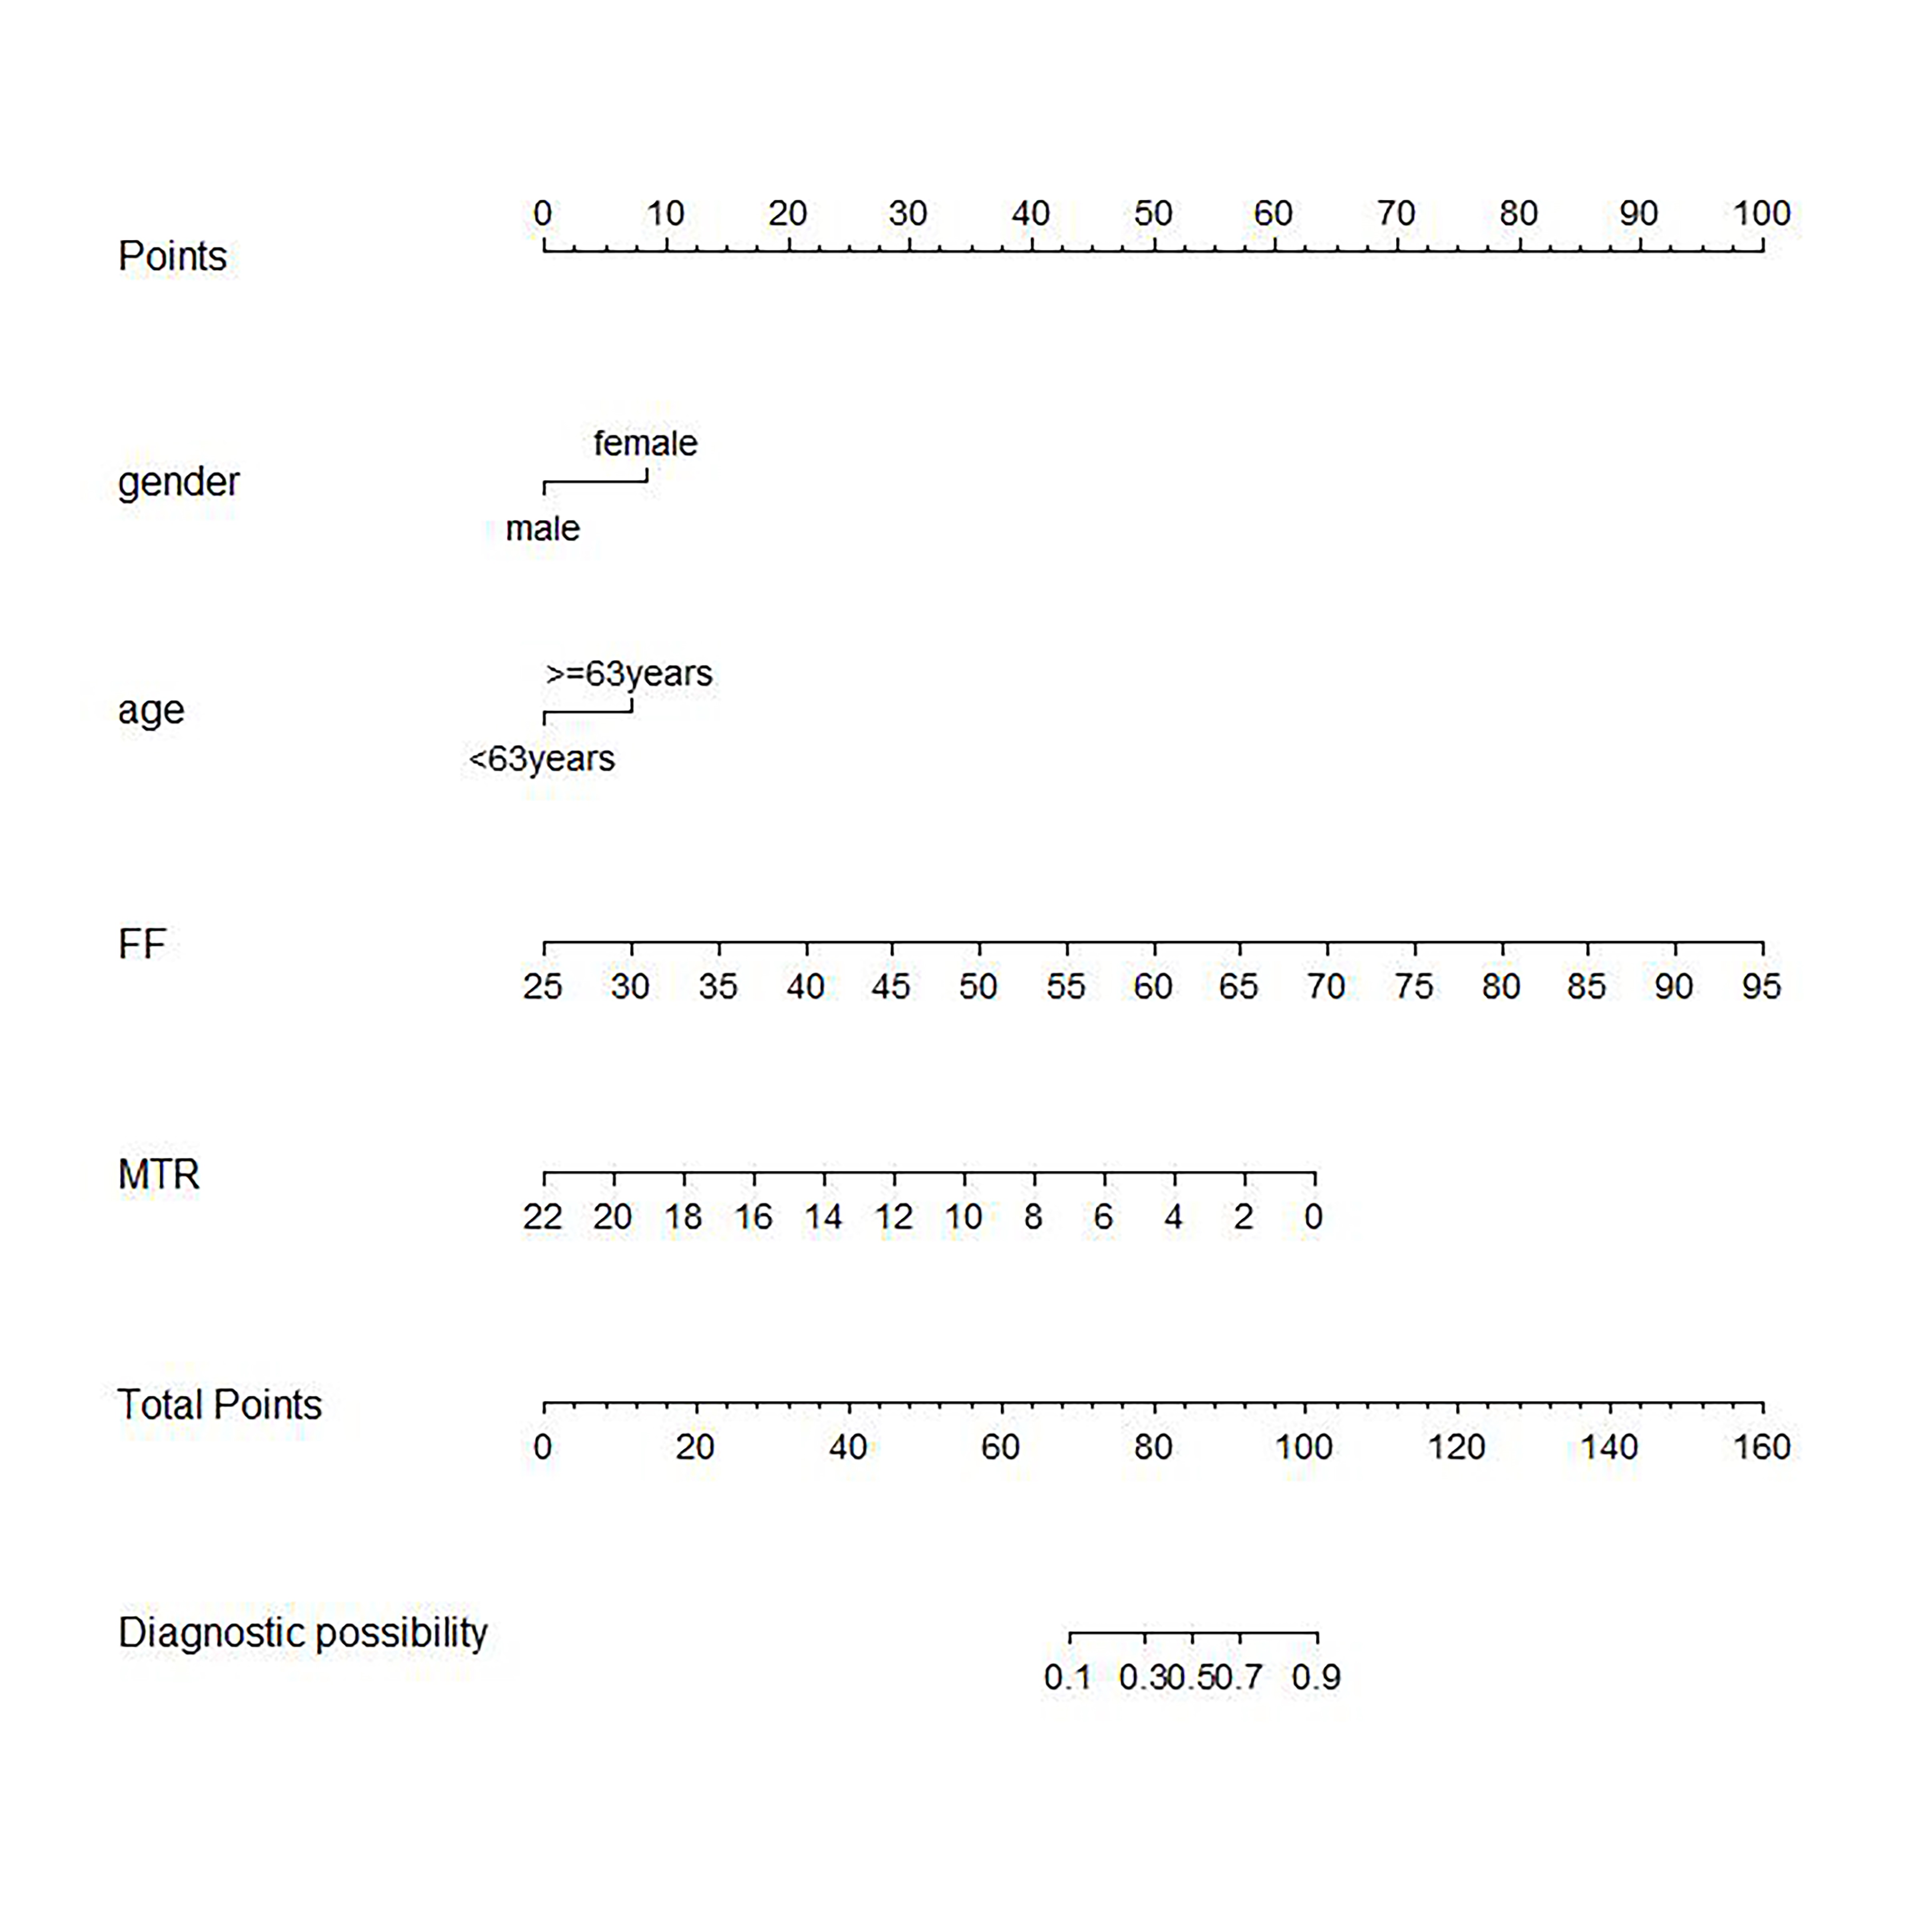
Approach: logistic regression analysis confirmed that four risk factors (gender, age, FF value, MTR value) were significant independent predictors of osteoporosis, and the calibration curve of the nomogram had good reliability in evaluating osteoporosis in training and validation cohorts
Results: The Nomogram model has more advantages in predicting osteoporosis than the FF model and MTR model
Impact: The clinical prediction model based on gender, age, FF value, and MT value nomogram has good universality and clinical benefits, is easy to promote, and helps to better screen for osteoporosis in the general elderly population, achieve early detection.
Introduction
Based on the high incidence rate and occult of osteoporosis, as well as the deficiency of bone mineral density in the diagnosis of osteoporosis, magnetic resonance imaging is used more and more widely[1]. Therefore, this study attempts to construct a clinical prediction model for osteoporosis using magnetic resonance technology using a nomogram。Methods
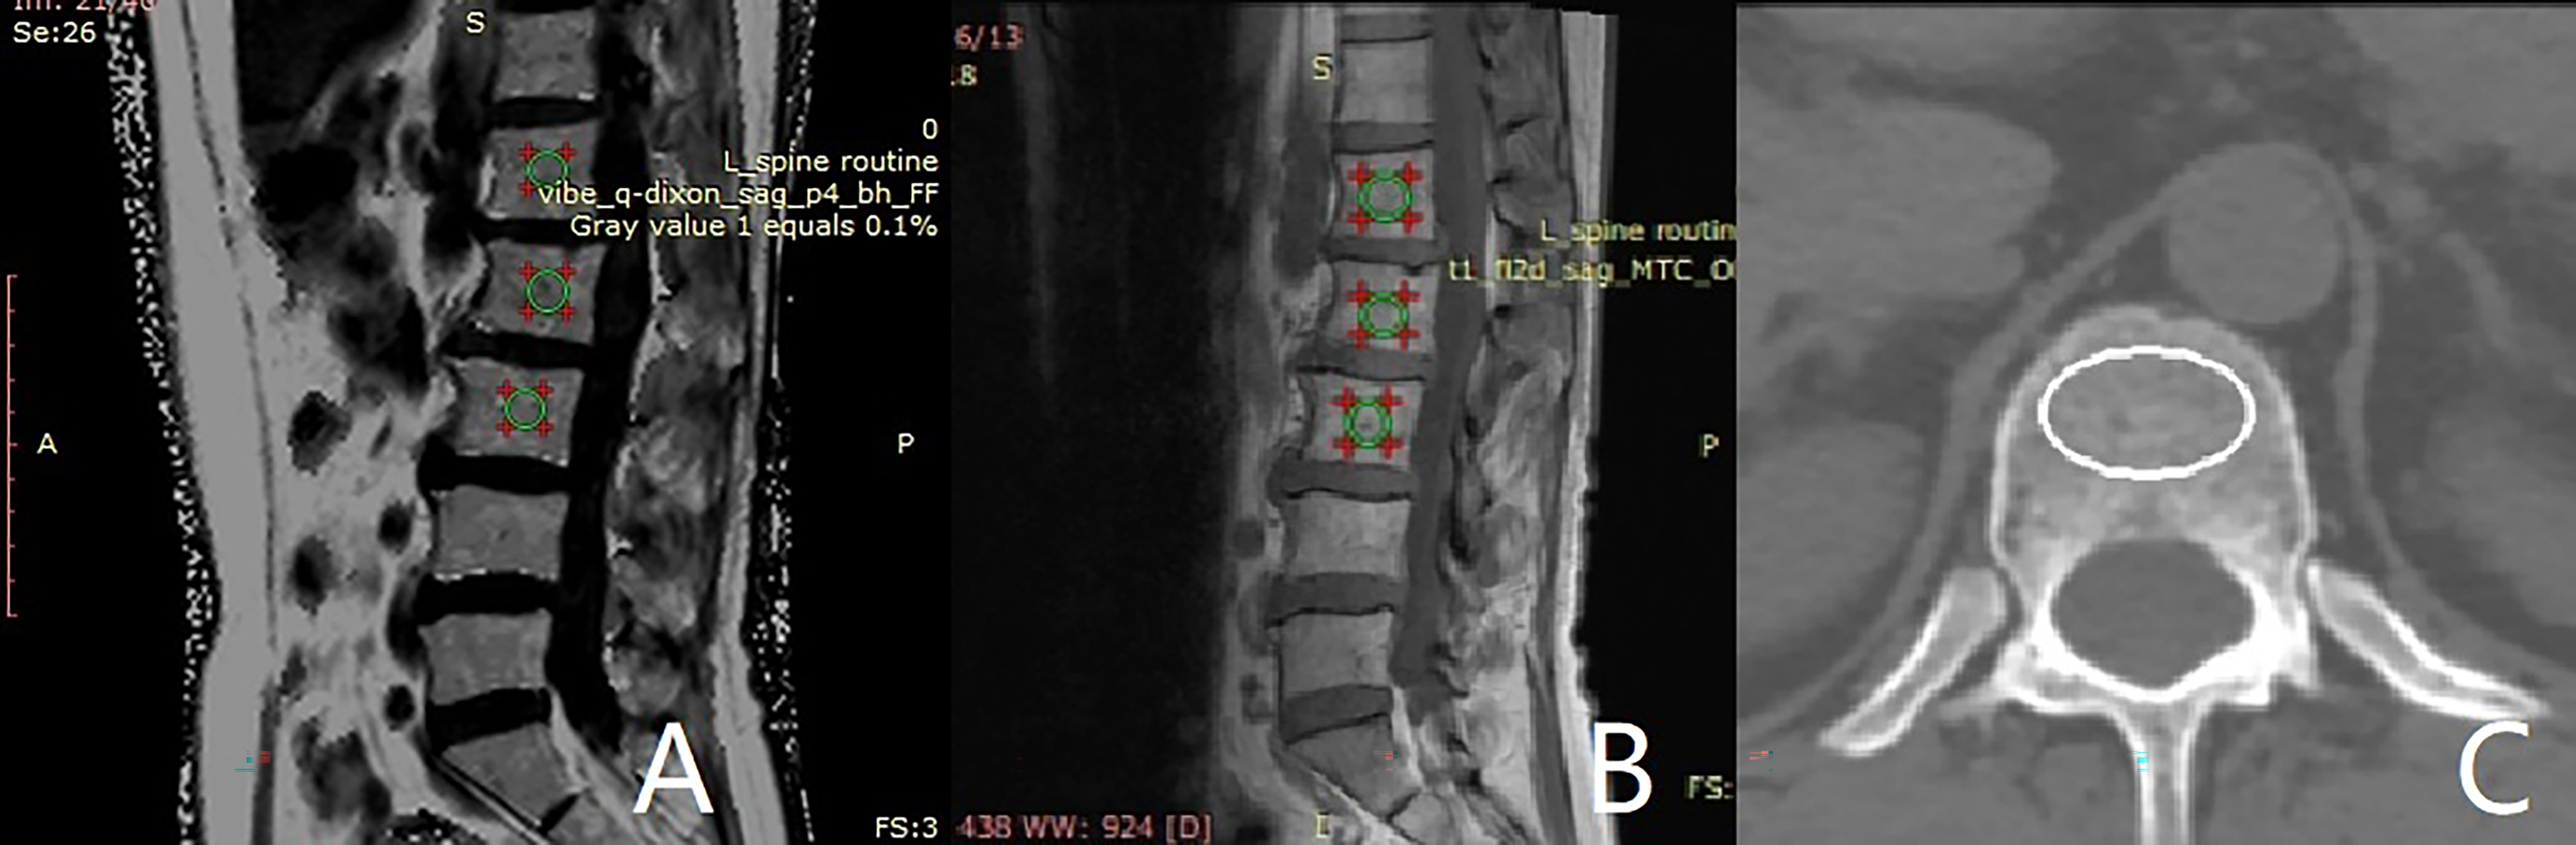
287 patients were collected and enrolled in the study. In a 7:3 ratio, 207 patients were randomly assigned to the training group: No Osteoporosis (n=106), Osteoporosis (n=101), and 80 patients to the validation group: No Osteoporosis (n=39), Osteoporosis (n=41). QCT bone mineral density examination was carried out for participants to measure BMD, and clinical data (gender, age, height, weight, BMI, marital status, education experience, drinking history, smoking history, diabetes history, fatty liver history) were collected. Then, magnetic resonance multi echo Dxion and magnetic transfer imaging were carried out, and the average FF and MT values of lumbar vertebrae 1, 2, and 3 were measured on the lumbar fat map and magnetic transfer map. A logistic regression analysis was conducted on these data. Established a clinical prediction model using column charts. The nomogram model was validated through ROC curves, calibration curves, and DCA curves.Results
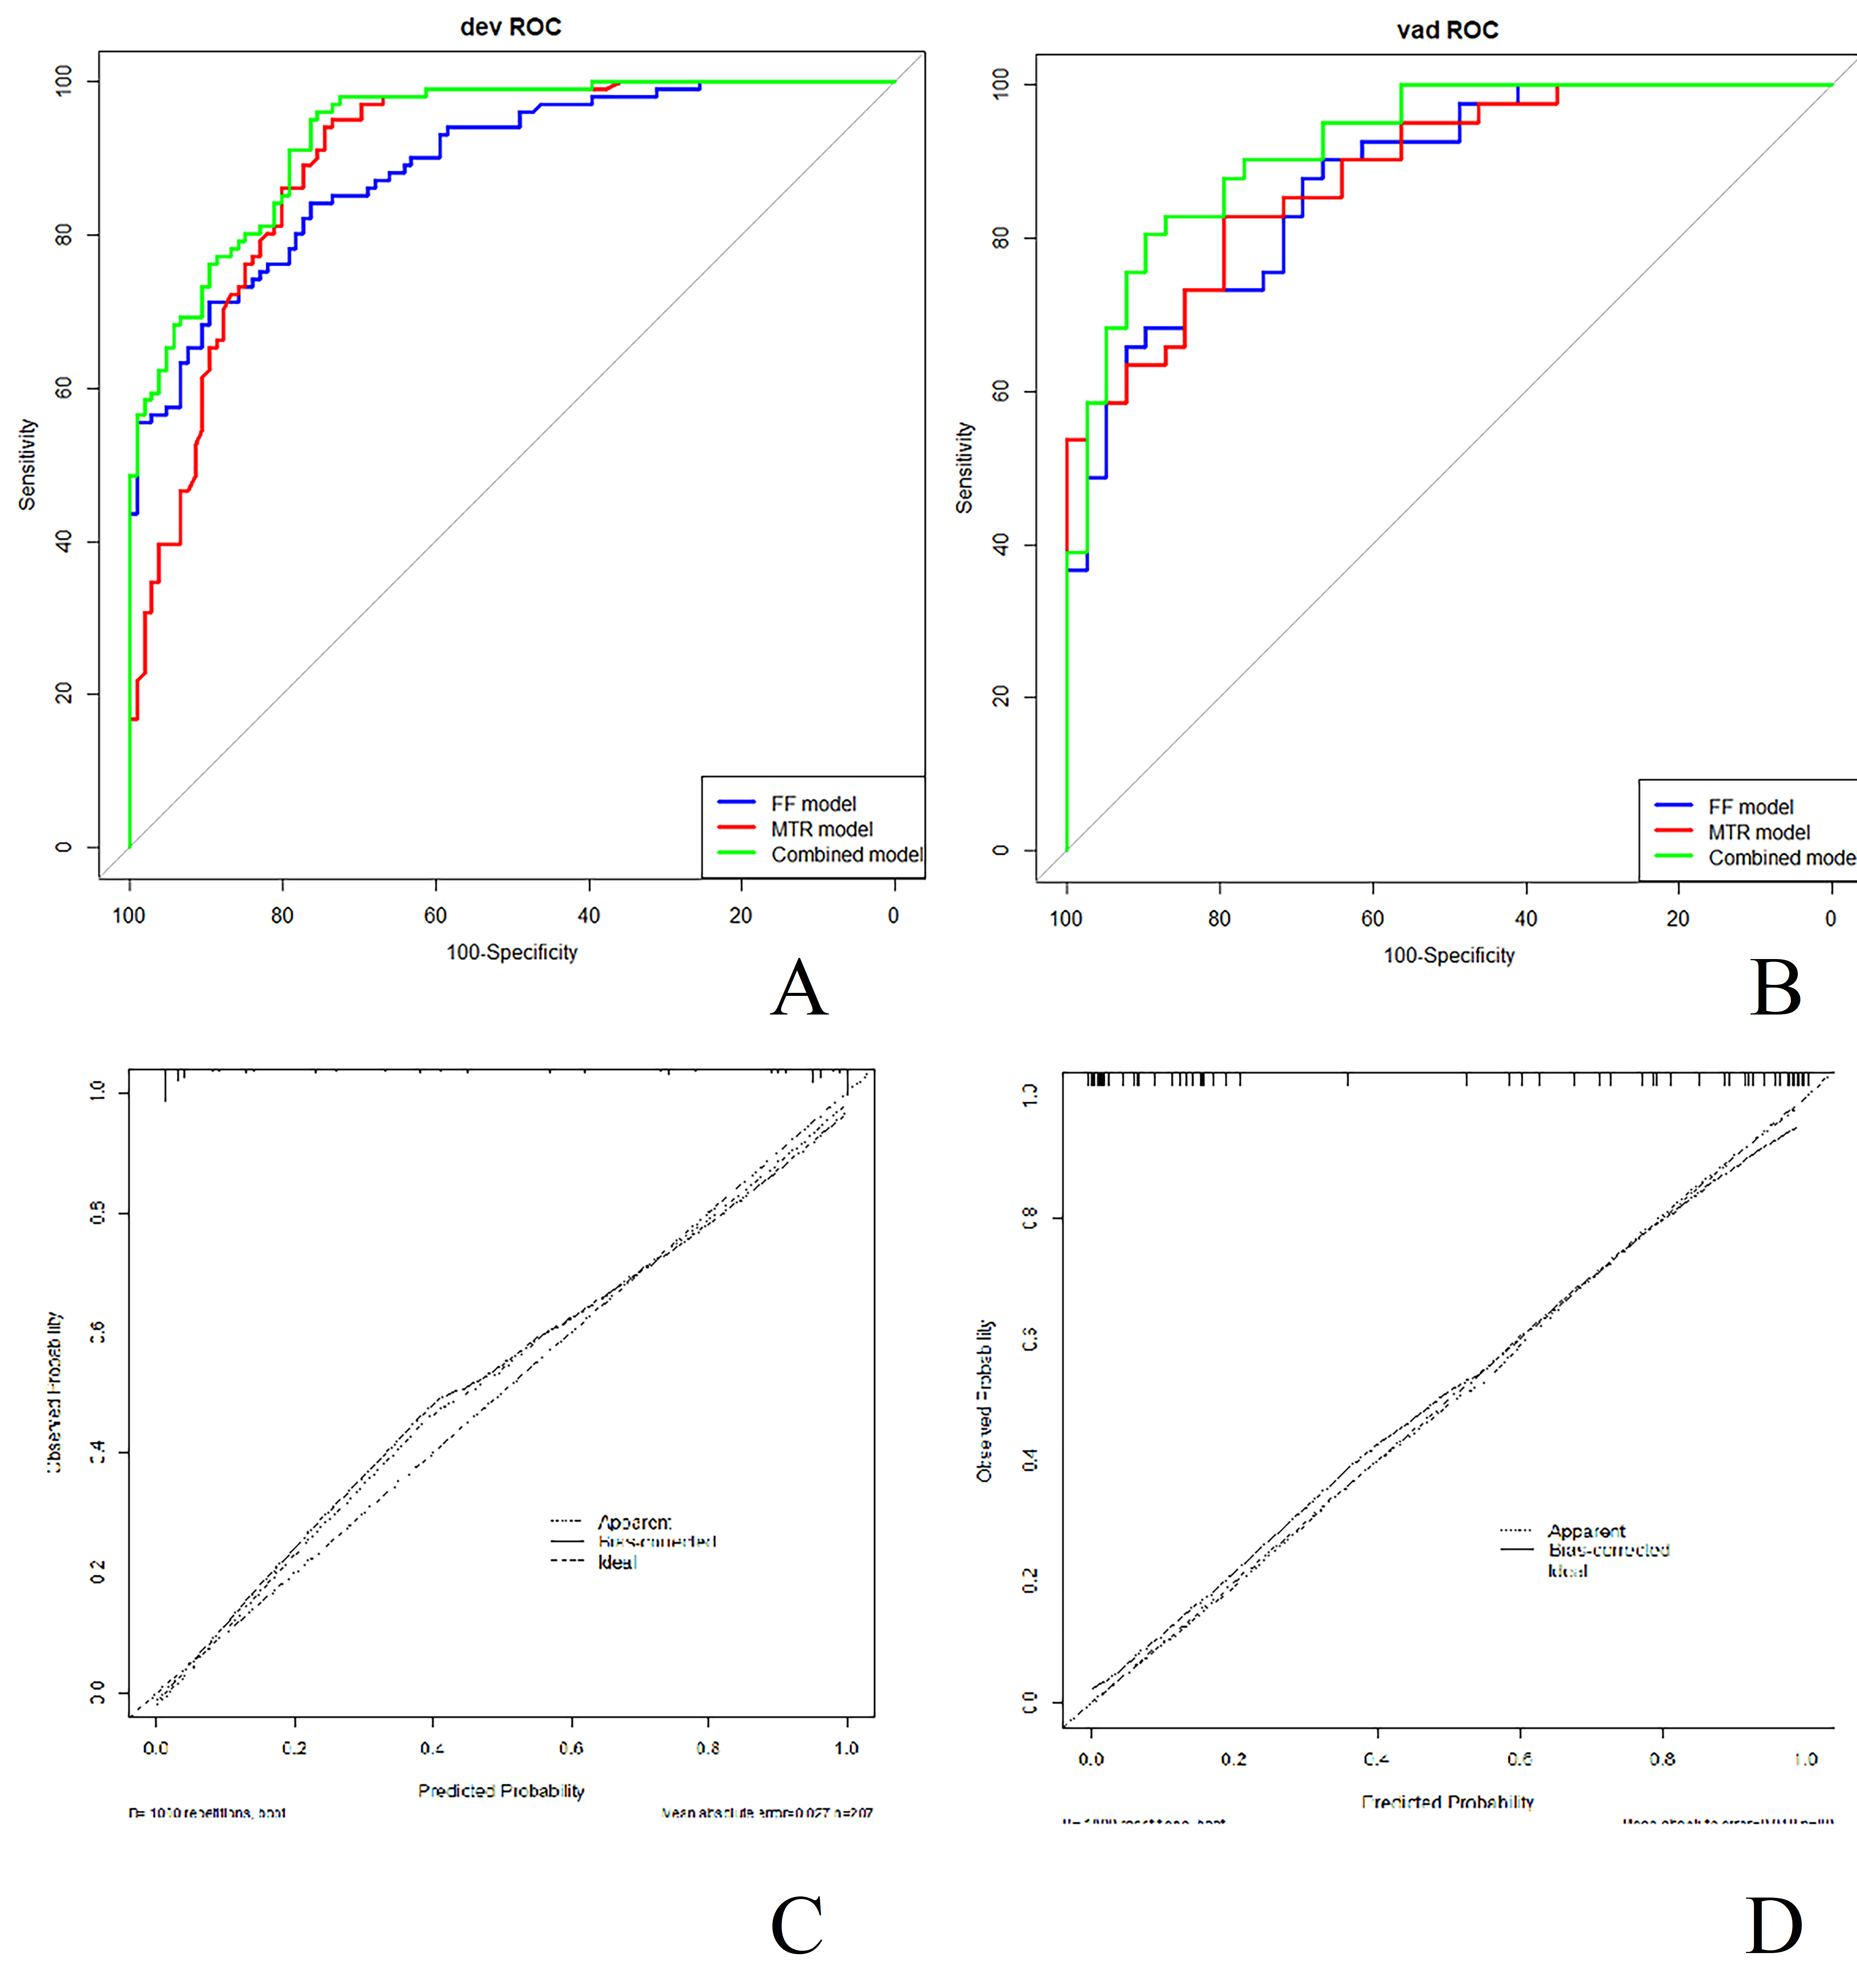
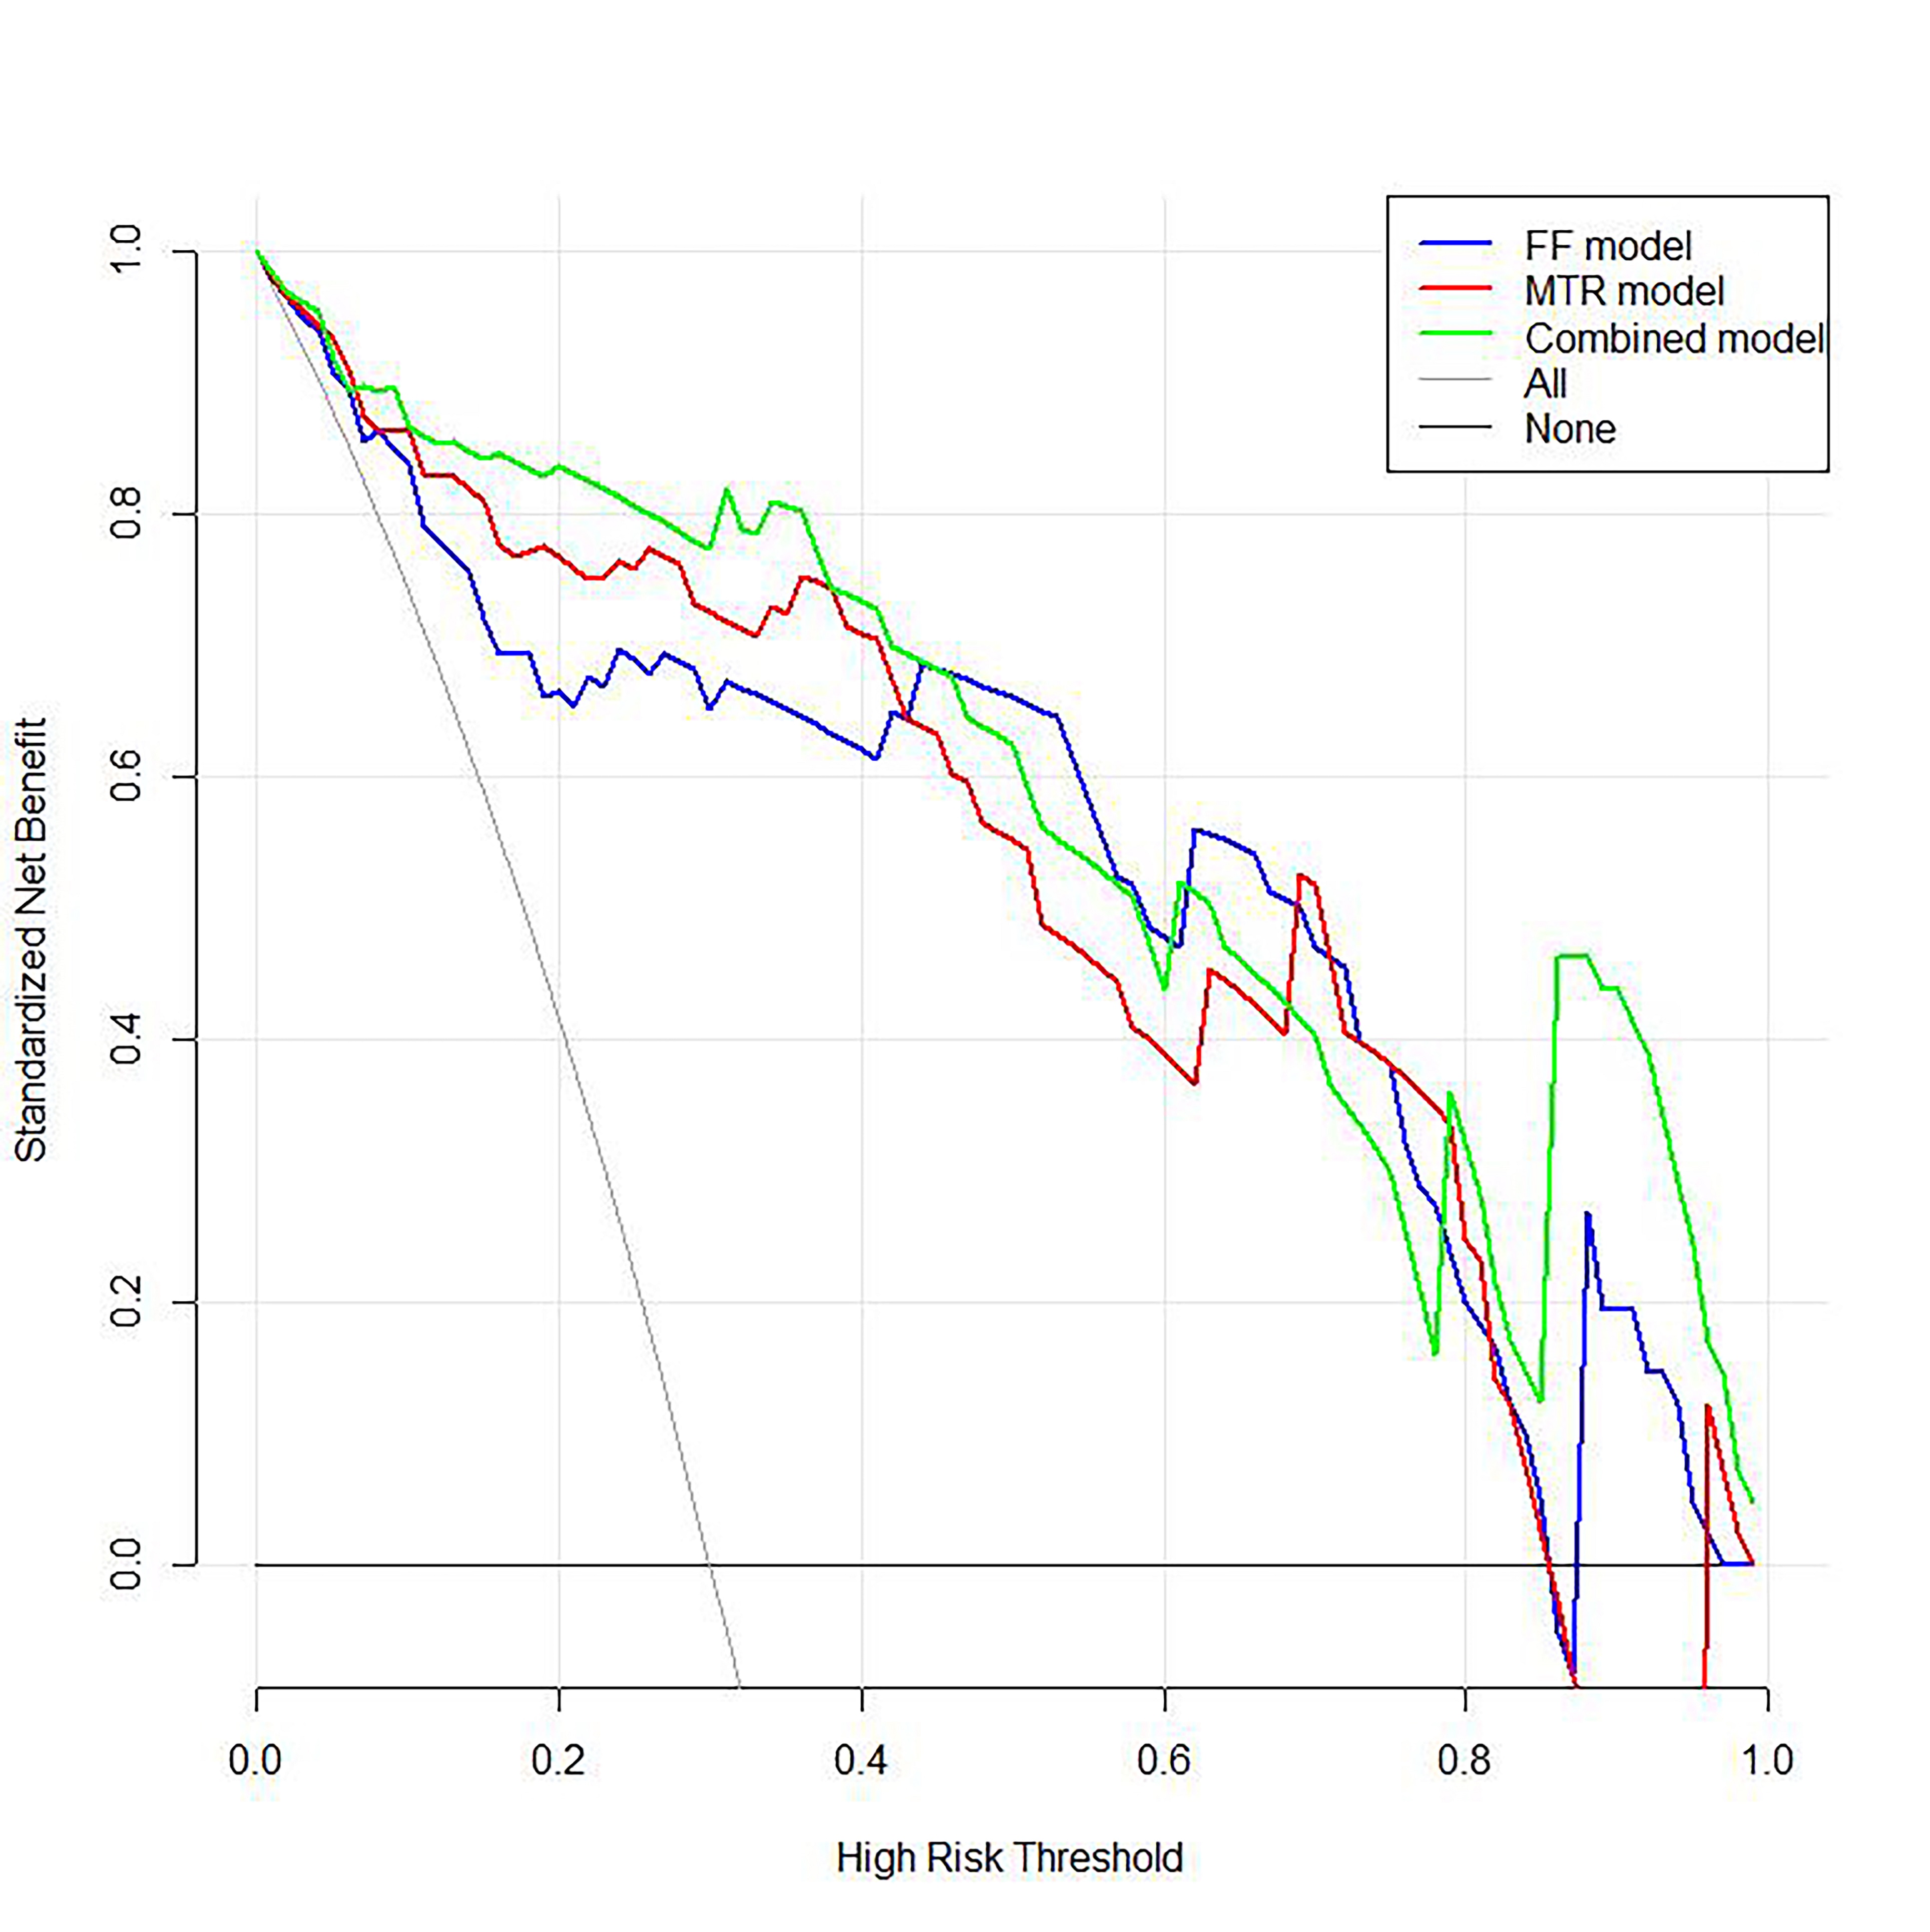
1.There was no significant difference in the osteoporosis rate between training and testing set (48.8% vs. 51.3%, P = 0.157). Patients in the non-osteoporotic group had more male ratio than those in the osteoporotic group and the difference was statistically significant in the training cohort (50.9% versus 16.8%, p﹤0.001), but gender did not have a statistical significance between two groups in the validation cohort (41.0% versus 26.8%, p = 0.185) . In both the training cohort and the validation cohort, there were significant differences in the distributions of age, weight, BMI, diabetes, FF and MTR between the non-osteoporotic and osteoporotic group (all, p < 0.05).There were no significant differences in height, marital status, education level, manual laborer or not, fatty liver, history of drinking and smoking (all, p ﹥ 0.05).2. Multivariate logistic regression analysis confirmed that four risk factors (gender: : OR= 4.658, 95% CI: 1.411–15.374, P=0.012; age: OR= 3.274, 95% CI: 1.241–8.637, P<0.017; FF: OR=1.242, 95% CI: 1.120–1.378, P<0.001; MTR: OR= 0.706, 95% CI: 0.606–0.822, P<0.001) were significant independent predictors of osteoporosis.3. The AUCs for the nomogram, FF and MTR models were 0.933, 0.890 and 0.899, respectively, in the training cohort and 0.923, 0.877 and 0.886, respectively, in the validation cohort. The calibration curve of the nomogram demonstrated very good reliability in evaluating osteoporosis in the training and validation cohorts (P > 0.050). If the risk threshold probability is set over 5%, nomogram models have more advantages to predict osteoporosis than FF model and MTR model.Conclusions
The nomogram models clinical prediction model based on gender, age, FF value, and MT value has good universality and clinical benefits. The clinical prediction model of nomogram models is easy to generalize, which helps to better screen for osteoporosis in the general elderly population and achieve early detection and diagnosis.Acknowledgements
No acknowledgement found.References
[1] Li X, Xie Y, Lu R, Zhang Y, Li Q, Kober T, Hilbert T, Tao H, Chen S. Q-Dixon and GRAPPATINI T2 Mapping Parameters: A Whole Spinal Assessment of the Relationship Between Osteoporosis and Intervertebral Disc Degeneration. J Magn Reson Imaging. 2022 May;55(5):1536-1546.Figures