1526
Synthetic MRI with quantitative mapping in evaluating the osteonecrosis of femoral head1Radiology, Affiliated Hospital of Nanjing University of Chinese Medical, Nanjing, China, 2GE Healthcare, MR Research, Beijing, China
Synopsis
Keywords: Bone, Quantitative Imaging, Synthetic MR, ONFH
Motivation: Both qualitative and quantitative diagnosis of ONFH can be achieved through Synthetic MRI.
Goal(s): To investigate the value of Synthetic MRI in evaluating the osteonecrosis of femoral head(ONFH).
Approach: 336 hips in 168 cases of clinically diagnosed patients with ONFH were recruited and measured with T1, T2 and PD mapping derived by Synthetic MRI, 70 hips were normal as controls and 256 were ONFH.
Results: T1 , T2 and PD values showed significantly different values between ONFH and normal hip(all P<0.001). .With further ROC analysis, the diagnostic efficacy of T1 in the necrosis region and edema region was better than T2 and PD.
Impact: MRI images are important for clinical diagnosis of ONFH, while conventional MRI is qualitative diagnosis, quantitative diagnosis of ONFH is not yet available, therefore, Synthetic MRI may be considered an effective quantitative method in differentiating ONFH from normal femoral.
Introduction
The osteonecrosis of femoral head (ONFH) is a common disease in orthopedics[1]. Conventional MRI is qualitative diagnosis[2], magnetic resonance image compilation (MAGiC), as one type of synthetic MRI (syMRI), is a relatively novel quantitative MRI technique that can offer a comprehensive set of relaxometry mapping of T1, T2 and PD in a single measurement[3]. Based on the promising findings reported in previous studies[4-7], MAGiC derived quantitative maps may also hold a potential in assessing ONFH. It can produce quantitative data in the qualitative diagnosis of femoral head necrosis and provide a basis for the quantitative diagnosis of the disease. However, this has not been studied so far. Therefore, the main goal of this study was to investigate if MAGiC derived T1, T2 and PD mapping was feasible for predicting ONFH.Materials and Methods
SubjectsA total of 168 patients (mean age 33 years, ranging from 17-70 years) were recruited in the study, including healthy hips (n=70) and ONFH hips(n=265).
MRI acquisition
All MRI experiments were performed on a 3T-scanner (SIGNA Architect, GE, USA) with an 16-channel flexible coil employed. Conventional T1WI, T2WI and MAGiC imaging were performed for each participant.
Data analysis
All MAGiC data were post-processed with a vendor-provided program (MAGIC, v.100.1.1). The corresponding T1, T2 and PD mapping were obtained accordingly for each patient. Two experienced radiologists selected the areas with the most significant necrosis and edema as regions of interest (ROI)s based on the T1WI and T2WI images. The mean T1, T2 and PD values of ROIs for each participant were used for further analyses.
Statistic analysis
All statistic analyses were performed with SPSS (version 25.0) software. Independent sample t-test was applied for each quantitative parameter to test the difference between necrosis region and normal femoral head, and between edema regions and normal femoral neck. Also, paired sample t-test was also used to compare each parameter between necrosis and edema regions. Receiver operating characteristic curve (ROC) analysis with the area under the curve (AUC) was used to evaluate the diagnostic efficacy of each quantitative parameters in ONFH diagnosis. Comparisons between areas under the curve (AUC) were made using the Delong test. P<0.05 was considered statistically significant.
Results
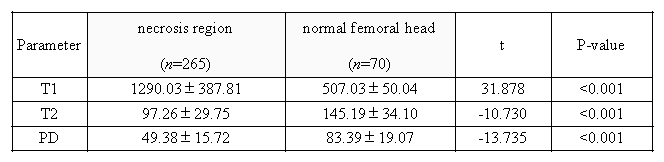
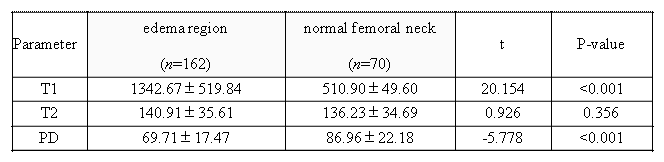
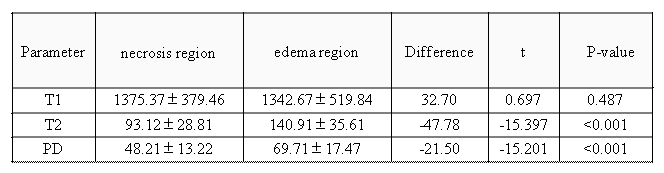
Significantly different T1, T2 and PD values were found between necrosis region and normal femoral head were significant(Table 1). T1, and PD also showed significantly different values between edema region and normal femoral neck, and T2 values were not statistically significant(Table 2). For necrosis and edema region, T2 and PD values were found in between, and, the T1 values were not significantly different (Table 3).With ROC analysis, the AUCs of T1, T2 and PD for the osteonecrosis of femoral head were 0.998, 0.877 and 0.909. The corresponding sensitivity of 99.2%, 70.2%, 86.8%,specificity of 100%, 92.9%, 80%,and thresholds of 598ms, 106 ms and 69pu were also shown,respectively. Moreover, to diagnose the edema of femoral neck, the AUCs of T1 and PD were 0.986 and 0.713, with a sensitivity of 95.7%, 100%, specificity of 90.1%, 44.3%, and the threshold of 644ms and 94pu,respectively.
With Delong test, significantly different AUCs were revealed between T1 and T2 values, T1 and PD values in diagnosing femoral head necrosis (both P < 0.001). T1 showed more robust performance, relative to T2 and PD, in the diagnosis of femoral head necrosis. Moreover, T1 was more effective than PD in diagnosing the edema area of femoral neck (P < 0.001).
Discussion
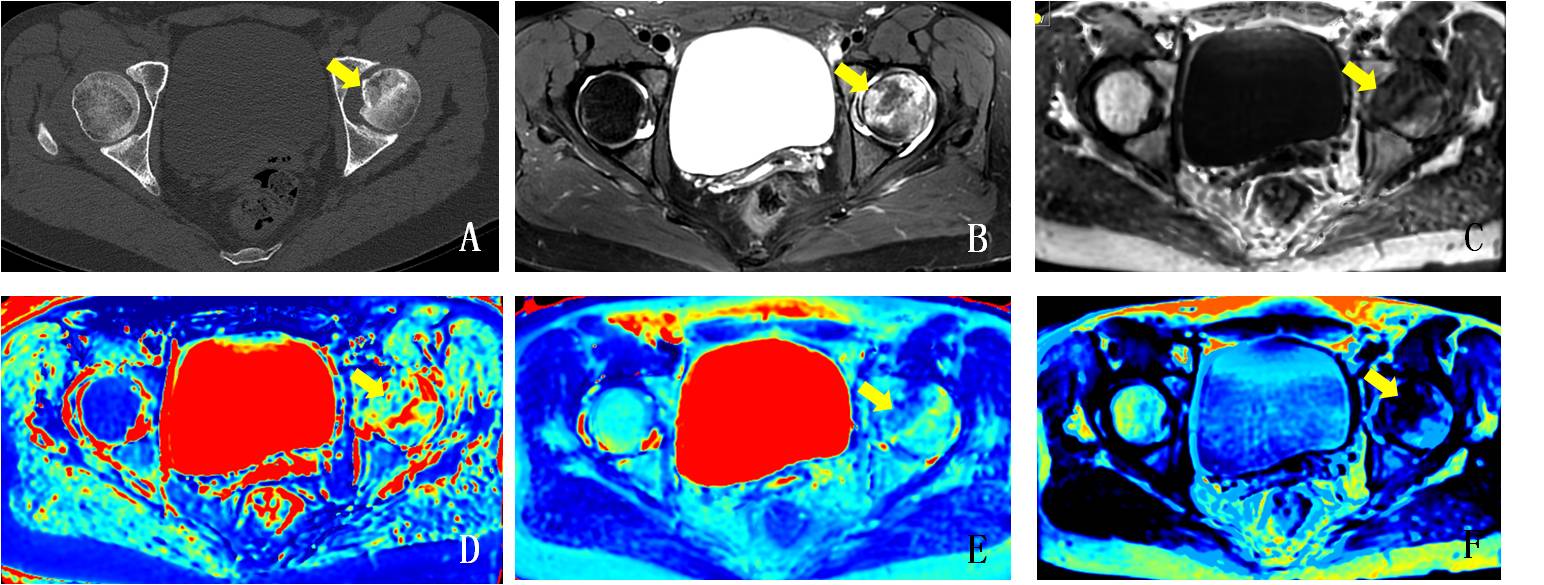
Longer T1 and lower T2 , PD values were shown in necrosis region than normal femoral head, which was consistent with qualitative diagnosis of ONFH on T1WI, T2WI and PDWI sequence images. Among them, the T1WI image is the easiest to detect necrosis region and it's not easy to ignore tiny focus and avoid ignoring diagnostics and wrong diagnostics, which is consistent with our quantitative diagnosis results.Longer T1 and lower PD values were shown in edema region than normal femoral neck. There was no difference in T2 values, which was inconsistent with our conclusion that T2WI was the most sensitive sequence in the qualitative diagnosis of femoral neck edema. There are two possible reasons. One is that most patients are young, the slightly high signal may be not edema, but normal red bone marrow , and the other is that most femoral neck edema was mild, the T2 value was slightly higher than normal, there was no statistical difference.
Conclusion
In conclusion, our study demonstrated that quantitative T1 T2 and PD derived from synthetic MRI have significantly different values in evaluating the ONFH.Acknowledgements
No acknowledgement found.References
[1] Mont MA, Cherian JJ, Sierra RJ, et al. Nontraumatic osteonecrosis of the femoral head: where do we stand today? A ten-year update[J]. J Bone Joint Surg Am, 2015, 97(19): 1604-1627.
[2] Malizos KN, Karantanas AH, Varitimidis SE, et al. Osteonecrosis of the femoral head: etiology, imaging and treatment[J]. Eur J Radiol, 2007, 63(1):16-28.
[3] Warntjes JB, Leinhard OD, West J, Lundberg P (2008). Rapid magnetic resonance quantification on the brain: Optimization for clinical usage. Magnetic Resonance in Medicine. 2008 Aug;60(2):320-329. [4]Vargas MI,Drake-Pérez M,Delattre BMA, et a1. Feasibility of a Synthetic MR Imaging Sequence for Spine Imaging[J]. Am J Neuroradiol, 2018, 39:1756-1763.
[5] Yi J, Lee YH, Song HT, et a1. Clinical Feasibility of Synthetic Magnetic Resonance Imaging in the Diagnosis of Internal Derangements of the Knee[J]. Korean J Radiol, 2018, 19:31l-319.
[6] Park S, Kwack KS. Initial experience with synthetic MRI of the knee at 3T:comparison with conventional Tl weighted imaging and T2 mapping[J]. Br J Radiol, 2018, 91:20180006.
[7] Ke Zhang, Chaoran Liu, Yunfei Zhu et a1. Synthetic MRI in the detection and quantitative evaluation of sacroiliac joint lesions in axial spondyloarthritis[J]. Front Immunol, 2022, 13:1000314.
Figures