1525
Advancing pediatric quantitative MSK through tailored denoising of routine acquisitions developed on an piglet model of LCPD1Department of Veterinary Clinical Sciences, University of Minnesota, Saint Paul, MN, United States, 2Center for Magnetic Resonance Research, University of Minnesota, Minneapolis, MN, United States
Synopsis
Keywords: Bone, Relaxometry
Motivation: Denoising algorithms may significantly improve the SNR of relaxation time maps of the bone and cartilage.
Goal(s): To compare the performance of T-NORDIC and MPPCA denoising techniques for 3D T2 mapping of the femoral head.
Approach: 3D T2 maps of the femoral heads from 12 piglets imaged at 3T MRI were denoised using MPPCA and T-NORDIC with parametric dimensions of 4 and 12. The results of qualitatively and quantitatively compared for image quality and quantitative accuracy.
Results: T-NORDIC provided superior performance with limited parametric dimension (4 weighted images), demonstrating its promise for magnetization-prepared mapping sequences of the hip joint.
Impact: T2 relaxation time mapping is critically investigated for addressing several MSK related diagnosis, but possibly due to thin and sensitive structures in the femoral head even slightest of the perturbations can lead to ineffective computation of quantitative mapping.
INTRODUCTION
T-NORDIC is a newly proposed technique to denoise relaxation time mapping acquisitions (and other series of images with a relatively small parametric dimension)1. T-NORDIC potentially provides superior performance for denoising these images than prior methods, such as Marchenko-Pastur Principal Component Analysis (MPPCA)2. One application area that may benefit from T-NORDIC is relaxation time mapping of the musculoskeletal system, including mapping of cartilage and bone. As a specific example, recent work has demonstrated that T2 relaxation time mapping is sensitive in detecting ischemic injury and repair to the femoral head in a piglet model of Legg-Calve-Perthes disease (LCPD)3,4. LCPD is a pediatric form of osteonecrosis of the femoral head, and quantification of injury and repair of the bone marrow and growth cartilage may help inform treatment of the disease3-5. However, relaxation time mapping of the hip joint at high spatial resolution is challenging due to low SNR and long acquisition times. Therefore, denoising is potentially critical to making these techniques feasible in a research and clinical setting. The purpose of this study was to compare the performance of MPPCA vs. T-NORDIC denoising of 3D T2 maps of the femoral head in a piglet model of LCPD. We hypothesized that T-NORDIC would better preserve structural details in the T2 maps than MPPCA while also reproducing the quantitative T2 values and providing a significant improvement in T2 map SNR and overall image quality.METHODS
3T MRI: We retrospectively evaluated 3D T2 maps of the femoral heads of n=12 piglets acquired as part of an IACUC-approved piglet model study. The bilateral hips of the 12 piglets were imaged in vivo using a Siemens Prisma 3T MRI scanner with flex receiver arrays. The imaging protocol (Table 1) included: (i) morphological 3D DESS for segmentation; and (ii) 3D T2, adiabatic T1ρ, and adiabatic T2ρ mapping using a magnetization-prepared SPACE sequence. We focused on analysis of the T2 maps, but the weighted images from the adiabatic T1ρ and T1ρ map acquisitions were additionally used to test the influence of the parametric dimension (4 vs. 12 weighted images) on denoising performance.Data Analysis: Algorithms developed using MATLAB were used to compute T2 relaxation time maps with and without denoising using 2 approaches: MPPCA2 and T-NORDIC1. T-NORDIC, a local low rank (LLR) denoising approach, utilized MPPCA in the transform (Fourier) domain to determine the noise threshold. Denoising was performed using either 4 (MPPCA_4 and T-NORDIC_4) or 12 (MPPCA_12 and T-NORDIC_12) weighted images (i.e., the DICOM magnitude images produced by the scanner). The original and denoised T2 maps were then compared for each the 12 piglets with respect to (i) relative background noise reduction, (ii) spatial blurring, and (iii) quantitative accuracy. Median T2 values were calculated in two regions of interest (ROIs): the secondary ossification center (SOC; i.e., the bone and bone marrow of the femoral head) and the epiphyseal cartilage (EC; i.e., the growth cartilage overlying the femoral head). The ROIs were manually segmented on the 3D DESS images using ITK-SNAP6, and the T2 maps were spatially co-registered to the 3D DESS images to apply the 3D ROI masks. The percentage differences in ROI T2 values were then calculated between the original and denoised maps. The relative reduction of background noise of the denoised weighted images was estimated by calculating the standard deviation of a noise-only background region.
RESULTS
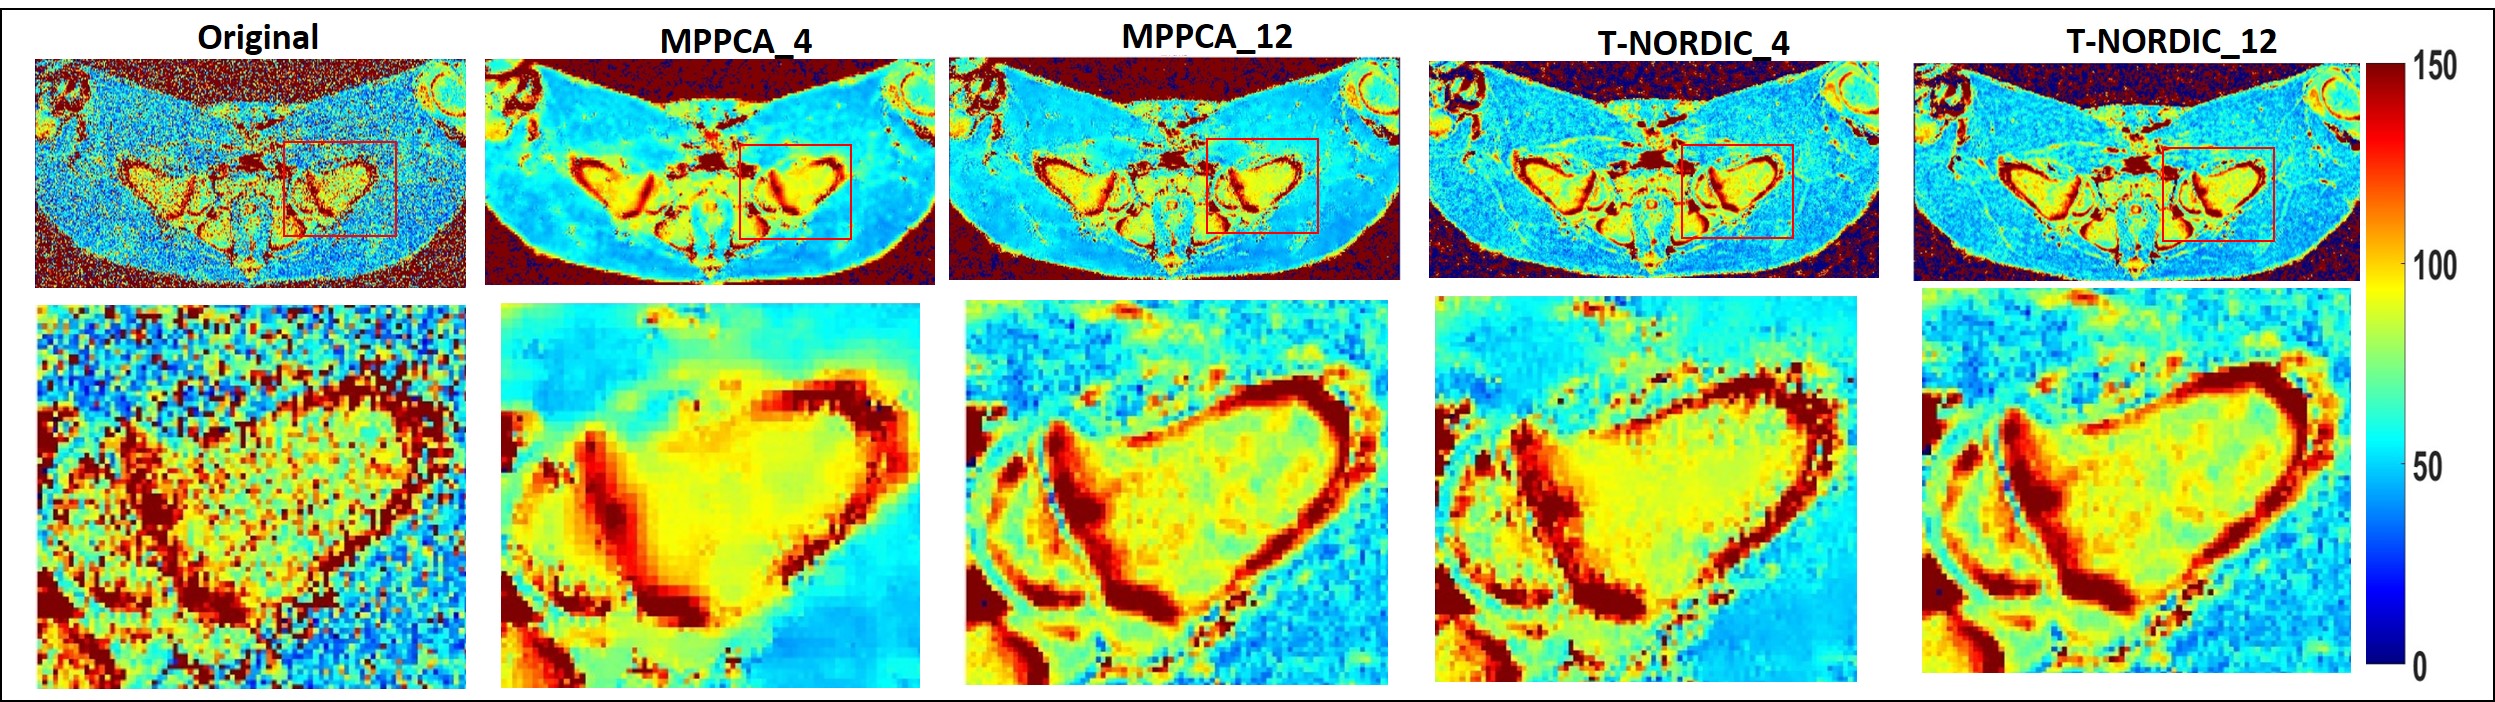
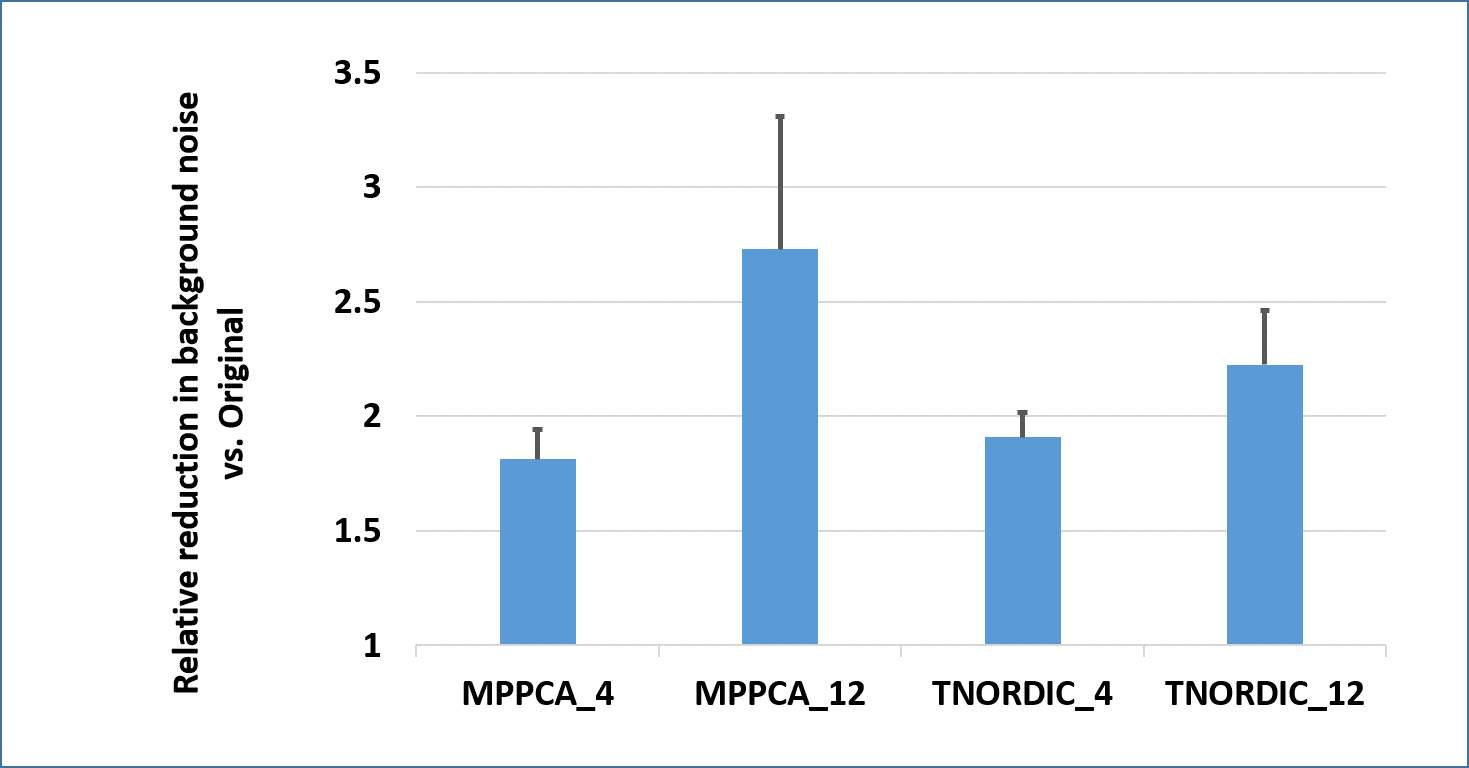
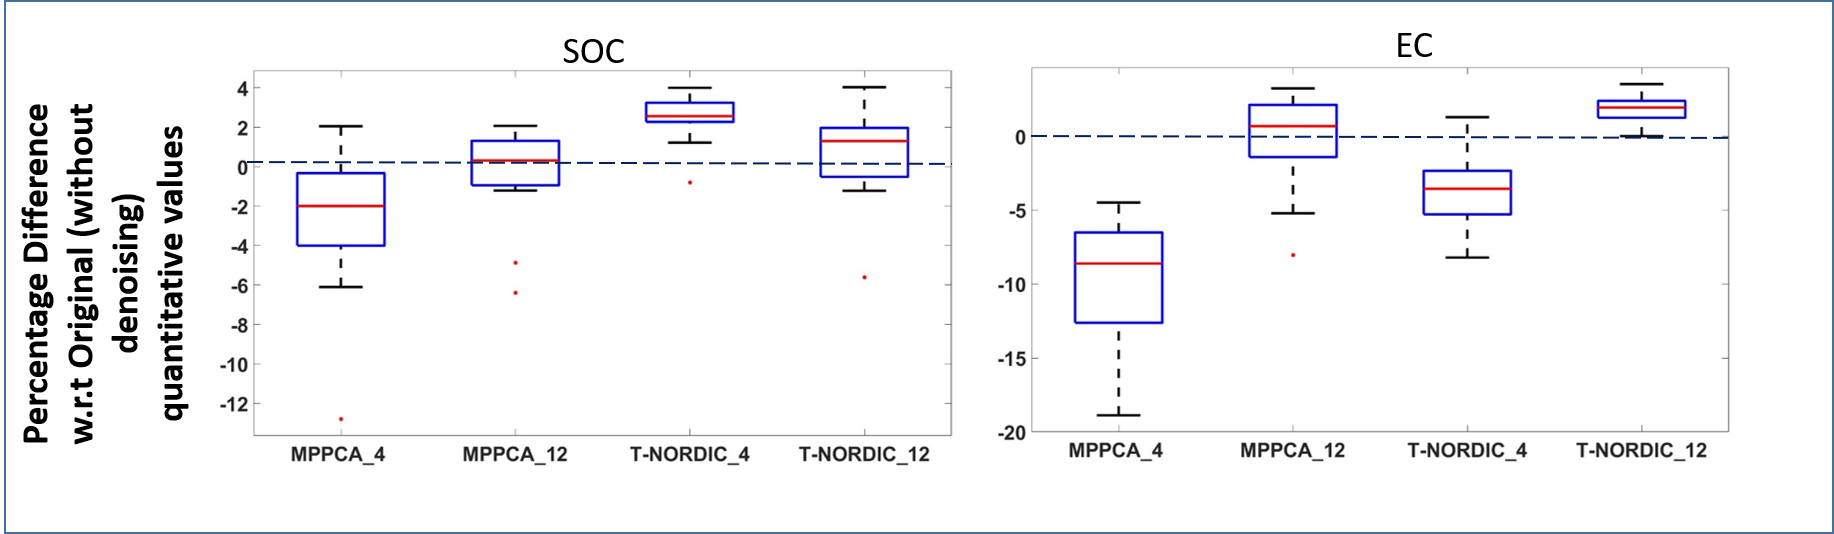
The original and denoised T2 maps for one of the piglets are shown in Figure 1. Qualitatively, the SNR is considerably greater for the denoised maps. MPPCA_4 denoising blurred the T2 maps, while T-NORDIC_4 preserved the anatomical details. The MPPCA_12 and T-NORDIC_12 maps appear similar to T-NORDIC_4. There was a 2- to 3-fold reduction in background noise in the denoised images (Figure 2); Quantitative T2 values for the SOC and EC ROIs are shown in Table 2, and the corresponding percentage change in the denoised vs. original T2 maps are plotted in Figure 3. MPPCA_12 and T-NORDIC_12 better reproduced the ROI values of the original T2 map than MPPCA_4 and T-NORDIC_4.DISCUSSION
Our findings demonstrate that MPPCA and T-NORDIC can dramatically improve image quality for magnetization-prepared T2 mapping of the hip joint. In particular, T-NORDIC provides high denoising performance even if there are only four weighted images (i.e., four echo times) available to generate the T2 map. MPPCA requires additional weighted images (i.e., a larger parametric dimension) to reduce spatial blurring. In conclusion, T-NORDIC is a particularly promising denoising approach for relaxation time mapping with a limited parametric dimension.Acknowledgements
This study was supported by the National Institutes of Health (R01AR081877, R56AR078315, and P41EB027061). The content is solely the responsibility of the authors and does not necessarily represent the official views of the National Institutes of Health.References
1. Moeller S, Johnson CP, Buko EO, Toth F, Metzger G, Mangia S, Michaeli S, Ponticorvo S, Canna A, Ugurbil K, Akcakaya M. Locally low-rank denoising in transform domains. Proc ISMRM 2023 (Toronto); No. 1108.
2. Veraart J, Novikov DS, Christiaens D, Ades-Aron B, Sijbers J, Fieremans E. Denoising of diffusion MRI using random matrix theory. Neuroimage. 2016; 142:394–406.
3. Johnson CP, Wang L, Tóth F, Aruwajoye O, Carlson CS, Kim HK, Ellermann JM. Quantitative MRI helps to detect hip ischemia: preclinical model of Legg-Calvé-Perthes disease. Radiology 2018; 289(2):386-395.
4. Johnson CP, Tóth F, Carlson CS, Armstrong AR, Zbýň Š, Wu B, Ellermann JM, Kim HKW. T1ρ and T2 mapping detect acute ischemic injury in a piglet model of Legg-Calvé-Perthes disease. J Orthop Res 2022; 40(2):484-494.
5. Kim HK. Pathophysiology and new strategies for the treatment of Legg-Calve-Perthes disease. J Bone Joint Surg Am 2012; 94:659-669.
6. Yushkevich PA, Piven J, Hazlett HC, Smith RG, Ho S, Gee JC, Gerig G. User-guided 3D active contour segmentation of anatomical structures: significantly improved efficiency and reliability. Neuroimage 2006; 31(3):1116-28.
Figures