1524
Correlation between vertebral bone marrow T2* value and bone mineral density and its role in diagnosing osteoporosis1Chengdu Sport university, Chengdu Sichuan, China, 2Sichuan Province Orthopedic Hospital, Chengdu 610041, Sichuan, China, 3GE HealthCare MR Research, Beijing, China
Synopsis
Keywords: Bone, MR Value
Motivation: The relationship between vertebral bone marrow T2* value and bone mineral density (BMD) has been rarely reported and remains controversial.
Goal(s): The study aimed to analyze the correlation between T2* and BMD and evaluate the efficacy of T2* in diagnosing osteoporosis.
Approach: The IDEAL IQ MR Sequence was used to measure vertebral bone marrow T2* and quantitative computed tomography (QCT) was used to measure BMD.
Results: Vertebral T2* was negatively correlated with BMD. While T2* can serve as a supplementary indicator for diagnosing osteoporosis, it should not be relied upon as the sole diagnostic indicator.
Impact: MRI-based T2* value provides a safer way for quantitative assessment of OP, and may be used as a complement to BMD to improve the accuracy of early diagnosis of OP.
Introduction
Osteoporosis (OP) is a systemic disease characterized by reduced bone mass1. Currently, dual-energy x-ray absorbent instrument (DXA) or QCT is commonly used to diagnose OP. QCT is currently the most advanced equipment, allows for accurate assessment of volumetric BMD (vBMD) of trabecular bone without the limitations of DXA2. Nonetheless, BMD measured by QCT is affected by the presence of bone marrow adipose tissue (BMAT)3-4, which can decrease BMD values5. MR has distinct advantages in quantifying bone marrow composition6. Chemical shift-encoded IDEAL-IQ MR sequence has been proven to be a convenient and accurate technique for quantifying MAT7-8. Its associated measurements, fat fraction and R2* can be used to quantify vertebral MAT and aid in the diagnosis of the bone mass and OP. T2*, the reciprocal of R2*, is a novel derived parameter that can reflect the spatial distribution, morphology, quantity, and arrangement of trabecular bone structure, indirectly indicating BMD9-10. However, the relationship between T2* and BMD has been rarely reported and remains controversial. The objective of this study is to utilize the IDEAL-IQ MR sequence for measuring vertebral bone marrow T2* and QCT for measuring BMD, to analyze the correlation between T2* and BMD, and to evaluate the diagnostic efficacy of T2* in osteoporosis.Methods
Patients: After IRB-approved written informed consent was obtained, patients with lumbar and leg pain were scanned on 3.0T MRI (SIGNA Architect, GE Healthcare) and CT (Siemens Somatom Definition AS+) to measure T2* and BMD of the L1 and L2 vertebral bodies. Finally, 469 patients (aged 24-88 years, 241 women) were enrolled.Imaging parameters: The MR scans include both clinical sequences and axial IDEAL-IQ (2.0x2.0x2.0mm3, TR =8.0ms, TE=3.6ms, number of TEs=6, number of shots =2). The CT equipment was calibrated using the standard phantom (QCT Pro v4.0Mindways, KVp120, FOV501mm, height115.50cm).
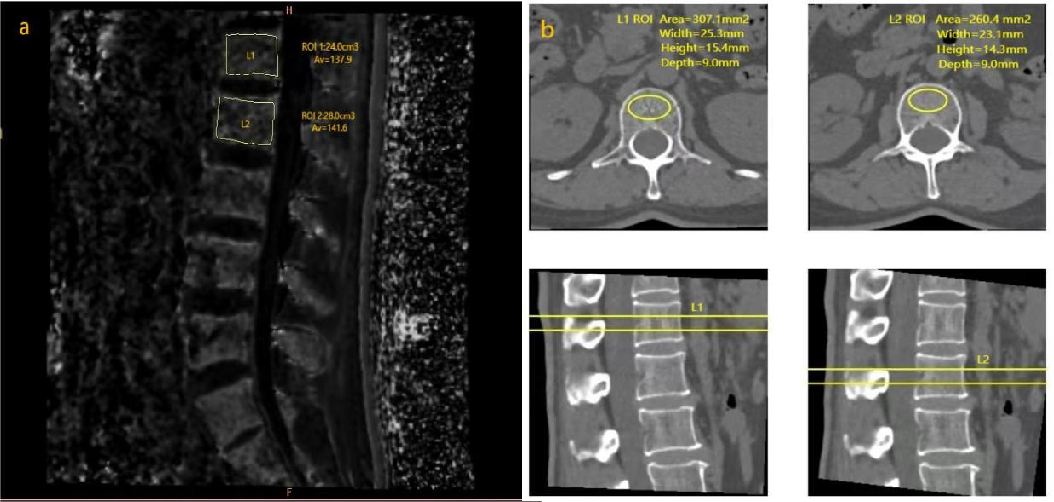
Data processing: The measurement of T2* was performed on AW 4.7 workstation. The region of interest (ROI) was outlined in the median sagittal diagram of the vertebral body (Figure 1). The target range aimed to encompass the entire vertebral body as much as possible and avoid the cortical bone of the vertebral body, intervertebral discs, and posterior spinal veins. The BMD values of lumbar 1 and lumbar 2 were measured using after scanning QCT Pro 3D analysis software. According to BMD values, patients are divided into three groups: Group 1, normal bone mass (BMD>120mg/cm³, 258); Group 2, osteopenia (80≤BMD≤120mg/cm3, 155); and Group 3, osteoporosis (BMD<80mg/cm³, 56).
Statistical analysis: All analyses were performed using SPSS 26.0 software. The differences of T2* and BMD among 3 groups were assessed by one-way analysis of variance (ANOVA). Pearson correlation coefficient was used for analyzing the correlation between T2* and BMD. Logistic regression analysis is used to predict the probability of osteoporosis based on T2* values. ROC curve is plotted to assess the diagnostic performance of T2* in predicting osteoporosis. The area under the curve (AUC) is calculated to analyze the effectiveness of T2* in diagnosing osteoporosis.
Results
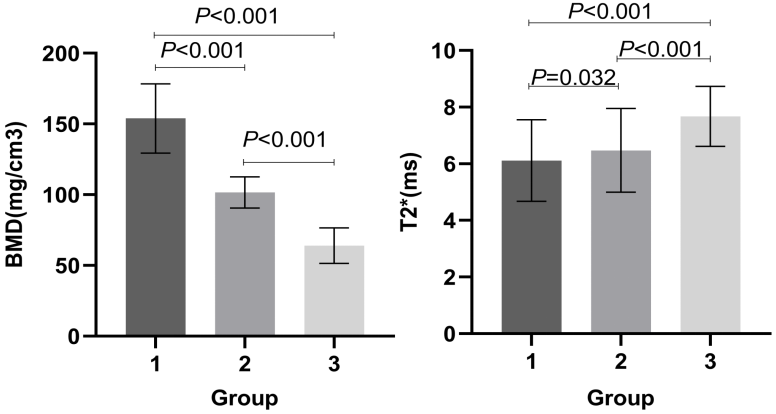
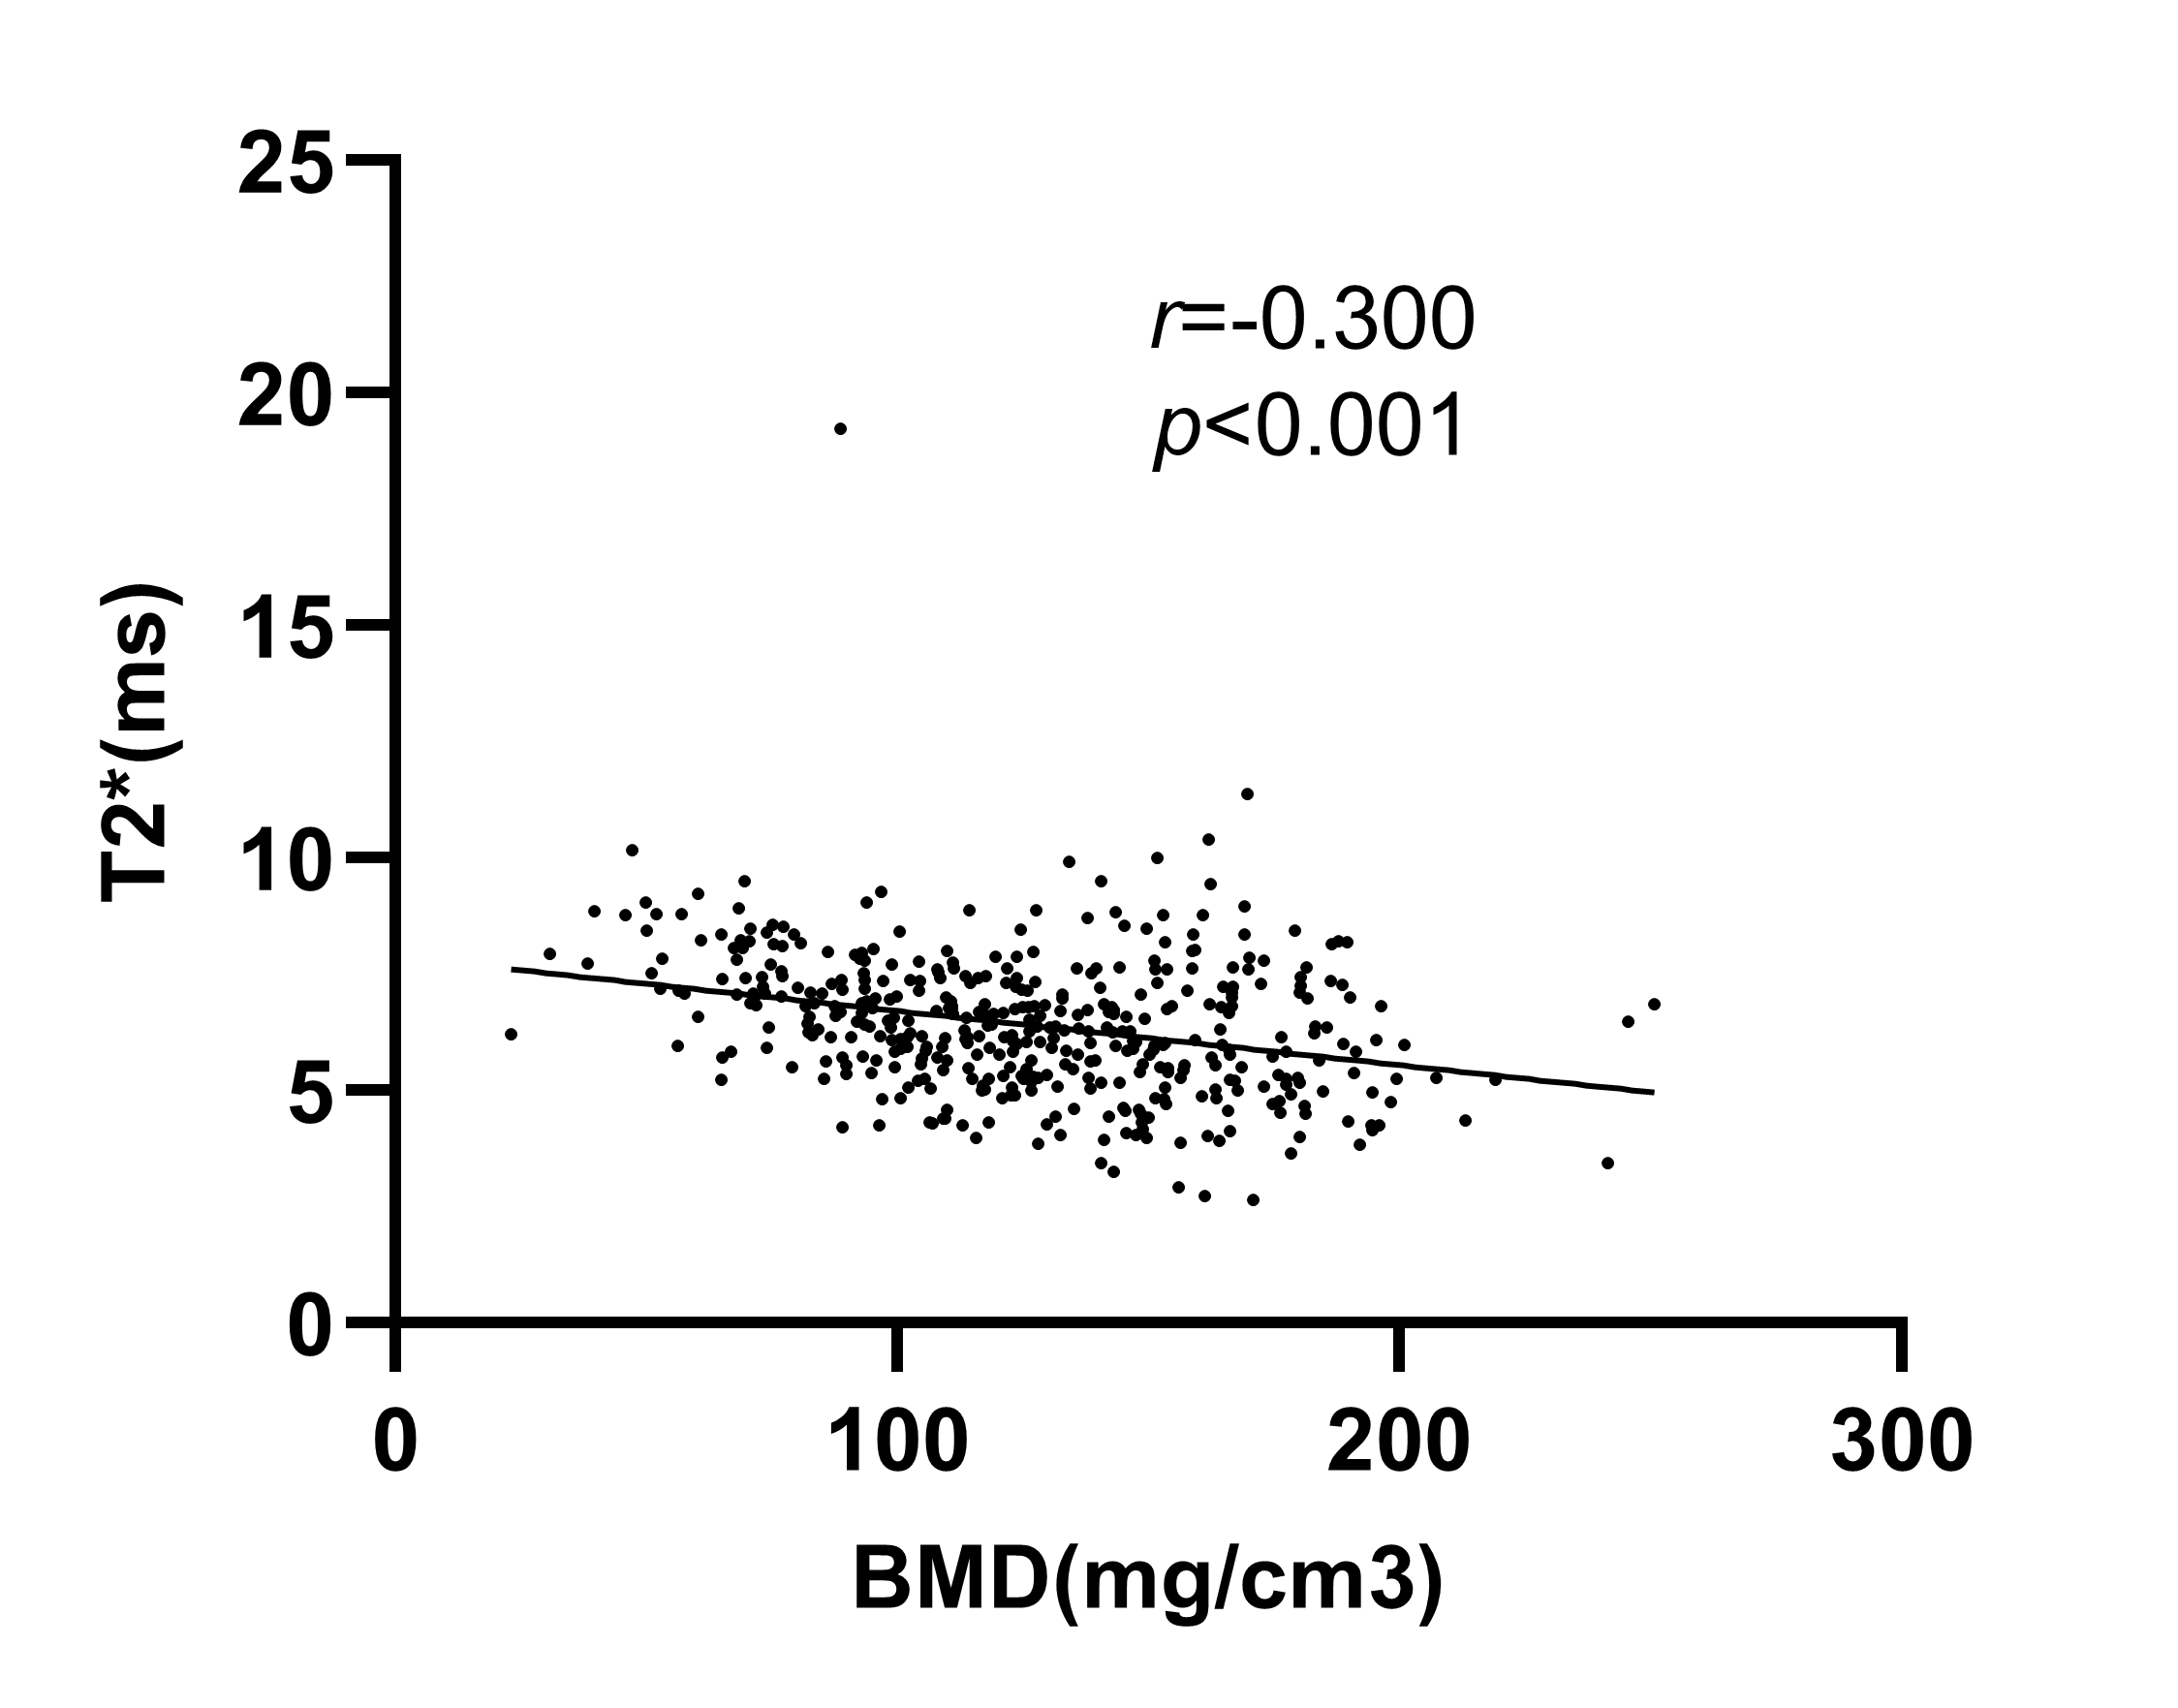
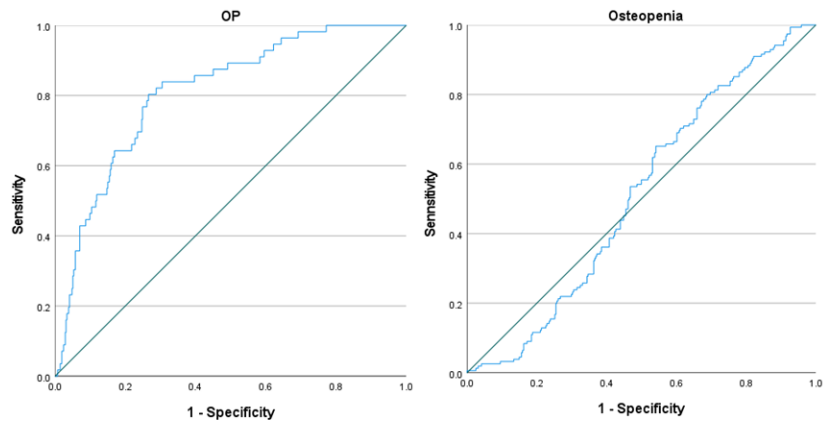
As shown in Figure 2, T2* and BMD were statistically significant among 3 groups (P< 0.05). As shown in Figure3, Pearson analysis showed a weak correlation between T2* and BMD (r = −0.300,P< 0.001). As shown in Table 1, the coefficient of Hosmer test in Logistic regression was 0.321 (P>0.05), OR=1.787. As shown in Figure 4, The ROC curve demonstrates that the AUC for T2* in diagnosing osteoporosis is 0.809 [95%CI (0.753, 0.865)]. The optimal cutoff value is 7.00, with a sensitivity of 80.4% and a specificity of 73.4% (P<0.001). The T2* diagnosis of osteopenia was not statistically significant.Discussion
The results showed a weak linear relationship between T2* and BMD, which is consistent with previous studies11. Based on related research analysis, this relationship is associated with the deposition of ferritin in the bone marrow, where higher iron content leads to smaller T2* values12-13. Based on ROC results, it is evident that T2* has a higher AUC in diagnosing OP compared to diagnosing osteopenia. This indicates that while T2* can reflect microstructural changes in bone trabecular, it cannot be used as an indicator for bone mass reduction. Instead, it can be used as a supplementary measure to BMD for a more precise quantitative assessment of OP.Acknowledgements
No acknowledgement found.References
1.Consensus development conference: diagnosis, prophylaxis, and treatment of osteoporosis.” The American journal of medicine vol. 94,6 (1993): 646-50.
2.Adams, Judith E. “Quantitative computed tomography.” European journal of radiology vol. 71,3 (2009): 415-24.
3. Goodsitt MM et al. “A new set of calibration standards for estimating the fat and mineral content of vertebrae via dual energy QCT.” Bone and mineral vol. 13,3 (1991): 217-33.
4.Goodsitt, MM and D I Rosenthal. “Quantitative computed tomography scanning for measurement of bone and bone marrow fat content. A comparison of single- and dual-energy techniques using a solid synthetic phantom.” Investigative radiology vol. 22,10 (1987): 799-810.
5.Bredella MA, Daley SM, Kalra MK, Brown JK, Miller KK, Torriani M. Marrow Adipose Tissue Quantification of the Lumbar Spine by Using Dual-Energy CT and Single-Voxel (1)H MR Spectroscopy: A Feasibility Study. Radiology. 2015 Oct;277(1):230-5.
6.Chiarilli, Maria Grazia et al. “Bone marrow magnetic resonance imaging: physiologic and pathologic findings that radiologist should know.” La Radiologia medica vol. 126,2 (2021): 264-276.
7.Kim, Hyeonjin et al. “Comparative MR study of hepatic fat quantification using single-voxel proton spectroscopy, two-point dixon and three-point IDEAL.” Magnetic resonance in medicine vol. 59,3 (2008): 521-7.
8.Watanabe, Daisuke et al. “Feasibility of assessing male osteoporosis using MRI IDEAL-IQ sequence of proximal femur in prostate cancer patients.” The aging male: the official journal of the International Society for the Study of the Aging Male vol. 25,1 (2022): 228-233.
9.Zeng Z, Ma X, Guo Y, et al. Quantifying bone marrow fat fraction and iron by MRI for distinguishing aplastic anemia from myelodysplastic syndromes. J Magn Reson Imaging. 2021;54(6):1754–1760.
10.1. Brismar TB (2000) MR relaxometry of lumbar spine, hip, and calcaneus in healthy premenopausal women: relationship with dual energy X-ray absorptiometry and quantitative ultrasound. Eur Radiol 10:1215–1221.
11. Liu Z, Huang D, Jiang Y, Ma X, Zhang Y, Chang R. Correlation of R2* with fat fraction and bone mineral density and its role in quantitative assessment of osteoporosis. Eur Radiol. 2023 Sep;33(9):6001-6008.
12. Nazarova E E, Tereshchenko G V, Kupriyanov D A, et al. Free-breathing T2*mapping for MR myocardial iron assessment at 3 T[J]. Eur Radiol Exp,2020,4(1):25.
13.Triadyaksa P, Oudkerk M, Sijens P E. Cardiac T2 * mapping: Techniquesand clinical applications[J]. J Magn Reson Imaging, 2020,52(5):1340-1351.
Figures