1517

DCE-MRI and Micro-CT Integration for Evaluating Changes in Endothelial Progenitor Cell Function and Bone Microstructure in Diabetic Rabbits
fei cai1, yunfei zha1, and Weiyin Vivian Liu2
1Renmin Hospital, Wuhan University, Wuhan, China, 2GE Healthcare,MR Research, Beijing, China

Synopsis

Keywords: Vascular, DSC & DCE Perfusion

Motivation: By investigating changes in bone marrow microvascular permeability and bone microstructure, we can explore the key pathological and physiological mechanisms underlying impaired vascular repair in diabetes

Goal(s): To assess the functional changes in endothelial progenitor cells (EPCs) and alterations in bone microstructure in rabbits with severe limb ischemia complicated by diabetes mellitus using DCE-MRI and micro Micro-CT

Approach: 30 healthy male New Zealand white rabbits underwent sagittal MR imaging of the femoral bone proximal coronal plane at fixed time points

Results: DCE-MRI combined with Micro-CT quantitative parameters is feasible to evaluate endothelial progenitor cell function and changes in bone microstructure in diabetes mellitus

Impact: The results of this study will provide a new perspective on the pathological and physiological mechanisms underlying bone marrow changes in diabetic patients with concurrent critical limb ischemia.

Introduction:The objective of this study was to assess the functional changes in endothelial progenitor cells (EPCs) and alterations in bone microstructure in rabbits with severe limb ischemia complicated by diabetes mellitus using dynamic contrast-enhanced magnetic resonance imaging (DCE-MRI) and micro computed tomography (Micro-CT).

Methods: 30 healthy male New Zealand white rabbits were randomly divided into three groups: diabetes mellitus with critical limb ischemia group (DM+CLI, n=10), diabetes mellitus group (DM, n=10), and control group (Con, n=10). All rabbits underwent sagittal MR imaging of the femoral bone proximal coronal plane at fixed time points (0, 4, 8, 12, and 16 weeks after alloxan injection). After completing the examinations at week 16, bone marrow and peripheral blood endothelial progenitor cell counts were conducted, as well as peripheral blood endothelial progenitor cell function assessments. Additionally, specimens from the upper segment of the femur were obtained for Micro-CT scanning to obtain morphometric parameters of trabecular bone

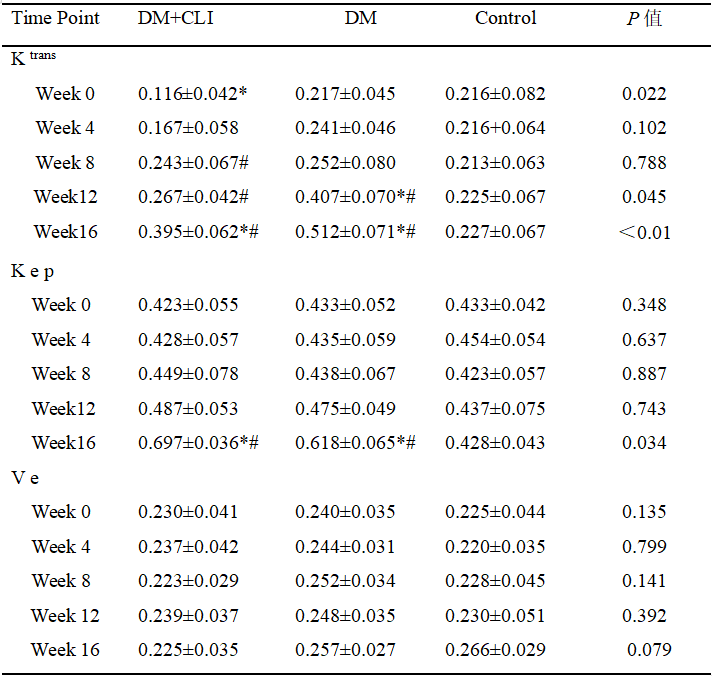
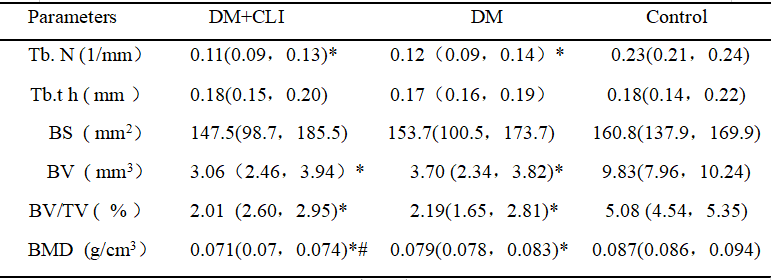
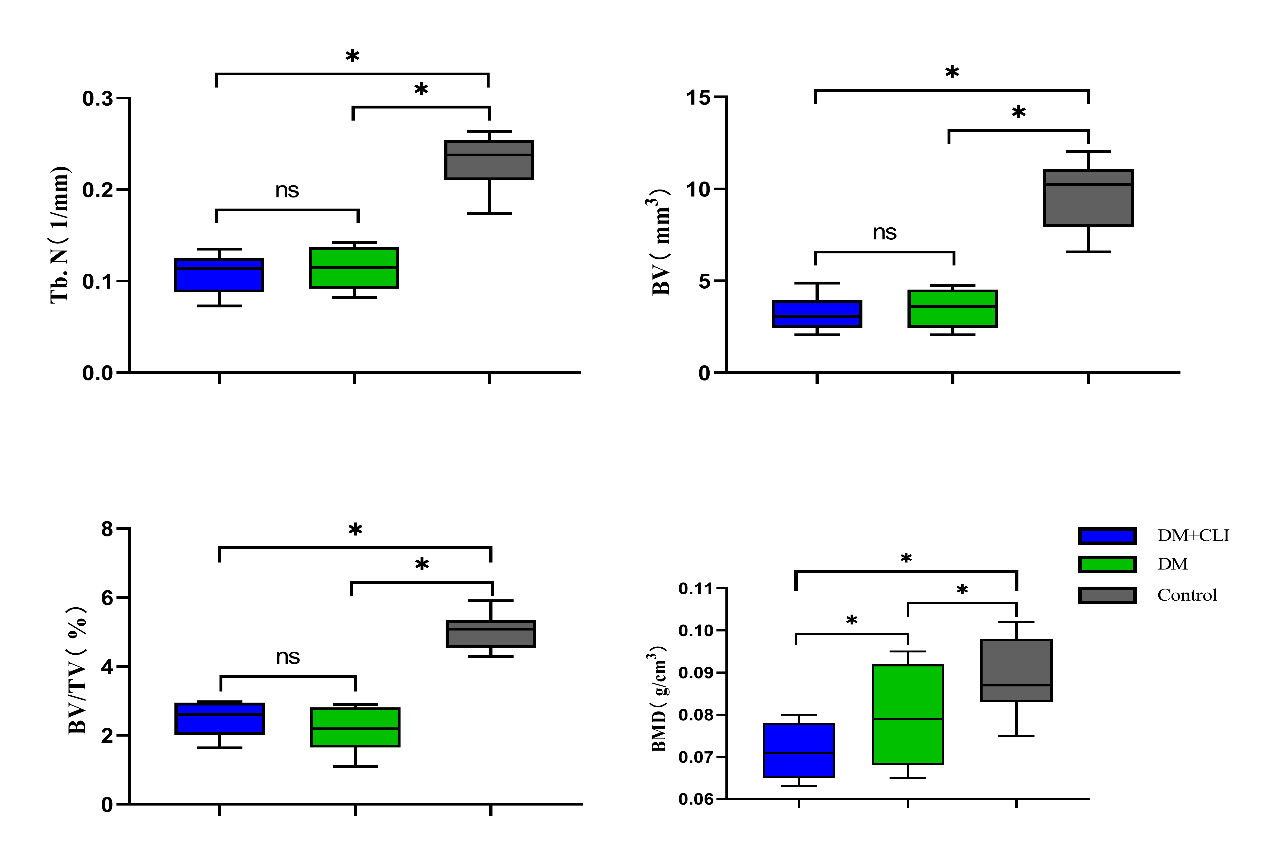
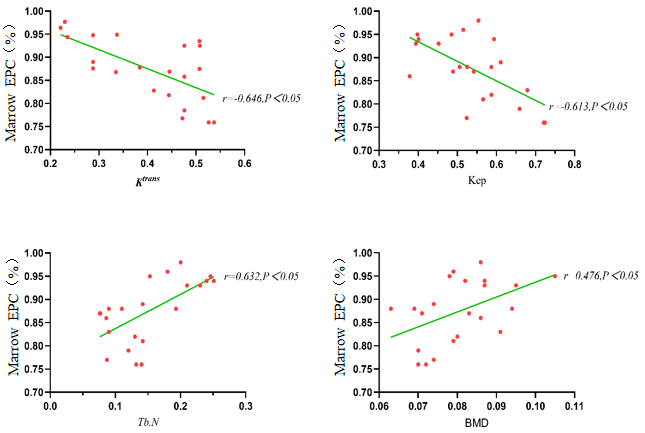
Results: In the group with diabetes mellitus complicated by limb ischemia, the Ktrans values significantly decreased after successful modeling, but showed a significant increase at 8 weeks. In the diabetes mellitus group, the Ktrans values significantly increased at 12 weeks. Both groups showed a significant increase in Kep values at 16 weeks. There was no statistically significant difference in Ve values at any time point. The control group did not show any significant differences in the permeability parameters at any time point. At 16 weeks, Micro-CT analysis revealed significant decreases in trabecular bone parameters including trabecular number (Tb.N), bone volume (BV), volume fraction (BV/TV), and bone mineral density (BMD) in both the group with diabetes mellitus complicated by limb ischemia and the diabetes mellitus group, compared to the control group. Furthermore, there was a negative correlation between bone marrow CD34+EPC count and Ktrans as well as Kep values, and a positive correlation between CD34+EPC count and Tb.N and BMD.

Conclusion: DCE-MRI combined with Micro-CT quantitative parameters is feasible to evaluate endothelial progenitor cell function and changes in bone microstructure in diabetes mellitus complicated by severe limb ischemia. This approach can provide visual and quantitative imaging evidence for the pathophysiological mechanisms underlying vascular repair impairments.

Acknowledgements

No acknowledgement found.

References

1. Ferraro F, Lymperi S, Mendez-Ferrer S, Saez B, Spencer JA, Yeap BY, Masselli E, Graiani G, Prezioso L, Rizzini EL et al: Diabetes impairs hematopoietic stem cell mobilization by altering niche function. Sci Transl Med 2011, 3(104):104ra101.

2. Santopaolo M, Sambataro M, Spinetti G, Madeddu P: Bone marrow as a target and accomplice of vascular complications in diabetes. Diabetes Metab Res Rev 2020, 36 Suppl 1:e3240.

3. Cheng Z, Garikipati VN, Nickoloff E, Wang C, Polhemus DJ, Zhou J, Benedict C, Khan M, Verma SK, Rabinowitz JE et al: Restoration of Hydrogen Sulfide Production in Diabetic Mice Improves Reparative Function of Bone Marrow Cells. Circulation 2016, 134(19):1467-1483.

4. Hu L, Zha YF, Wang L, Li L, Xing D, Gong W, Wang J, Lin Y, Zeng FF, Lu XS: Quantitative Evaluation of Vertebral Microvascular Permeability and Fat Fraction in Alloxan-induced Diabetic Rabbits. Radiology 2018, 287(1):128-136.

5. Liu B, Hu L, Wang L, Xing D, Peng L, Chen P, Zeng F, Liu WV, Liu H, Zha Y: Evaluation of microvascular permeability of skeletal muscle and texture analysis based on DCE-MRI in alloxan-induced diabetic rabbits. Eur Radiol 2021, 31(8):5669-5679.

6. Sacher SE, Hunt HB, Lekkala S, Lopez KA, Potts J, Heilbronner AK, Stein EM, Hernandez CJ, Donnelly E: Distributions of Microdamage Are Altered Between Trabecular Rods and Plates in Cancellous Bone From Men With Type 2 Diabetes Mellitus. J Bone Miner Res 2022, 37(4):740-752.

Figures
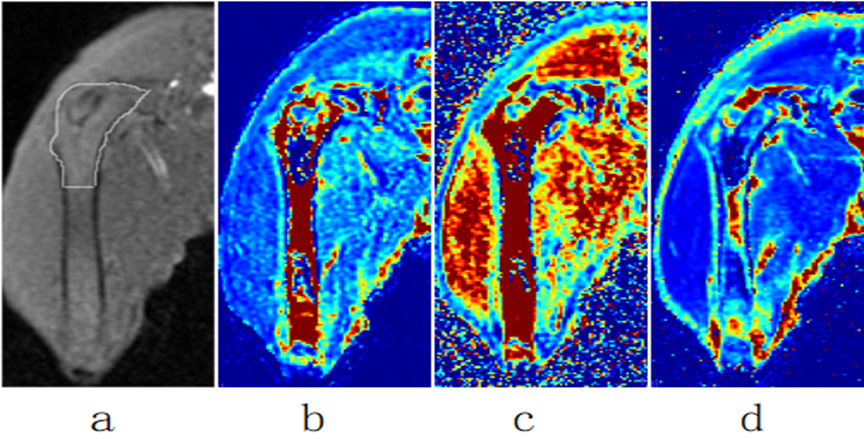
Figure 1:Images of different sequences in rabbits of the group with diabetes and concurrent limb ischemia. a) Enhanced MRI image of the femoral coronal LAVA sequence, with the manually delineated ROI of the upper femur shown in white. b) Pseudo color map of K trans. c) Pseudo color map of Kep. d) Pseudo color map of Ve.

Table 1: the comparative results of DCE-MRI quantitative parameters at different points for each experimental group

Table 2:the comparative results of micro-CT trabecular morphological parameters at 16 weeks for each experimental group

Figure 2: Box plots showing the Micro-CT quantitative parameters of the experimental groups

Figure 3: depicts the linear correlation analysis between bone marrow DCE-MRI quantitative parameters, Micro-CT quantitative parameters, and bone marrow CD34+ EPC count at 16 weeks

Proc. Intl. Soc. Mag. Reson. Med. 32 (2024)
1517
DOI: https://doi.org/10.58530/2024/1517