1516
MR‑based proton density fat fractions of the vertebral bone marrow and paraspinal muscle are associated with BMD from QCT in patients with LBP1Chengdu Sport University, Chengdu, China, 2Sichuan Provincial Orthopedics Hospital, Chengdu, China, 3GE HealthCare MR Research, Beijing, China
Synopsis
Keywords: Bone, Bone, Fat
Motivation: The relationship between vertebral bone mineral density (BMD) and fat composition of adjacent vertebral body and paraspinal muscle in patients with low back pain (LBP) remains unclear.
Goal(s): To investigate the association between vertebral BMD and the fat fractions of vertebral bone marrow and paraspinal muscle in LBP patients.
Approach: A retrospective study was conducted on LBP patients who underwent both quantitative computed tomography (QCT) and chemical shift-encoded MRI examinations.
Results: Age, fat fractions of bone marrow and psoas major are independent factors that influence vertebral bone mineral density.
Impact: The fat fraction of vertebral bone marrow and paraspinal muscles independently influences bone mineral density. The MR-based fat fractions may potentially predict osteoporosis and osteoporotic fractures without radiation, providing a safer way to diagnose osteoporotic vertebral fractures and associated complications.
Introduction
As a common occurrence in the middle-aged and elderly population, osteoporosis leads to increased bone fragility in the vertebral body, and causes the development of osteoporotic vertebral fractures1. Osteoporotic fractures are common but difficult to detect. Low back pain (LBP) is a common musculoskeletal disorder that affects a large proportion of the population worldwide. One of the causes of LBP is osteoporotic vertebral fractures, which can lead to pain and disability2. Therefore, it’s crucial to identify patients at high risk for these fractures, which is often reflected by bone mineral density (BMD) from quantitative computed tomography (QCT)3. Recent studies demonstrated that fatty tissue may play a role in bone metabolism4. MRI is better than CT at distinguishing fat from non-fat components5. Chemical shift-encoded MRI technique provides a radiation-free way to accurately measure the proton density fat fraction (PDFF) of muscle and bone6,7. Several studies have investigated the relationship between vertebral bone marrow fat, BMD, and vertebral fractures8. However, there is still a need to explore the correlation between bone and fat composition in LBP patients. Therefore, this study aimed to investigate the association between vertebral volumetric BMD (vBMD) and PDFF of vertebral bone marrow (BM) and paraspinal muscle (PSM) in LBP patients.Methods
Patients: After IRB-approved written informed consent was obtained, LBP patients were scanned on 3.0 T MRI (SIGNA Architect, GE Healthcare) and CT (Siemens Somatom Definition AS+) to measure PDFF of BM and PSM, and vertebral vBMD, respectively. Finally, 509 subjects (24-76 years, 267 females) were enrolled in this retrospective study.MR imaging parameters: The MR scan included axial T2 FSE (0.5×0.8×3.0mm3, TR=3224ms, TE=120ms), axial IDEAL-IQ (2.0×2.0×2.0mm3, TR=8.0ms, TE=3.6ms, number of TEs=6, number of shots=2).
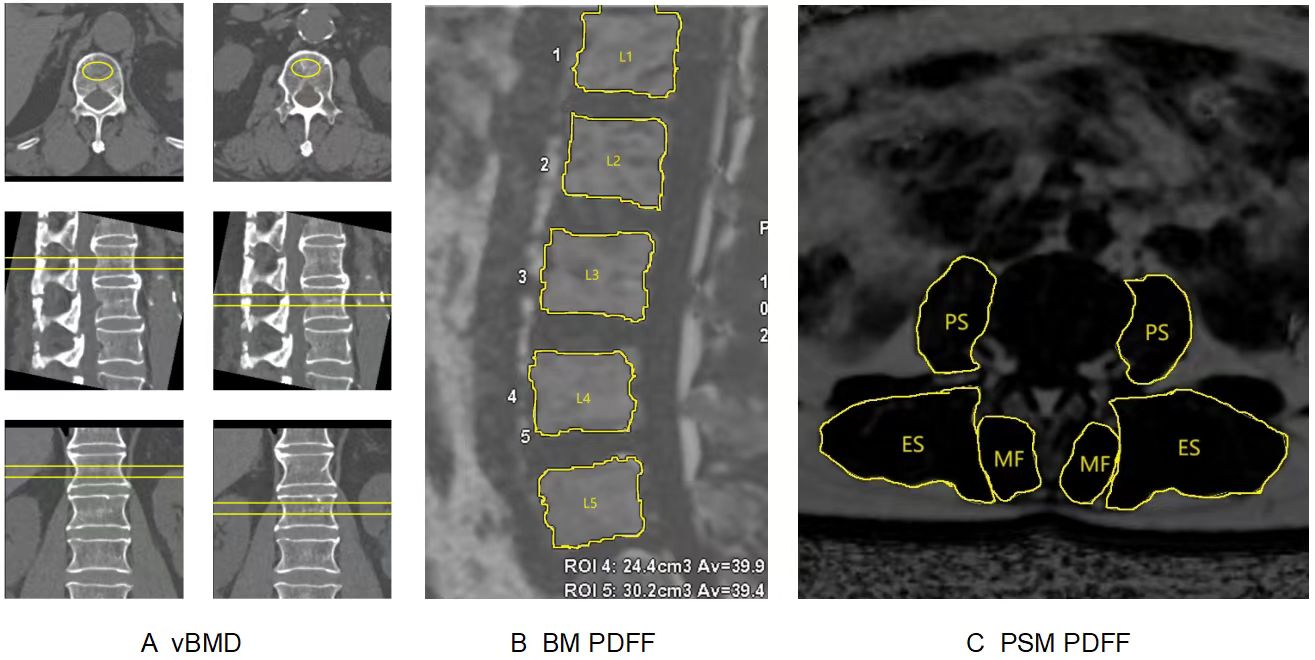
Data processing: CT data were transmitted to the QCT Pro workstation to measure the mean vBMD of two vertebral bodies at L1 and L2 levels (Figure 1A). The IDEAL-IQ images were processed in AW4.7 workstation to calculate PDFF map. ROIs of the L1-L5 vertebrae were obtained in sagittal plane, avoiding cortical bone and outlining the entire vertebral cancellous bone (Figure 1B). The mean PDFF values of bilateral paraspinal muscles including multifidus (MF), erector spinae (ES) and psoas major (PS) were obtained on a ROIs basis at the central level of L1/2 to L5/S1 (Figure 1C), respectively.
Statistical analysis: All analyses were performed using SPSS 22.0 software. All patients were divided into normal bone density (vBM>120mg/cm3), osteopenia (vBMD 80 to 120mg/cm3) and osteoporosis groups (vBMD<80mg/cm3) as recommended by the ISCD in 20079. The normality of data was analyzed by P-P Chart. The differences of PDFF, age and BMI among the three vBMD groups were tested by one-way ANOVA with post hoc analysis (LSD). The relationship between PDFF and vBMD, age, BMI were analyzed using Pearson correlation coefficients. The relationship between vBMD and PDFF was further tested using multiple linear regression with sex, age and BMI variables. Differences were considered statistically significant at p<0. 05.
Results
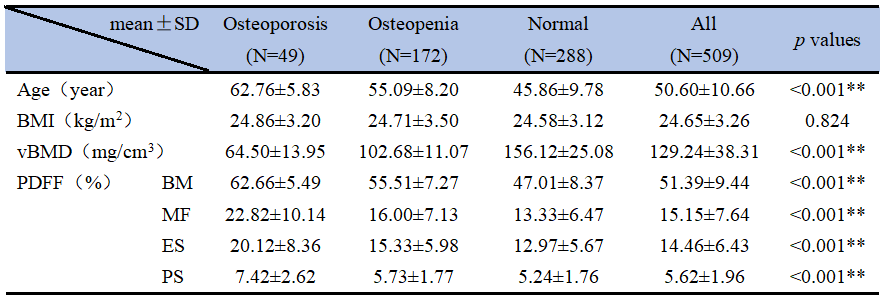
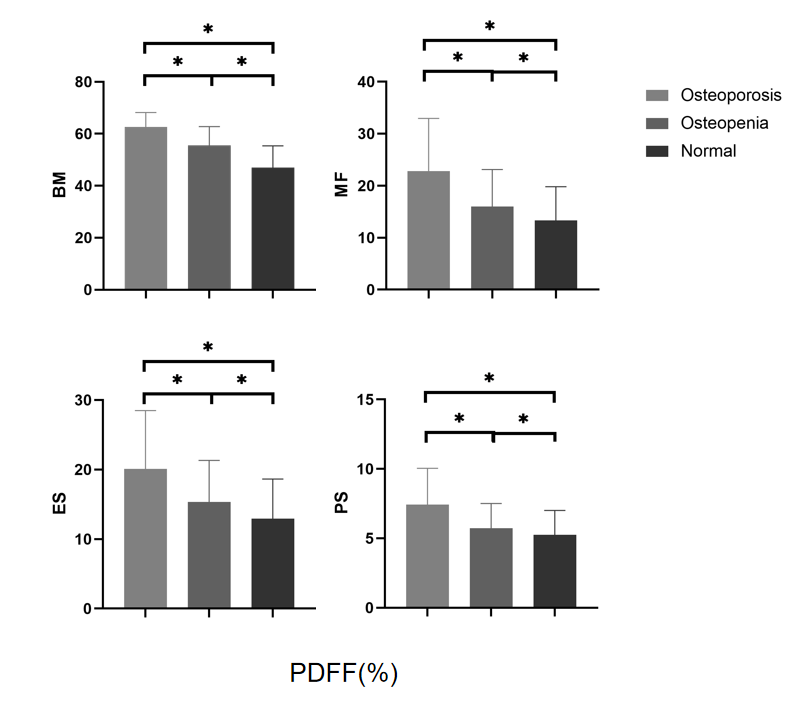
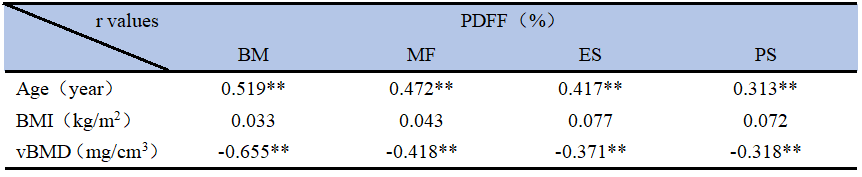
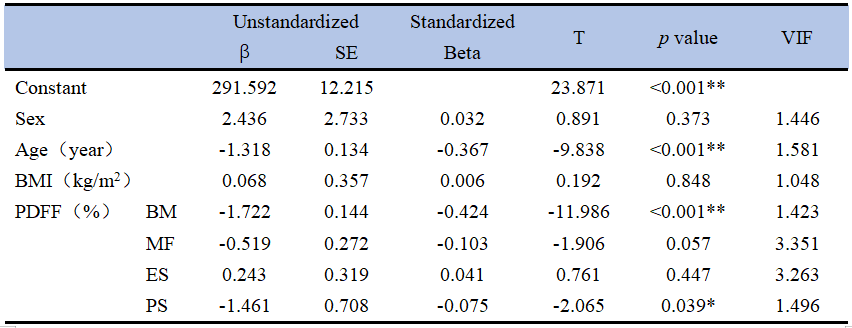
As shown in Table 1 and Figure 2, vBMD, age, PDFF were significantly different among three groups (p<0.001). As shown in Table 2, correlation analysis showed that vBMD was moderately to severely negatively correlated with PDFF (p<0.01), and was especially pronounced with BM PDFF (r=-0.655; p<0.01). Age was moderately positively correlated with PDFF (p<0.01). However, there was no significant correlation between BMI and PDFF (p>0.05). As shown in Table 3, the R2 and adjusted R2 of multiple linear regression model were 0.559 and 0.553, respectively (p<0.05). The model revealed that age (β=-0.367, p<0.001), BM PDFF (β=-0.424, p<0.001) and PS PDFF (β=-0.075, p=0.039) were independent factors of vBMD. However, MF PDFF (p=0.397) and ES PDFF (p=0.328) were not associated with vBMD.Discussion
The innovative aspect of this study was to investigate the relationship between lumbar vBMD and fat fractions of vertebral bone marrow and paraspinal muscle in LBP patients. Age, BM PDFF and PS PDFF are independent factors of vBMD. PDFF maybe a potential imaging biomarker for assessing the risk of osteoporosis, which provides a safer way to predict and prevent fractures in advance.Conclusion
Our results demonstrated that in patients with LBP, PDFF of bone marrow and paraspinal muscle increased with decreasing vBMD. Age, bone marrow fat fractions and psoas major fat fractions are independent factors of vBMD. In the future, it is possible that predicting osteoporosis through vertebral bone marrow fat fraction may improve the detection rate of osteoporotic fractures, which is important for reducing osteoporotic vertebral fractures and complications.Acknowledgements
No acknowledgement found.References
1. van den Bergh JP, Szulc P, Cheung AM, Bouxsein M, Engelke K, Chapurlat R. The clinical application of high-resolution peripheral computed tomography (HR-pQCT) in adults: state of the art and future directions. Osteoporos Int. 2021;32(8):1465-1485. doi:10.1007/s00198-021-05999-z
2. Wáng YXJ, Du EZ, Gong J, Cheng X. Interpretation of osteoporotic vertebral deformity on frontal view radiographs of the chest and abdomen: a pictorial review. Quant Imaging Med Surg. 2021;11(1):423-442. doi:10.21037/qims-2020-28
3. Mao SS, Li D, Syed YS, et al. Thoracic Quantitative Computed Tomography (QCT) Can Sensitively Monitor Bone Mineral Metabolism: Comparison of Thoracic QCT vs Lumbar QCT and Dual-energy X-ray Absorptiometry in Detection of Age-relative Change in Bone Mineral Density. Acad Radiol. 2017;24(12):1582-1587. doi:10.1016/j.acra.2017.06.013
4. Goetz TG, Nair N, Shiau S, et al. In premenopausal women with idiopathic osteoporosis, lower bone formation rate is associated with higher body fat and higher IGF-1. Osteoporos Int. 2022;33(3):659-672. doi:10.1007/s00198-021-06196-8
5. Erlandson MC, Lorbergs AL, Mathur S, Cheung AM. Muscle analysis using pQCT, DXA and MRI. Eur J Radiol. 2016;85(8):1505-1511. doi:10.1016/j.ejrad.2016.03.001
6. Syväri J, Junker D, Patzelt L, et al. Longitudinal changes on liver proton density fat fraction differ between liver segments. Quant Imaging Med Surg. 2021;11(5):1701-1709. doi:10.21037/qims-20-873
7. Gersing AS, Holwein C, Suchowierski J, et al. Cartilage T2 Relaxation Times and Subchondral Trabecular Bone Parameters Predict Morphological Outcome After Matrix-Associated Autologous Chondrocyte Implantation With Autologous Bone Grafting. Am J Sports Med. 2020;48(14):3573-3585. doi:10.1177/0363546520965987
8. Gassert FT, Kufner A, Gassert FG, et al. MR-based proton density fat fraction (PDFF) of the vertebral bone marrow differentiates between patients with and without osteoporotic vertebral fractures. Osteoporos Int. 2022;33(2):487-496. doi:10.1007/s00198-021-06147-3
9. Baim S, Binkley N, Bilezikian JP, et al. Official Positions of the International Society for Clinical Densitometry and executive summary of the 2007 ISCD Position Development Conference. J Clin Densitom. 2008;11(1):75-91. doi:10.1016/j.jocd.2007.12.007
Figures