1515
Quantitative evaluation of bone marrow microenvironment of the lumbar and sacroiliac joints in ankylosing spondylitis by MRI mDixon-Quant1Affiliated Hospital of Guizhou Medical University, Guiyang, China, 2Philips Healthcare, Shanghai, China
Synopsis
Keywords: Skeletal, Quantitative Imaging, Musculoskeletal
Motivation: The development of ankylosing spondylitis(AS) is associated with alterations in bone marrow microenvironment.
Goal(s): To quantitatively analyze changes and correlations of the lumbar and sacroiliac joints bone marrow microenvironment in AS using MRI mDixon-Quant.
Approach: Fat fraction (FF) and T2* were measured in the lumbar, bone marrow edema (BME), fat metaplasia (FM) of sacroiliac joints.
Results: FF value in the lumbar of the AS group demonstrated a significant increase compared to the normal control group, positively correlating with FF value in FM of sacroiliac joints. FF and T2* showed significant differences between BME and FM in sacroiliac joints.
Impact: FF and T2* values help to quantitatively analyze variations in the bone marrow microenvironment of lumbar and sacroiliac joints in AS, providing MRI evidence for the mechanism of osteoporosis in AS, while also guiding clinical treatment for inflammation-associated osteopenia.
Introduction
Ankylosing spondylitis (AS) is a chronic autoimmune inflammatory disease that commonly affects the spine and sacroiliac joints of young individuals[1]. Lesions that are fatty, bony, and inflammatory are common abnormalities in AS[2]. Bone marrow edema (BME) is believed to indicate the activity of AS, while fat metaplasia (FM) occurs as a result of BME [3]. However, the relationship between BME, FM, and bone metabolism abnormalities in the development of AS is still unclear. The modified Dixon quantification (mDixon-Quant) sequence, designed by Philips Healthcare, is widely employed for assessing alterations in bone marrow microenvironment[4,5]. This study was to utilize fat fraction (FF) and T2* based on mDixon-Quant techniques to quantify changes and correlations in the bone marrow microenvironment of the lumbar and sacroiliac joints in AS.Methods
All patients who met the AS Assessment of the modified New York Criteria (n = 62; 44 male; mean age 27.82± 4.80 years; range 18 to 38 years) were enrolled as an AS group from January to September 2023. A normal control group (NC) recruited 39 healthy individuals (22 male; mean age 26.18±2.86 years; range 22 to 34 years). A 3.0T MRI system (Philips, Elition) with a 32-channel phased array body coil was used to perform the scanning protocols, which included conventional and mDixon-Quant sequences. All data were transferred to the workstation (IntlliSpace Portal Release 10.1). Two radiologists, who were blinded to the clinical information, independently outlined the ROIs and estimated the quantitative parameters of FF and T2* values. Variables were tested for normality of distribution using the Shapiro-Wilk test. Differences between groups were determined using one-way ANOVA and Tukey-Kramer’s test. For nonnormally distributed data, the Kruskal-Wallis test was used. post hoc analysis was used to evaluate differences between L1-5. Spearman’s test was used to determine the correlation between FF, T2*. The level of significance was set at p< 0.05.Results
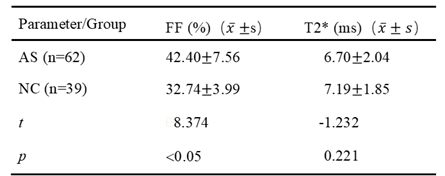
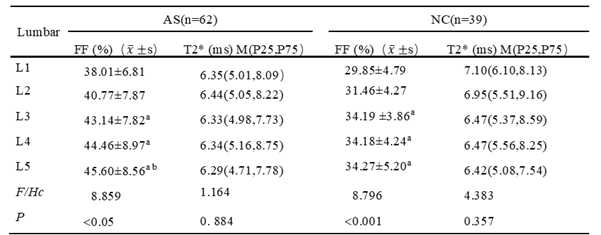
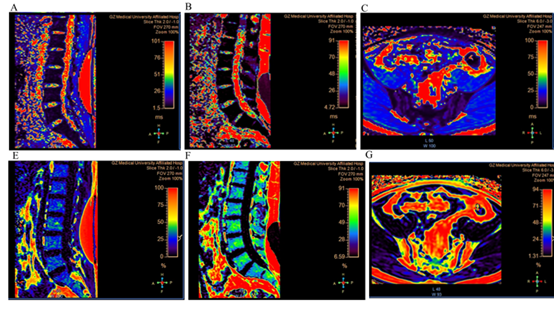
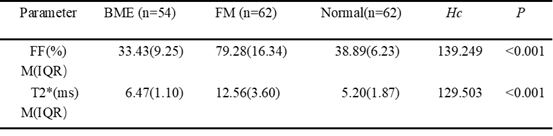
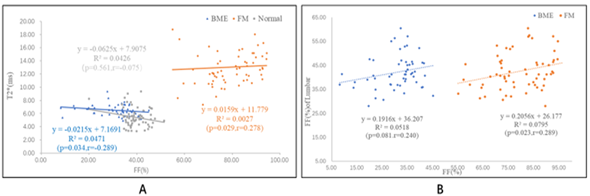
The FF value of lumbar in the AS group exhibited a significant increase compared to that of the NC group (t=8.374, p<0.05). However, there was no significant difference observed in the T2* value (Table 1; Figure 1). From L1 to L5, the FF value in the AS and NC groups differed significantly (p<0.05), but no notable distinction was found in the T2* value. Specifically, the FF value of L1 was lower than that of L3-L5, and the FF value of L2 was lower than that of L5 in the AS group (Table 2). Significant differences in FF and T2* were observed among the BME, FM, and normal bone marrow (p<0.001) in sacroiliac joints. The FF and T2* values in FM were significantly higher than those of BME lesions and normal bone marrow (Table 3). Spearman correlation analysis revealed an inverse correlation between FF and T2* for BME lesions (p=0.034, r=-0.289). There was a positive correlation between FF and T2* for FM lesions (p=0.029, r=0.278). Additionally, a positive correlation was found between FF of lumbar and FM lesion (p=0.023, r=0.289), but was not correlated with the FF value of BME in sacroiliac joints (Figures 2).Discussion
We present a noninvasive quantitative approach, mDixon-Quant, to assess changes in bone marrow microenvironment in AS patients. According to the study, AS patients’ lumbar bone marrow had a much higher FF value than that of healthy individuals. Previous studies have shown that during the progression of AS, cytokines such as Necrosis Factor-α (TNF-α), Interleukin (IL-1), IL-23, and IL-17 induce alterations in the bone marrow microenvironment. This leads to increased conversion of mesenchymal stem cells into adipocytes and osteoclasts. Ultimately, this results in increased fat deposition within the bone marrow and further development of osteopenia [6,7]. The FF and T2* values were significantly higher in FM regions compared to both BME lesions and normal bone marrow, accurately reflecting changes in bone marrow in these regions. Additionally, we observed a negative correlation between FF and T2* values in BME region, and a positive correlation between FF and T2* in FM region. These findings align with previous literature reports[8].As the disease progresses, there is a gradual increase in fat content within BME areas, indicating an accumulation of fat within the bone marrow microenvironment associated with AS[9]. Furthermore, we found a positive correlation between the FF value of lumbar and that of FM lesions in sacroiliac joints.Conclusion
The mDixon-Quant technique enables a noninvasive and accurate evaluation of changes in bone marrow microstructure in AS, and allows for quantitative analysis of abnormalities in AS bone metabolism.Acknowledgements
we are grateful to the participants for their cooperatoin and patienceReferences
[1] Song Z-Y, Yuan D, Zhang S-X. Role of the microbiome and its metabolites in ankylosing spondylitis[J]. Frontiers In Immunology, 2022, 13: 1010572. doi: 10.3389/fimmu.2022.1010572
[2] Poddubnyy D, Diekhoff T, Baraliakos X, et al. Diagnostic evaluation of the sacroiliac joints for axial spondyloarthritis: should MRI replace radiography?[J]. Annals of the Rheumatic Diseases, 2022, 81(11): 1486-1490. doi: 10.1136/ard-2022-222986
[3] Zhang Y, Guo Z, Wang L, et al. Baseline Severity of Sacroiliitis and Extensive Fat Metaplasia Predicts the Progression of Backfill at the Sacroiliac Joint in Patients With Axial Spondyloarthritis[J]. Frontiers In Immunology, 2022, 13: 887470. doi: 10.3389/fimmu.2022.887470
[4] Tang R, Tang G, Hua T, et al. mDIXON-Quant technique diagnostic accuracy for assessing bone mineral density in male adult population[J]. BMC Musculoskeletal Disorders, 2023, 24(1): 125. doi: 10.1186/s12891-023-06225-z
[5] Ahn GY, Koo BS, Joo KB, et al. Use of Quantitative Vertebral Bone Marrow Fat Fraction to Assess Disease Activity and Chronicity in Patients with Ankylosing Spondylitis[J]. Korean Journal of Radiology, 2021, 22(10): 1671-1679. doi: 10.3348/kjr.2020.0953
[6] Lee H-I, Kim H-J, Jo S, et al. IL-6 activates pathologic Th17 cell via STAT 3 phosphorylation in inflammatory joint of Ankylosing Spondylitis[J]. Biochemical and Biophysical Research Communications, 2022, 620: 69-75. doi: 10.1016/j.bbrc.2022.06.081
[7] Place DE, Malireddi RKS, Kim J, et al. Osteoclast fusion and bone loss are restricted by interferon inducible guanylate binding proteins[J]. Nature Communications, 2021, 12(1): 496. doi: 10.1038/s41467-020-20807-8
[8] Ma L-P, Sheng C-Y, Qian L, et al. Chemical Shift-Encoded MRI of Bone Metabolic Markers in Ankylosing Spondylitis[J]. Disease Markers, 2022, 2022: 1846667. doi: 10.1155/2022/1846667
[9] Liu D, Lin C, Liu B, et al. Quantification of Fat Metaplasia in the Sacroiliac Joints of Patients With Axial Spondyloarthritis by Chemical Shift-Encoded MRI: A Diagnostic Trial[J]. Frontiers In Immunology, 2021, 12: 811672. doi: 10.3389/fimmu.2021.811672
Figures