1511
Quantification of Myocardial Blood Flow using Radial Simultaneous Multi-Slice Perfusion MRI1Department of Radiology, Northwestern University Feinberg School of Medicine, Chicago, IL, United States, 2Ming Hsieh Department of Electrical and Computer Engineering, University of Southern California, Los Angeles, CA, United States, 3Utah Center for Advanced Imaging Research (UCAIR), Department of Radiology and Imaging Sciences, University of Utah, Salt Lake City, UT, United States, 4Department of Biomedical Engineering, University of Utah, Salt Lake City, UT, United States, 5Department of Radiology and Imaging Sciences, National Institutes of Health, Bethesda, MD, United States, 6Division of Cardiology, Internal Medicine, Northwestern University Feinberg School of Medicine, Chicago, IL, United States, 7Department of Biomedical Engineering, Northwestern University, Evanston, IL, United States
Synopsis
Keywords: Myocardium, Perfusion, Simultaneous multi-slice, myocardial blood flow
Motivation: While simultaneous multi-slice (SMS) excitation has been proposed to increase the myocardial coverage for cardiac perfusion MRI, its influence on the quantification of myocardial blood flow (MBF) has not been evaluated.
Goal(s): To determine whether SMS with multiband factor of two preserves accuracy in the quantification of MBF compared with the corresponding perfusion MRI with single-slice excitation.
Approach: We prospectively enrolled six patients and performed standard and SMS perfusion MRI back-to-back and calculated the arterial input function (AIF) and resting MBF.
Results: Both the AIF and MBF values calculated from the datasets acquired with the two perfusion sequences were comparable.
Impact: This study demonstrates feasibility of utilizing a 2D simultaneous multi-slice (SMS) (multiband factor = 2) perfusion sequence to increase the myocardial coverage and quantify the myocardial blood flow to help coronary artery disease diagnosis.
Introduction
First-pass cardiac perfusion MRI is a clinically indicated test for diagnosing coronary artery disease (CAD). In patients with indeterminant coronary lesions, multi-vessel disease, and microvascular disease, myocardial blood flow (MBF) quantification may increase the diagnostic accuracy1 and also adds prognostic value2, 3. A limitation of cardiac perfusion MRI is the limited myocardial coverage (e.g., 3 short-axis slices per heartbeat), which leaves little room to overcome potential image artifacts such as the dark rim. One approach to increase myocardial coverage is combining several acceleration techniques such as simultaneous multi-slice (SMS) excitation, parallel imaging, compressed sensing, and radial sampling, as previously described 4, 5, including two studies which evaluated MBF quantification using SMS5, 6, with one comparing two SMS sequences (0.58±0.07 vs 0.61±0.16 ml/g/min) and the other comparing an SMS to a 3D sequence (0.69±0.16 vs 0.69±0.15 ml/g/min). The purpose of this study was to additionally incorporate self-calibration of arterial input function (AIF)7 and self-correction for T2* effects on AIF8 and evaluate the resulting SMS pulse sequence (multiband factor = 2) against standard 2D radial pulse sequence in patients back to back.Methods
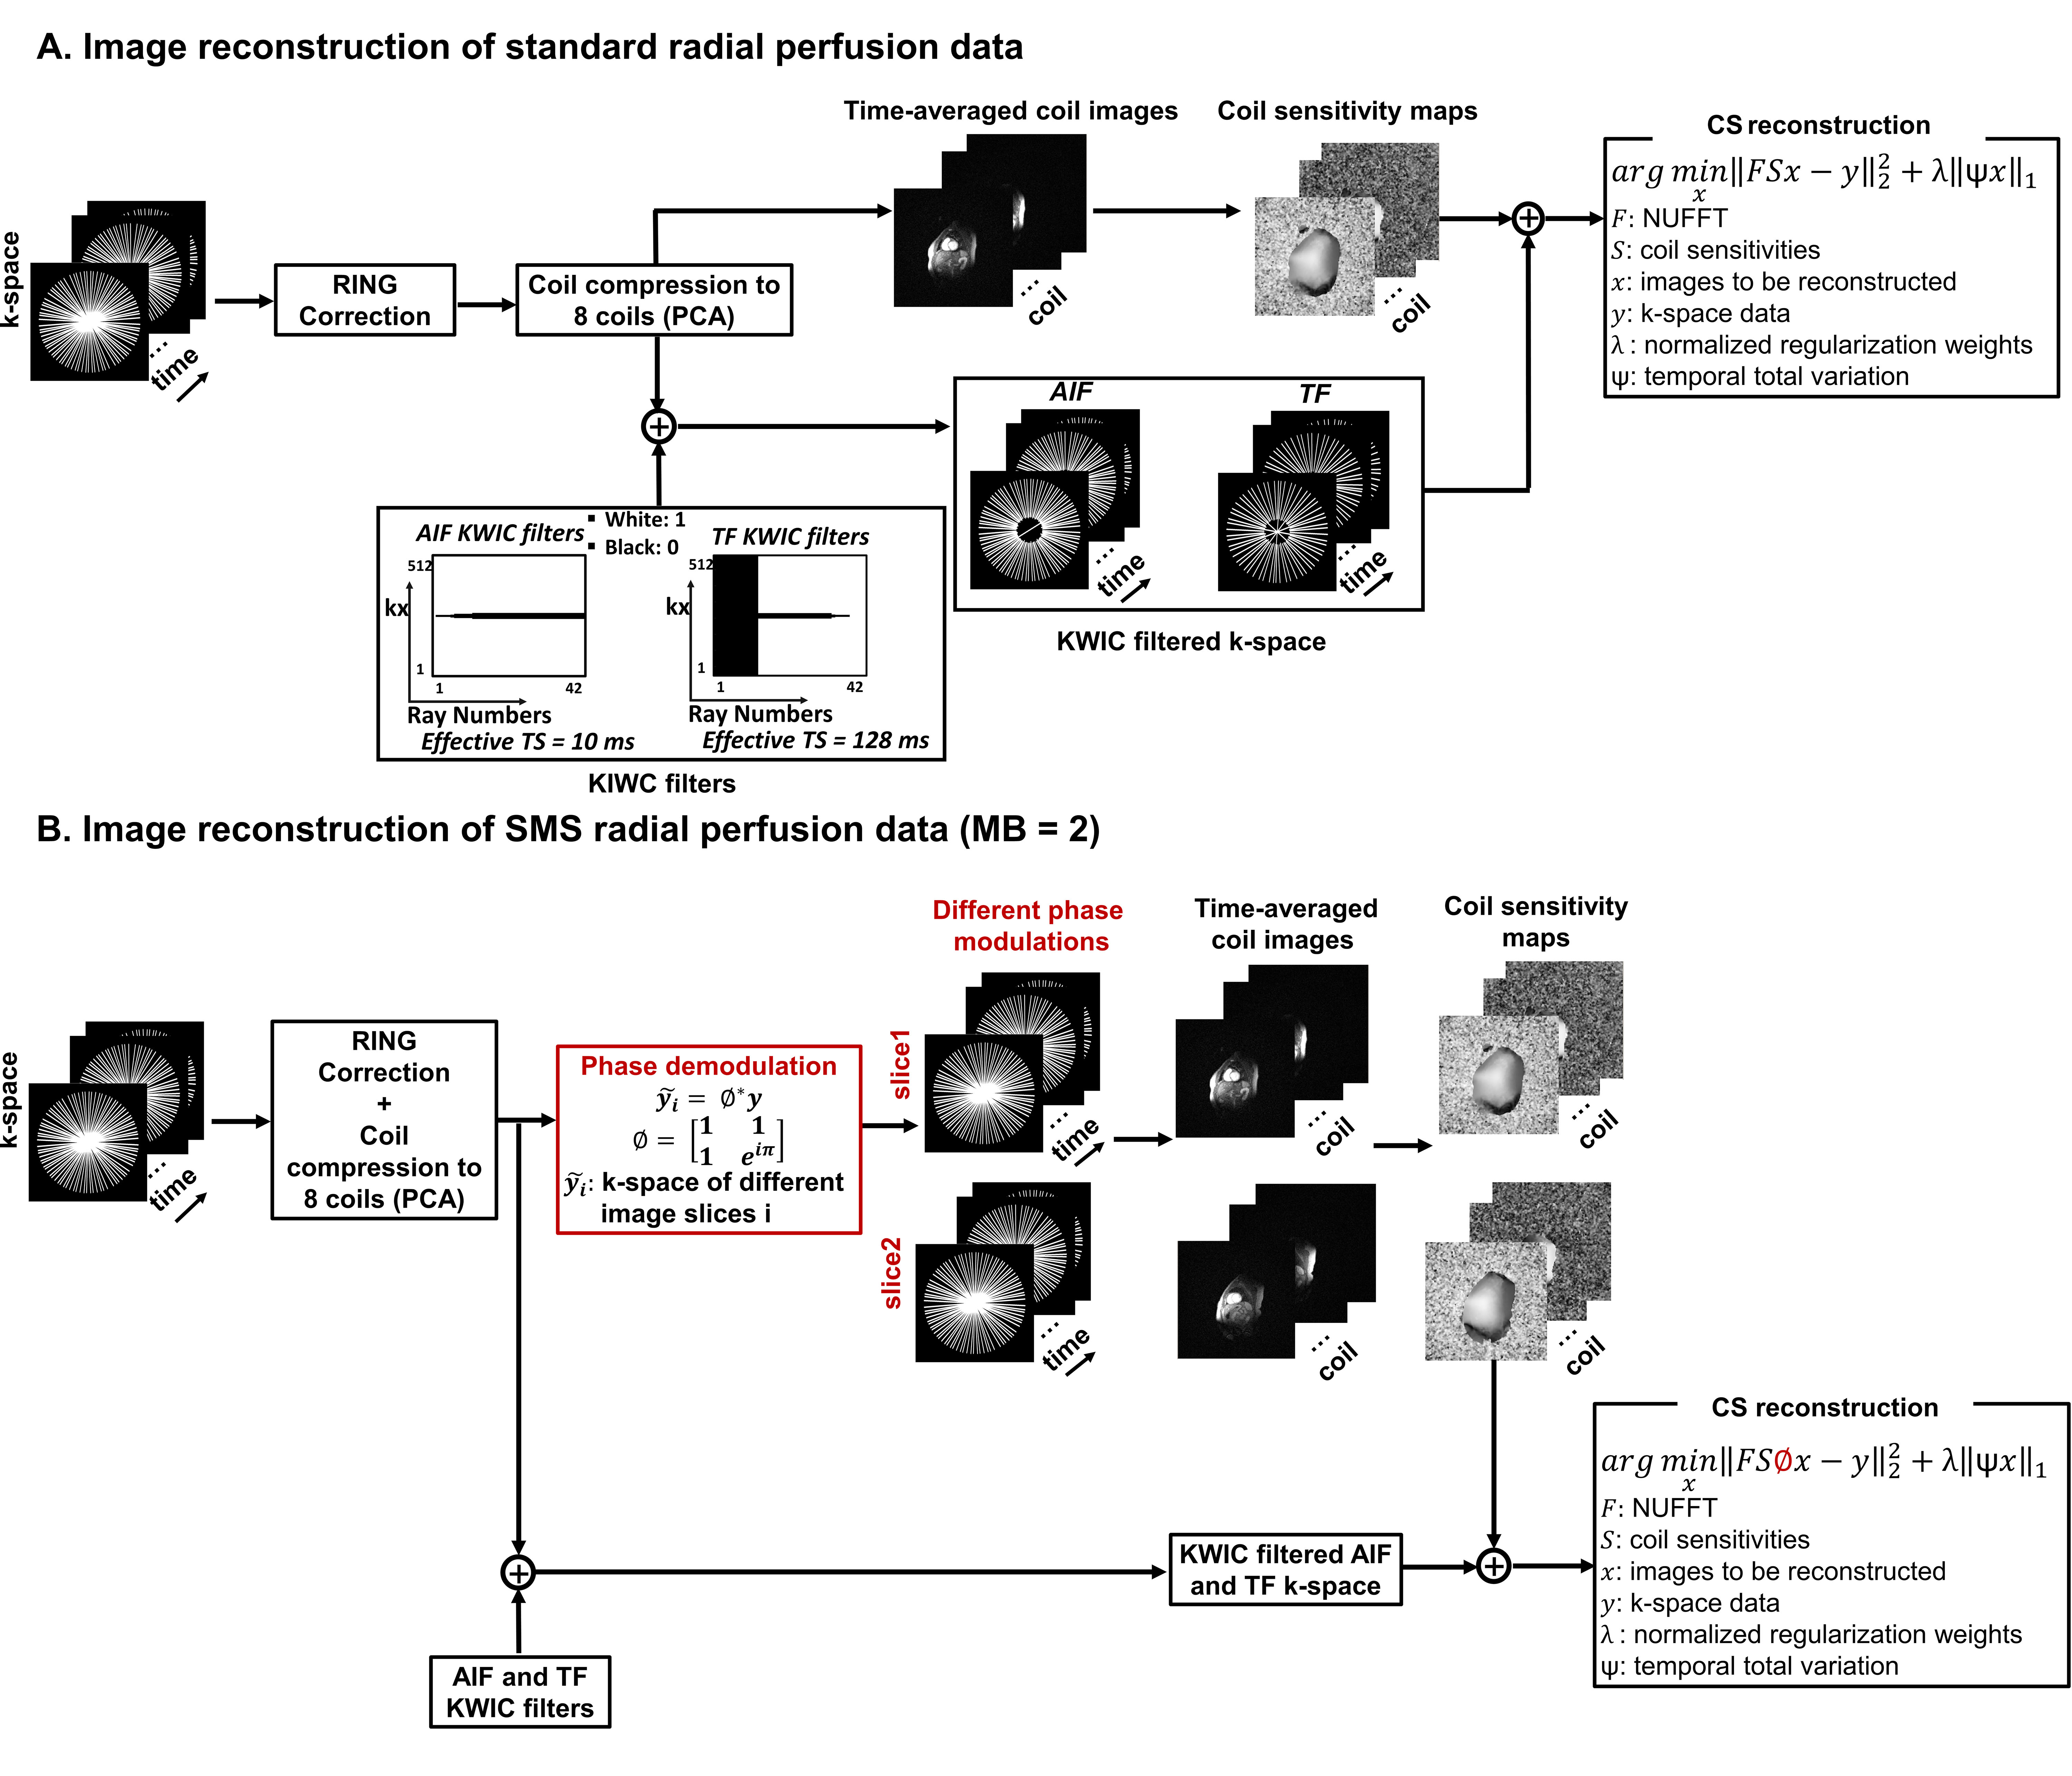
Human Subjects & Pulse Sequence: We prospectively enrolled 6 subjects (58±7 years, 3 males) and performed standard radial perfusion and SMS sequences back-to-back in this order (~5 min gap) with administration of 0.1 mmol/kg of gadobutrol at 3 mL/s via a power injector per scan. MRI was performed on a 1.5T whole-body MRI scanner (MAGNETOM Aera, Siemens Healthineers, Erlangen, Germany). Both perfusion sequences had matching image parameters, except the SMS factor, including: FOV=384x384 mm2, acquisition matrix=256x256, spatial resolution=1.5x1.5 mm2, slice thickness=8 mm, TE/TR=1.5/3.03 ms, flip angle=15°, minimum TS=10 ms, B1-insensitive hybrid pulse train as the saturation pulse9, electrocardiogram triggering every heartbeat, receiver bandwidth=750 Hz/pixel, 42 rays per frame (corresponding to an acceleration factor of 6.1), 5th Fibonacci sequence of golden angles (=32.0397°)10, single-shot readout duration=128 ms, 100 repetitions. Each patient was instructed to breathe normally during scanning. Depending on the heart rate, 3-4 slices for standard and 6-8 slices for SMS were acquired per heartbeat, respectively.Image reconstruction and quantification: The undersampled data were reconstructed using a similar compressed sensing (CS) framework11, except for the phase demodulation and modulation in the SMS reconstruction pipeline4 (Figure 1). We applied k-space image weighted contrast (KWIC) filters as a pre-processing step prior to CS12 reconstruction of AIF and tissue function (TF) images from the same raw k-space data11. Temporal total variation (TTV) was used as the sparsifying transforms. Normalized regularization weight for TTV was optimized for standard (0.01) and SMS (0.015) perfusion data, respectively. Pixel-wise resting MBF maps were quantified using the following steps: motion correction13, signal normalization by the proton density weighted image, signal to T1 conversion based on the Bloch equation14, T1 to gadolinium concentration ([Gd]) conversion assuming fast water exchange15, T2* correction to the AIF8, [Gd] to MBF conversion based on a Fermi model16. For efficiency, we limited the resting MBF analyses to three short axis planes (base, mid, apex) and then divided them into 16 AHA segments.
Statistical analysis: We tested for normality of the peak AIF and mean MBF from 16 AHA segments using the Shapiro-Wilk test and compared them between the standard and SMS groups using the two-tailed, paired t-test (Wilcoxon signed-rank, if not normally distributed). The Bland-Altman analysis were conducted to determine the levels of agreement in peak AIF and mean MBF. A p < 0.05 was considered statistically significant.
Results
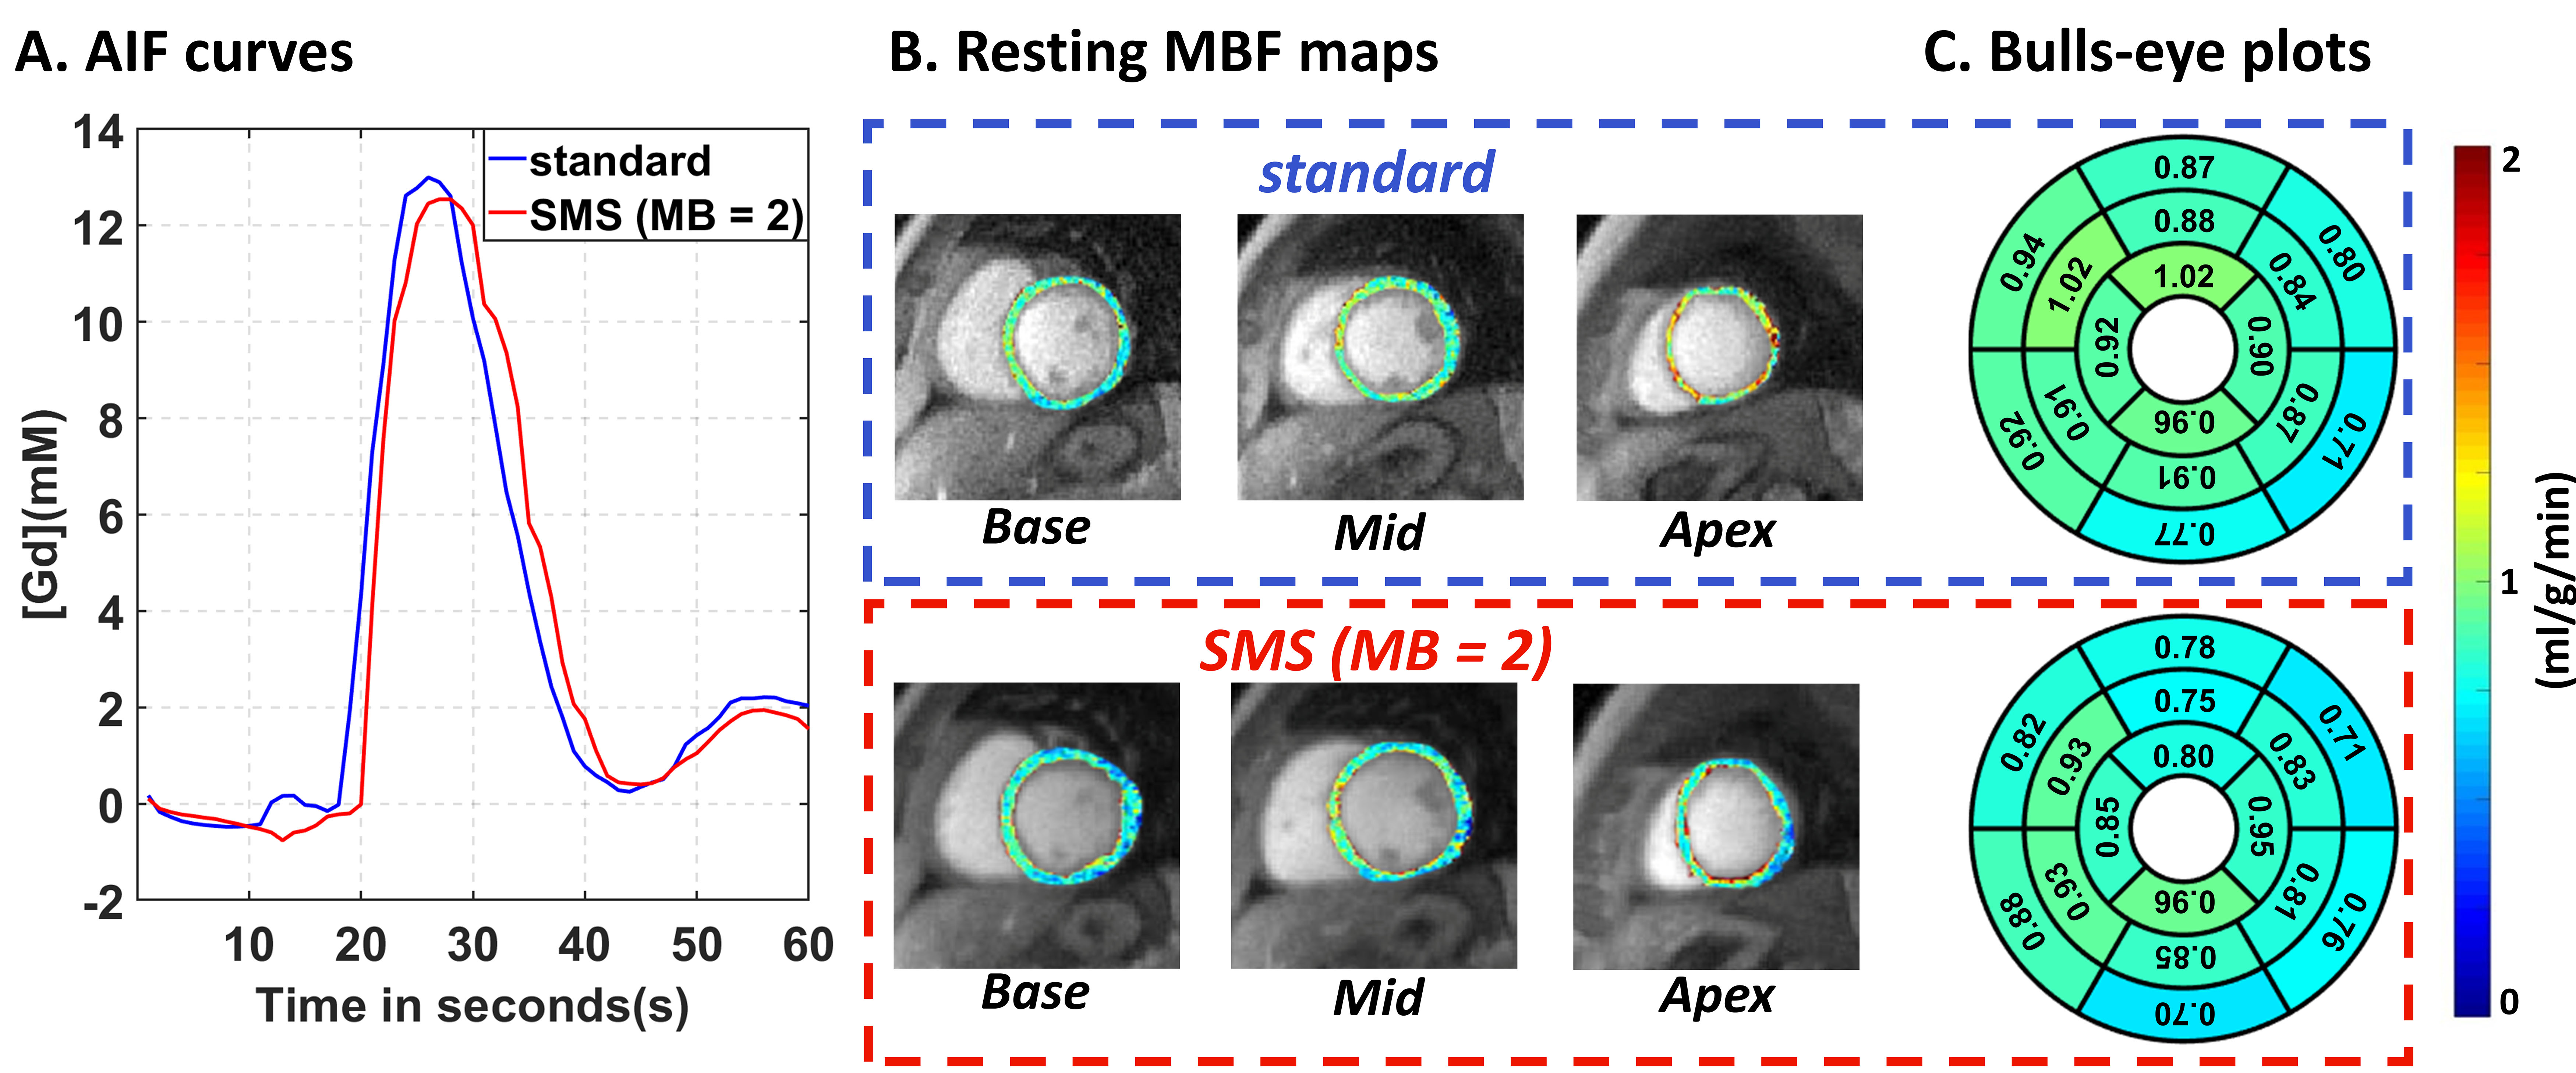
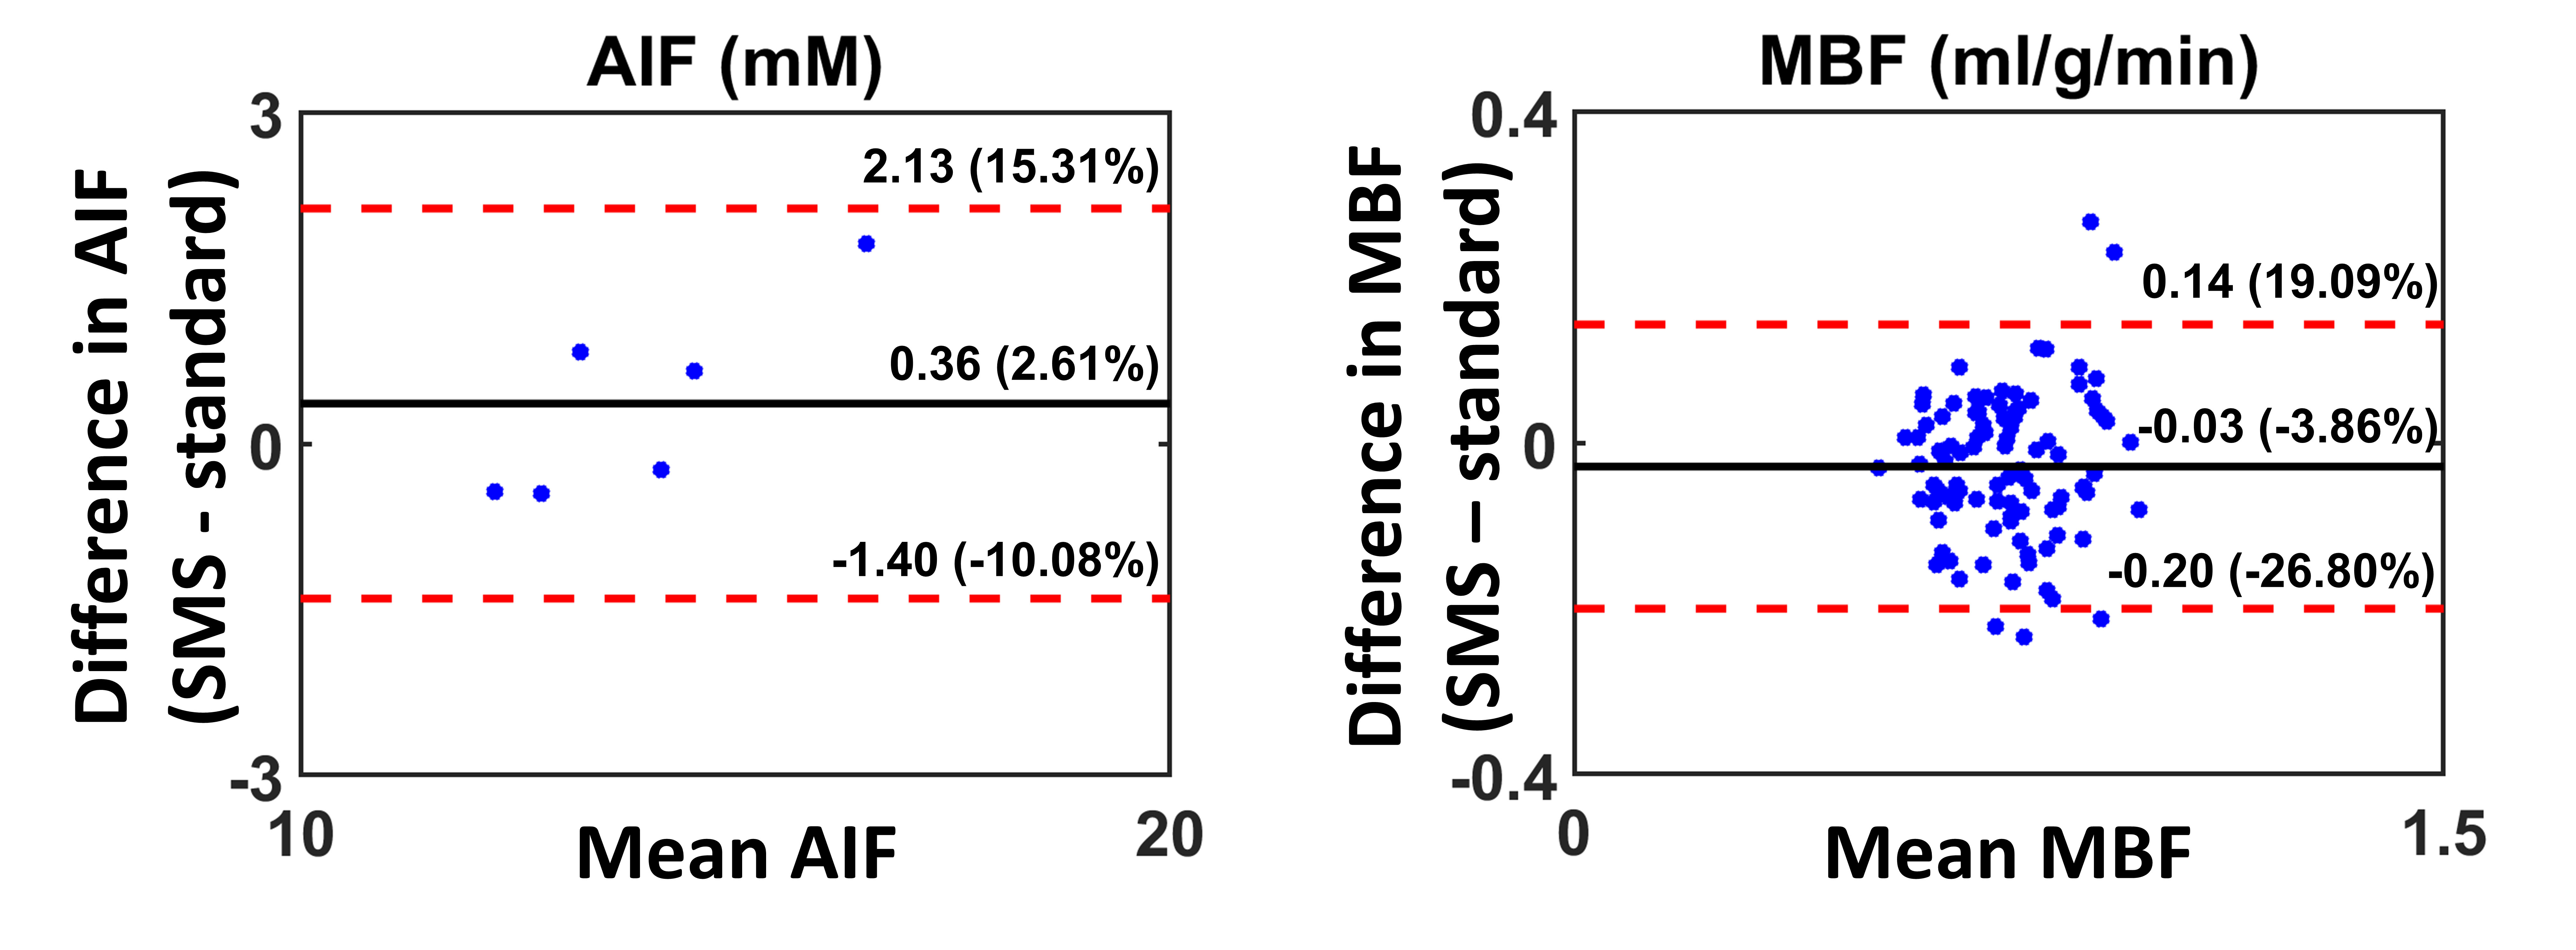
The SMS perfusion sequence with multiband factor of two enabled twice as many slices to be obtained compared to the standard sequence (SMS: 6-8 slices vs standard: 3-4 slices). Figure 2 showed the AIF curves, resting MBF maps, and the corresponding bulls-eye plots representing the mean MBF in 16 AHA segments of one representative patient. There was no significant difference (p=0.37) in the peak AIF (standard: 13.72±1.19 vs SMS: 14.08±1.92 mM). While there was a significant difference (*p=0.001) in mean MBF (standard: 0.76±0.11 vs SMS: 0.73 ± 0.11 ml/g/min), the difference was only 4% of the mean (i.e., within the noise level). According to the Bland-Altman analysis (Figure 3), mean difference in AIF was 0.36 mM (2.61%) and in MBF was - 0.03 ml/g/min (-3.86%).Conclusion
The SMS radial sequence with multiband factor of two is able to increase the myocardial coverage while maintaining accurate MBF quantification compared with the standard radial perfusion sequence. A future study including a larger cohort of patients and including adenosine is warranted to more thoroughly evaluate the accuracy of MBF quantification derived from SMS data.Acknowledgements
This work is supported by the National Institutes of Health (R01HL116895, 1R01HL167148‐01A1, R01HL151079, R21EB030806A1), the Radiological Society of North America (EILTC2302), and the American Heart Association (19IPLOI34760317, 949899, 903375).References
1. Mordini FE, Haddad T, Hsu LY, Kellman P, Lowrey TB, Aletras AH, Bandettini WP and Arai AE. Diagnostic accuracy of stress perfusion CMR in comparison with quantitative coronary angiography: fully quantitative, semiquantitative, and qualitative assessment. JACC Cardiovasc Imaging. 2014;7:14-22.
2. Brown LAE, Onciul SC, Broadbent DA, Johnson K, Fent GJ, Foley JRJ, Garg P, Chew PG, Knott K, Dall'Armellina E, Swoboda PP, Xue H, Greenwood JP, Moon JC, Kellman P and Plein S. Fully automated, inline quantification of myocardial blood flow with cardiovascular magnetic resonance: repeatability of measurements in healthy subjects. J Cardiovasc Magn Reson. 2018;20:48.
3. Knott KD, Seraphim A, Augusto JB, Xue H, Chacko L, Aung N, Petersen SE, Cooper JA, Manisty C, Bhuva AN, Kotecha T, Bourantas CV, Davies RH, Brown LAE, Plein S, Fontana M, Kellman P and Moon JC. The Prognostic Significance of Quantitative Myocardial Perfusion: An Artificial Intelligence-Based Approach Using Perfusion Mapping. Circulation. 2020;141:1282-1291.
4. Tian Y, Mendes J, Pedgaonkar A, Ibrahim M, Jensen L, Schroeder JD, Wilson B, DiBella EVR and Adluru G. Feasibility of multiple-view myocardial perfusion MRI using radial simultaneous multi-slice acquisitions. PLoS One. 2019;14:e0211738.
5. Tian Y, Mendes J, Wilson B, Ross A, Ranjan R, DiBella E and Adluru G. Whole-heart, ungated, free-breathing, cardiac-phase-resolved myocardial perfusion MRI by using Continuous Radial Interleaved simultaneous Multi-slice acquisitions at sPoiled steady-state (CRIMP). Magn Reson Med. 2020;84:3071-3087.
6. Huang Q, Tian Y, Mendes J, Ranjan R, Adluru G and DiBella E. Quantitative myocardial perfusion with a hybrid 2D simultaneous multi-slice sequence. Magn Reson Imaging. 2023;98:7-16.
7. Naresh NK, Haji-Valizadeh H, Aouad PJ, Barrett MJ, Chow K, Ragin AB, Collins JD, Carr JC, Lee DC and Kim D. Accelerated, first-pass cardiac perfusion pulse sequence with radial k-space sampling, compressed sensing, and k-space weighted image contrast reconstruction tailored for visual analysis and quantification of myocardial blood flow. Magn Reson Med. 2019;81:2632-2643.
8. Fan L, Allen BD, Culver AE, Hsu LY, Hong K, Benefield BC, Carr JC, Lee DC and Kim D. A theoretical framework for retrospective T 2 * correction to the arterial input function in quantitative myocardial perfusion MRI. Magn Reson Med. 2021;86:1137-1144.
9. Kim D, Oesingmann N and McGorty K. Hybrid adiabatic-rectangular pulse train for effective saturation of magnetization within the whole heart at 3 T. Magn Reson Med. 2009;62:1368-78.
10. Wundrak S, Paul J, Ulrici J, Hell E, Geibel MA, Bernhardt P, Rottbauer W and Rasche V. Golden ratio sparse MRI using tiny golden angles. Magnetic resonance in medicine : official journal of the Society of Magnetic Resonance in Medicine / Society of Magnetic Resonance in Medicine. 2016;75:2372-8.
11. Fan L, Hong K, Hsu LY, Carr JC, Allen BD, Lee DC and Kim D. Optimal saturation recovery time for minimizing the underestimation of arterial input function in quantitative cardiac perfusion MRI. Magn Reson Med. 2022;88:832-839.
12. Lustig M, Donoho D and Pauly JM. Sparse MRI: The application of compressed sensing for rapid MR imaging. Magn Reson Med. 2007;58:1182-95.
13. Benovoy M, Jacobs M, Cheriet F, Dahdah N, Arai AE and Hsu LY. Robust universal nonrigid motion correction framework for first-pass cardiac MR perfusion imaging. J Magn Reson Imaging. 2017;46:1060-1072.
14. Mendes JK, Adluru G, Likhite D, Fair MJ, Gatehouse PD, Tian Y, Pedgaonkar A, Wilson B and DiBella EVR. Quantitative 3D myocardial perfusion with an efficient arterial input function. Magn Reson Med. 2020;83:1949-1963.
15. Donahue KM, Weisskoff RM and Burstein D. Water diffusion and exchange as they influence contrast enhancement. J Magn Reson Imaging. 1997;7:102-10.
16. Jerosch-Herold M, Wilke N and Stillman AE. Magnetic resonance quantification of the myocardial perfusion reserve with a Fermi function model for constrained deconvolution. Medical physics. 1998;25:73-84.
Figures