1510
Myocardial perfusion measurements with a deep learning-assisted cardiac arterial spin labeling (DeepCASL): towards validation by microsphere1Radiology, Washington University in Saint Louis, Saint Louis, MO, United States
Synopsis
Keywords: Myocardium, Myocardium, noncontrast, perfusion, deep learning
Motivation: Cardiac arterial spin labeling (ASL) method is sensitive to noise (system and physiology), which may lead to inaccurate MBF measurement.
Goal(s): A cardiac MRI arterial spin labeling method was developed with assistance of a deep learning networks (DeepCASL) to improve image quality and measurement accuracy.
Approach: The performance of the DeepCASL method was evaluated in a canine model of coronary arterial disease by comparing and correlating with MBF determined by microsphere measurements.
Results: The validation study revealed moderate to strong correlations in absolute myocardial blood flow values between MRI and microsphere reference methods.
Impact: This new DeepCASL technique opens a door for clinical applications of noncontrast cardiac perfusion as a screen tool for reliable diagnosis of perfusion deficit in a variety of cardiomyopathy disorders.
Introduction
Cardiac arterial spin labeling (ASL) method is the only approach in MRI to measure myocardial blood flow (MBF) in vivo, without using any MRI contrast media. However, the ASL method is sensitive to noise (system and physiology), which may lead to inaccurate MBF measurement, particularly in a low field (≤ 1.5T). In this study, we demonstrated a new deep learning-assisted cardiac ASL approach (DeepCASL) to quantify MBF. The performance of this approach was evaluated in a canine model of coronary arterial disease by comparing and correlating with MBF determined by microsphere measurements.Methods
Canine model: All animal protocols were approved by the Animal Studies Committee at local institute. 18 mongrel dogs (weight = 25.5 ± 3.6 kg) were used in two groups: healthy (n = 9) and coronary stenosis (n = 9). The later was introduced in left anterior descending coronary artery (LAD) using an open-chest model with an MRI-compatible coronary artery clamp [1]. Three types of stenosis were created: 50% (n= 3), 70% (n = 3), 90% (n = 3). Each dog received pharmaceutically induced hyperemia, by the infusion of either dipyridamole (DIP) (0.14 mg/min/kg for 4 minutes) or dobutamine (DOB) (average dose of 20 µg/min/kg) for creating a range of MBF values. Microsphere measurements were performed at rest and during the hyperemia.Imaging method: The DeepCASL MRI was performed on a 1.5-T clinical MR scanner (Siemens Healthineer, Erlanger, Germany) as a part of other imaging studies. A cardiac ASL sequence was employed to acquire ASL signals at the mid- section of the heart along short-axis direction, as reported previously [2]. The acquisition occurred at rest and during the pharmaceutically induced hyperemia (but not at the same time as microsphere infusion). Each acquisition lasted approximately 15 sec when the animal can be held breath-holding mechancally and the spatial resolution was 1.7 x 1.7 x 8 mm3.
To quantify MBF, a physics based deep learning network was developed using synthetical ASL signals and added different levels of white noise. A total of 2000 simulated data sets were created, in which 80% was used for training and 20% for testing. These data were fed to an UNet-based fully connected neural network that was comprised of an encoder, and decoder, and a set of dense layers. The final output was MBF maps.
In healthy dogs, a ring region-of-interest (ROI) was drawn on the MBF maps at the mid-section. In coronary stenosis dogs, each MBF map was divided in 4 segments (anterior – LAD perfused territory, septal, inferior, and lateral). A paired Students’ t test and Pearson’s correlation were used to compare MBF values between DeepCASL and microsphere methods.
Results
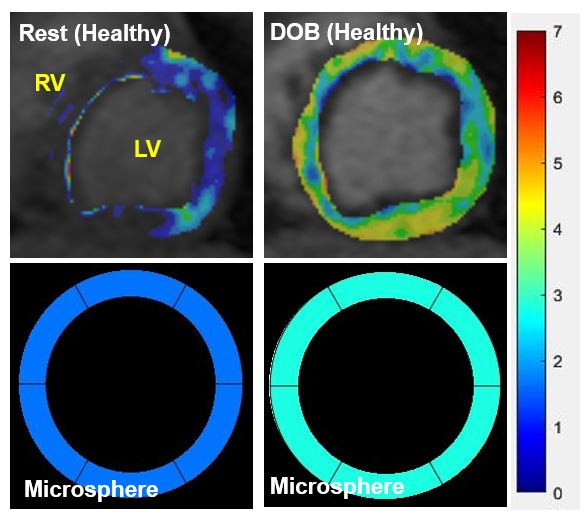
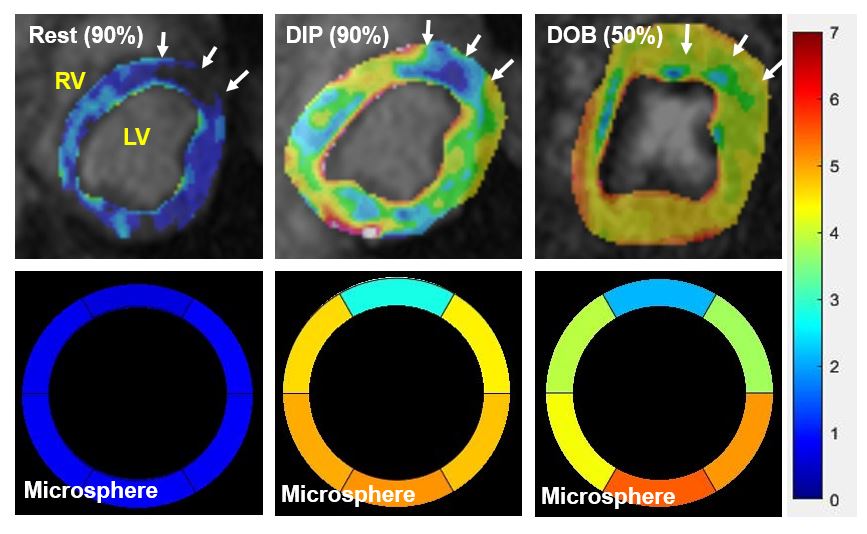
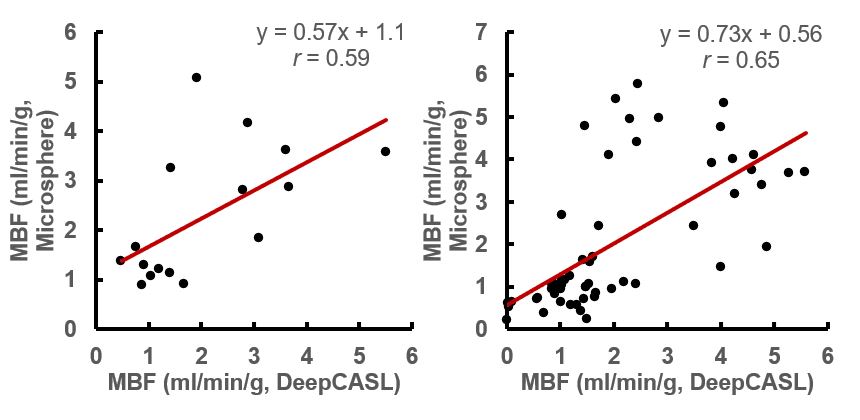
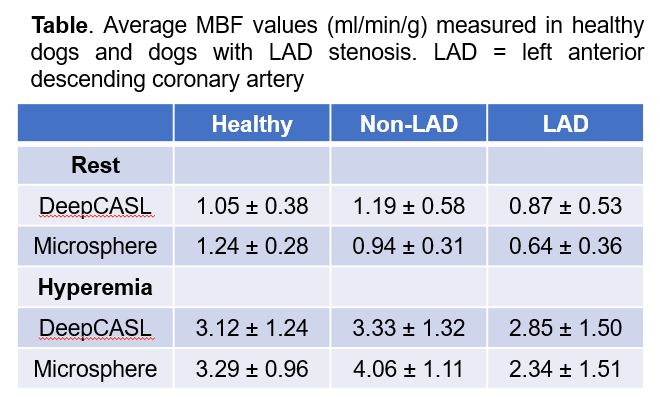
Figure 1 and Figure 2 show examples of MBF maps measured in healthy dogs and dogs with various coronary artery stenosis, respectively. There are moderate correlations (r = 0.59 – 0.65) in segmented MBF values between measurements by DeepCASL and microsphere methods, although there was a moderate variability in data (Figure 3). Interestingly, if this correlation was made separately in dogs with DIP and DOB, the correlation coefficient became much stronger, with r = 0.8 – 0.82. The paired t test did not reveal any significant difference between two measurements (Table).Conclusion
The novel DeepCASL demonstrates the capability for identifying regional difference in quantitative MBF, which is correlated with microsphere MBF values. Although over- or under-estimation was observed due to different timing between DeepCASL data acquisition and microsphere infusion during the hyperemia, our data still point to the potential for this technique to be a reliable and relatively accurate screen tool for noncontrast diagnosis of myocardial perfusion deficit.Acknowledgements
The research is supported in part by National Institutes of Health grant HL165238 and UL1TR002345, as well as American Heart Association grant 23SCISA1145192.References
1. McCommis KS, Goldstein TA, Abendschein DR, Herrero P, Misselwitz B, Gropler RJ, Zheng J. Quantification of regional myocardial oxygenation by magnetic resonance imaging: validation with positron emission tomography. Circ Cardiovasc Imaging. 2010;3:41-46.
2. Zhang H, Shea SM, Park V, Li D, Woodard PK, Gropler RJ, Zheng J. Accurate myocardial T1 measurements: toward quantification of myocardial blood flow with arterial spin labeling. Magn Reson Med. 2005;53:1135-1142.
Figures