1505
Quantitative, time-efficient viability CMR with delayed phase dynamic contrast-enhanced (dDCE) MRI1Department of Medical Imaging, National Cheng Kung University Hospital, Tainan, Taiwan, 2Biomedical Imaging Research Institute, Cedars-Sinai Medical Center, Los Angeles, CA, United States, 3Krannert Cardiovascular Research Center, Indiana University, Bloomington, IN, United States, 4Department of Bioengineering, University of California at Los Angeles, Los Angeles, CA, United States, 5Krannert Cardiovascular Research Center, Indiana University School of Medicine, Indianapolis, IN, United States, 6Department of Statistics, University of California at Los Angeles, Los Angeles, CA, United States, 7Smidt Heart Institute, Cedars-Sinai Medical Center, Los Angeles, CA, United States, 8Department of Radiological Sciences, David Geffen School of Medicine at UCLA, Los Angeles, CA, United States, 9Department of Internal Medicine, National Cheng Kung University Hospital, Tainan, Taiwan
Synopsis
Keywords: Heart Failure, Cardiomyopathy, dynamic contrast-enhanced magnetic resonance imaging (DCE-MRI)
Motivation: Late gadolinium enhancement (LGE) CMR‘s wider clinical adoption is hindered by its prolonged wait time and imaging protocol dependence.
Goal(s): Develop a delayed dynamic contrast enhancement (dDCE) model to shorten the LGE wait time and provide a quantitative characterization of the myocardium contrast washout process.
Approach: Dynamic T1 maps were acquired in the contrast washout period in dogs with myocardial infarctions. dDCE maps and synthesized LGE images were derived from data collected within 5-minute post-contrast injection.
Results: The 5-minute dDCE maps provide physiologically reasonable measurements and comparable myocardial viability assessment ability to standard LGE images.
Impact: The shortened LGE wait time from the quantitative dDCE maps may benefit patients unable to tolerate long CMR examination time and open new dimensions for quantitative myocardium viability assessment.
Introduction
Late gadolinium enhancement (LGE) cardiac magnetic resonance (CMR) provides differential diagnosis between ischemic and non-ischemic heart diseases with high accuracy1 and predicts adverse cardiac events in cardiomyopathy2,3. However, its wider clinical adoption is limited by prolonged contrast washout wait time, suboptimal blood pool to lesion contrast, and imaging protocol dependency. In this study, we aimed to develop a time-efficient viability imaging technique using a delayed dynamic contrast enhancement(dDCE) model, quantifying the contrast washout process in the myocardium with a shortened wait time.Method
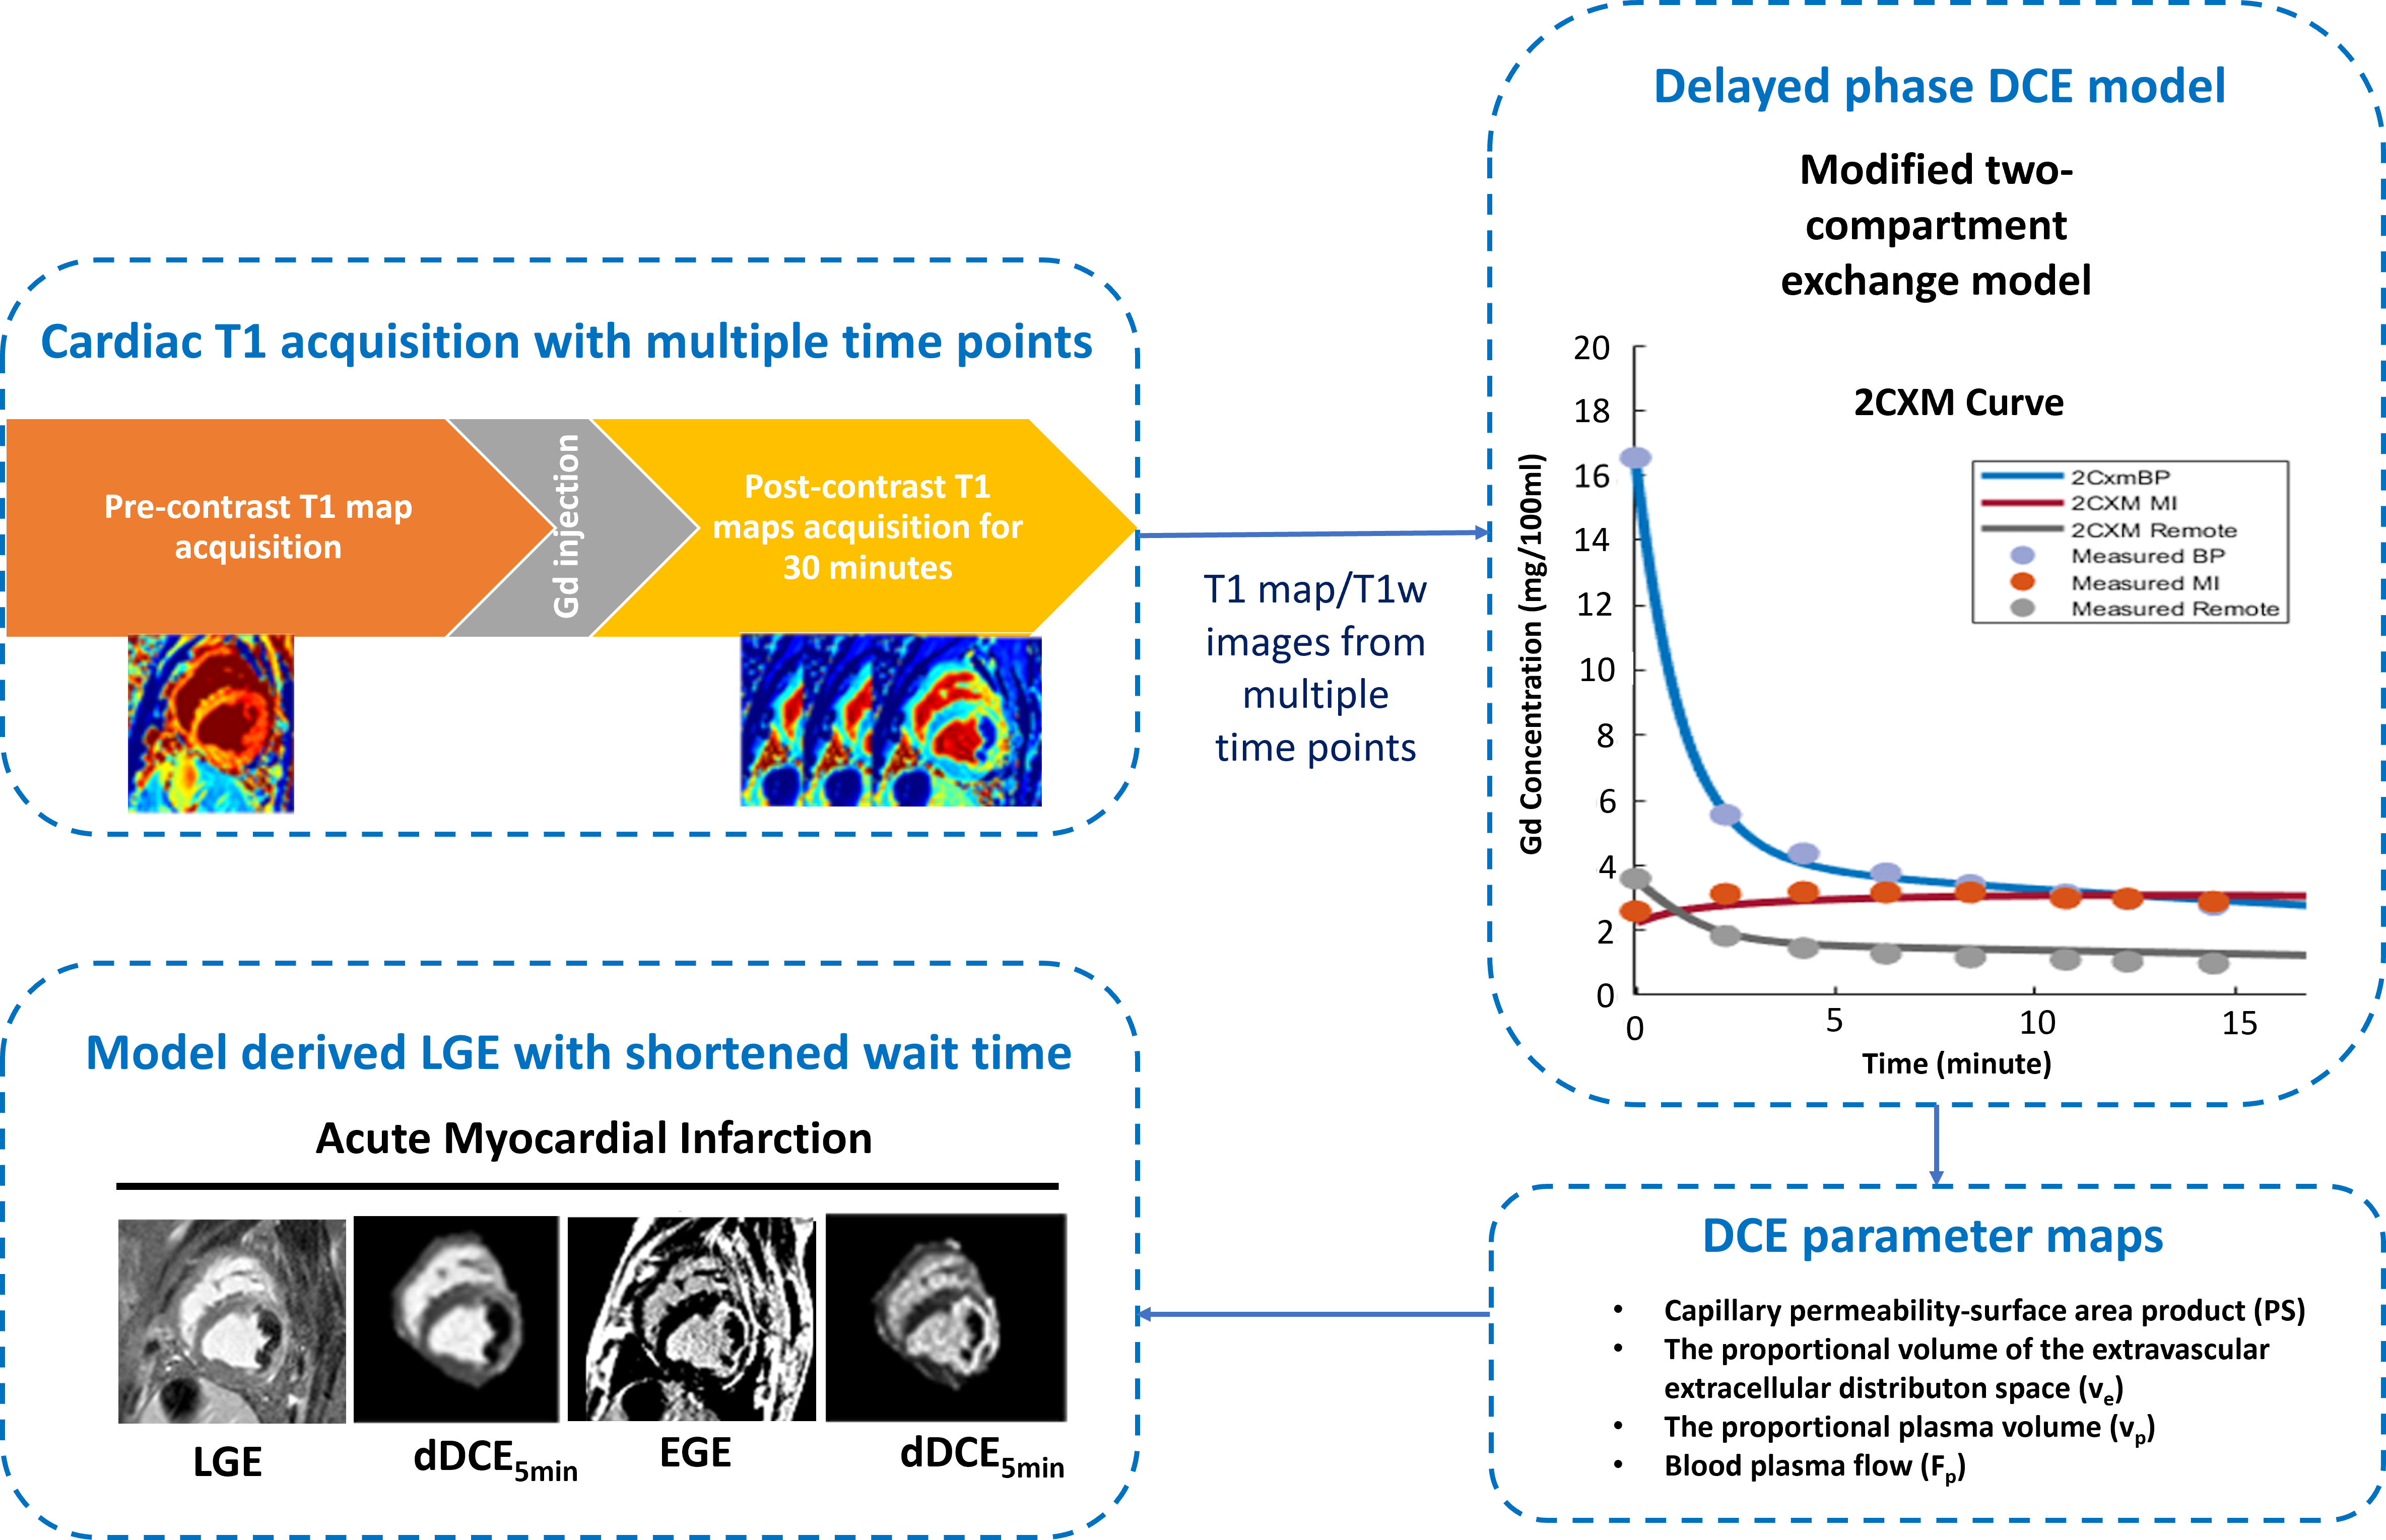
N = 10 dogs with acute myocardial infarction(AMI) were studied at 1 week after myocardial infarction under IACUC approval. Clinical T1 MOLLI maps of the heart were repeatedly acquired at 1-2 minute intervals after contrast injection for up to 30 minutes (8 inversion times [TI] with 2 Look-Locker cycles of 3 + 5 images, minimum TI = 120ms, TI increment = 80ms, flip angle = 35°, readout bandwidth = 1371 Hz/pixel, and voxel size in 1.5×1.5×8 mm). Standard LGE (LGEstandard) images with PSIR reconstruction (balanced SSFP readouts with TR/TE=3.42/1.47; inversion time to null viable myocardium; readout bandwidth= 586 Hz/pixel; Flip angle=20˚) were acquired 15 minutes after contrast administration. A modified two-compartment exchange model was fit to the dynamic T1 maps to model the contrast washout. Separate dDCE maps were reconstructed using the whole dataset (dDCE30min) and a subset of the T1 maps within 5 minutes post-contrast injection (dDCE5min). To test the dDCE model's ability to shorten the LGE wait time, LGEdDCE images were synthesized using the dDCE5min maps and compared to the LGEstandard images. The pipeline used for this study is illustrated in Figure 1.Results
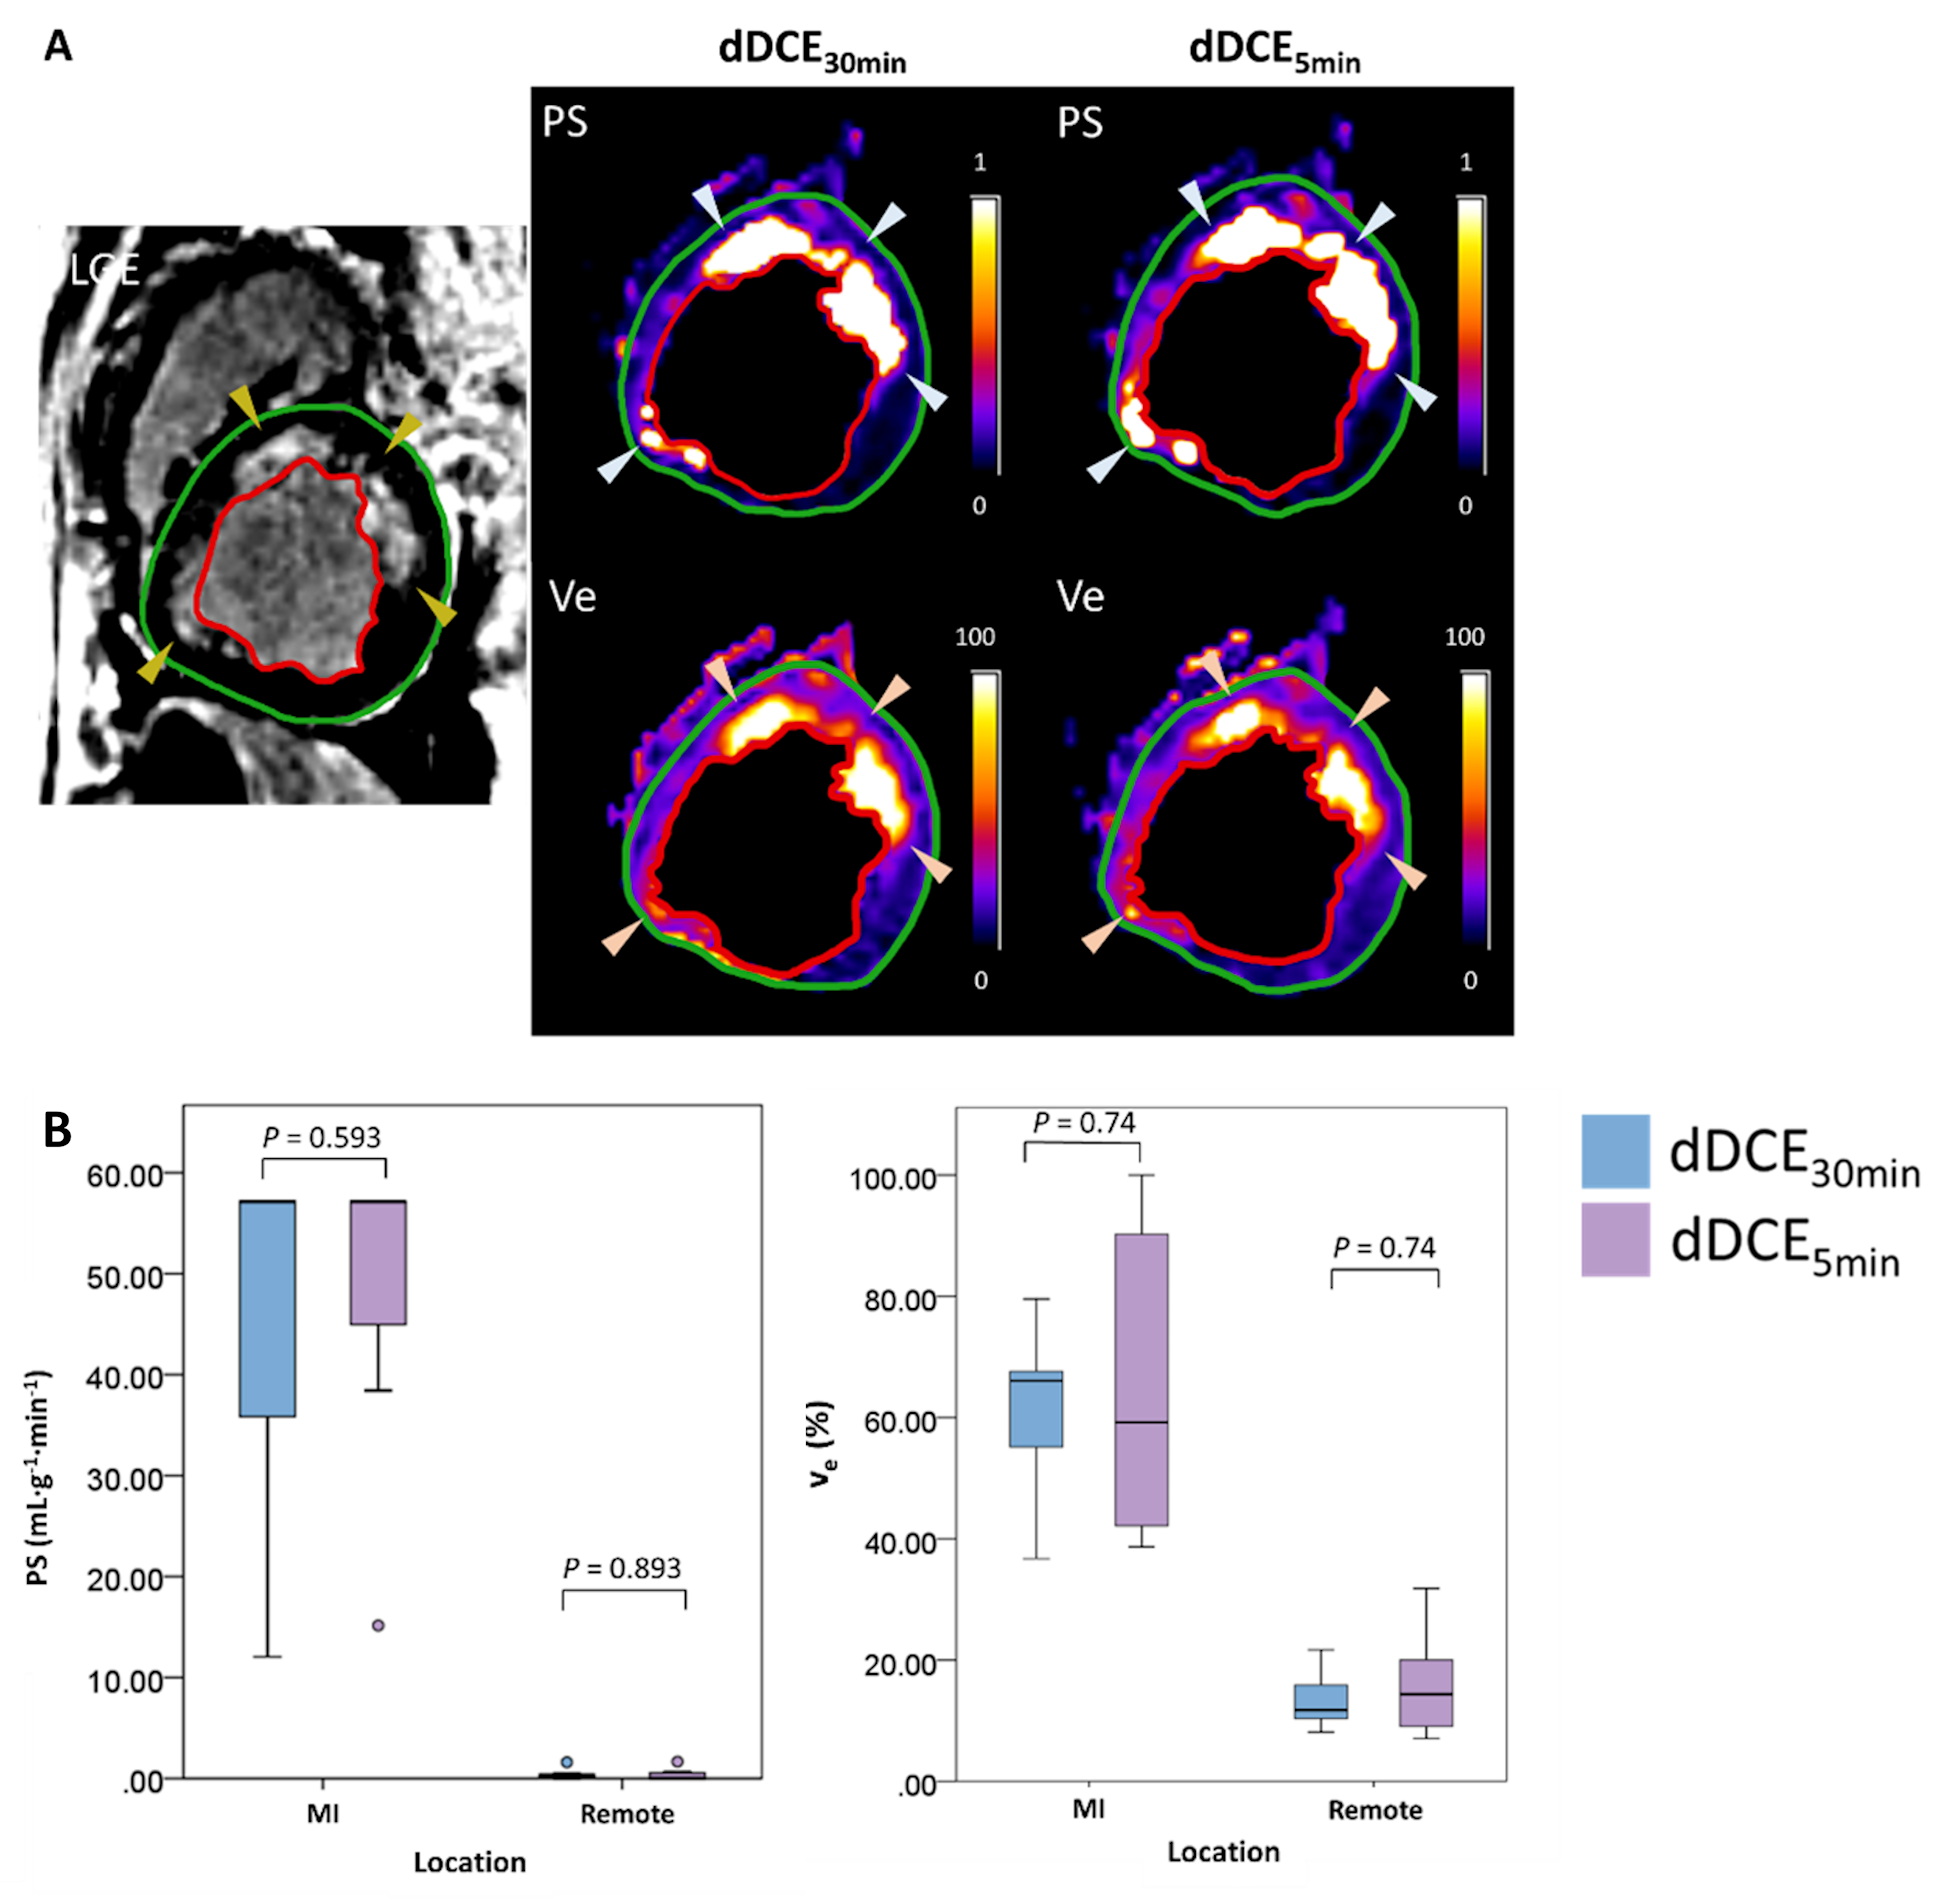
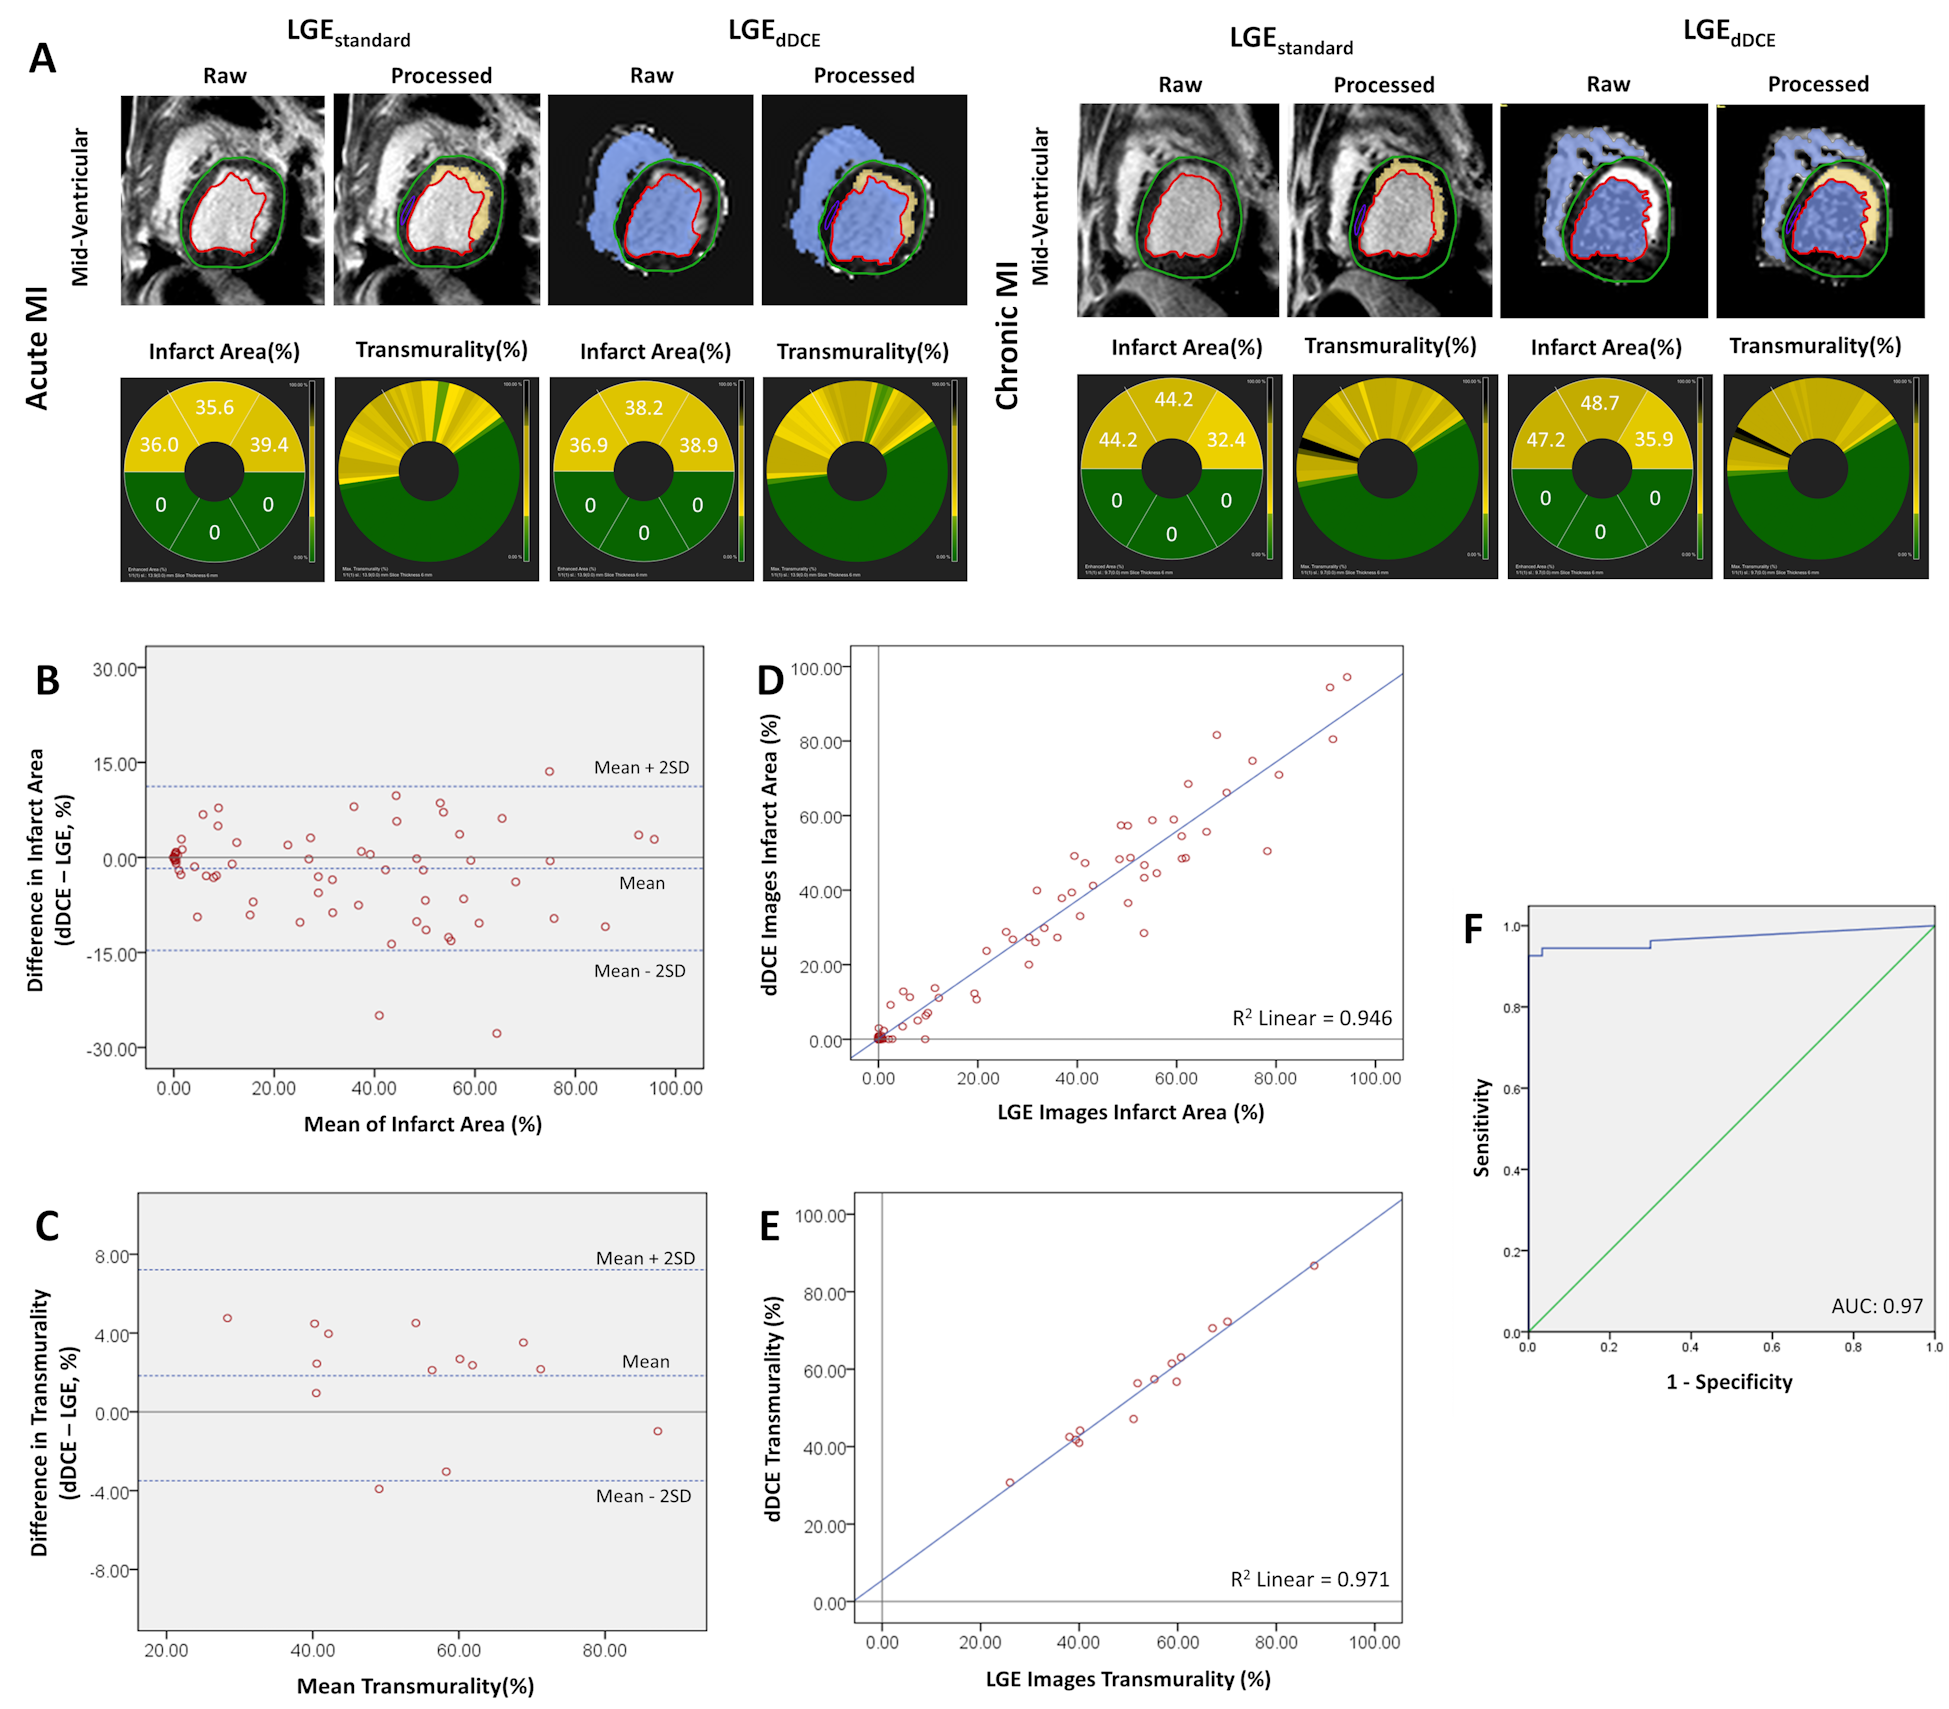
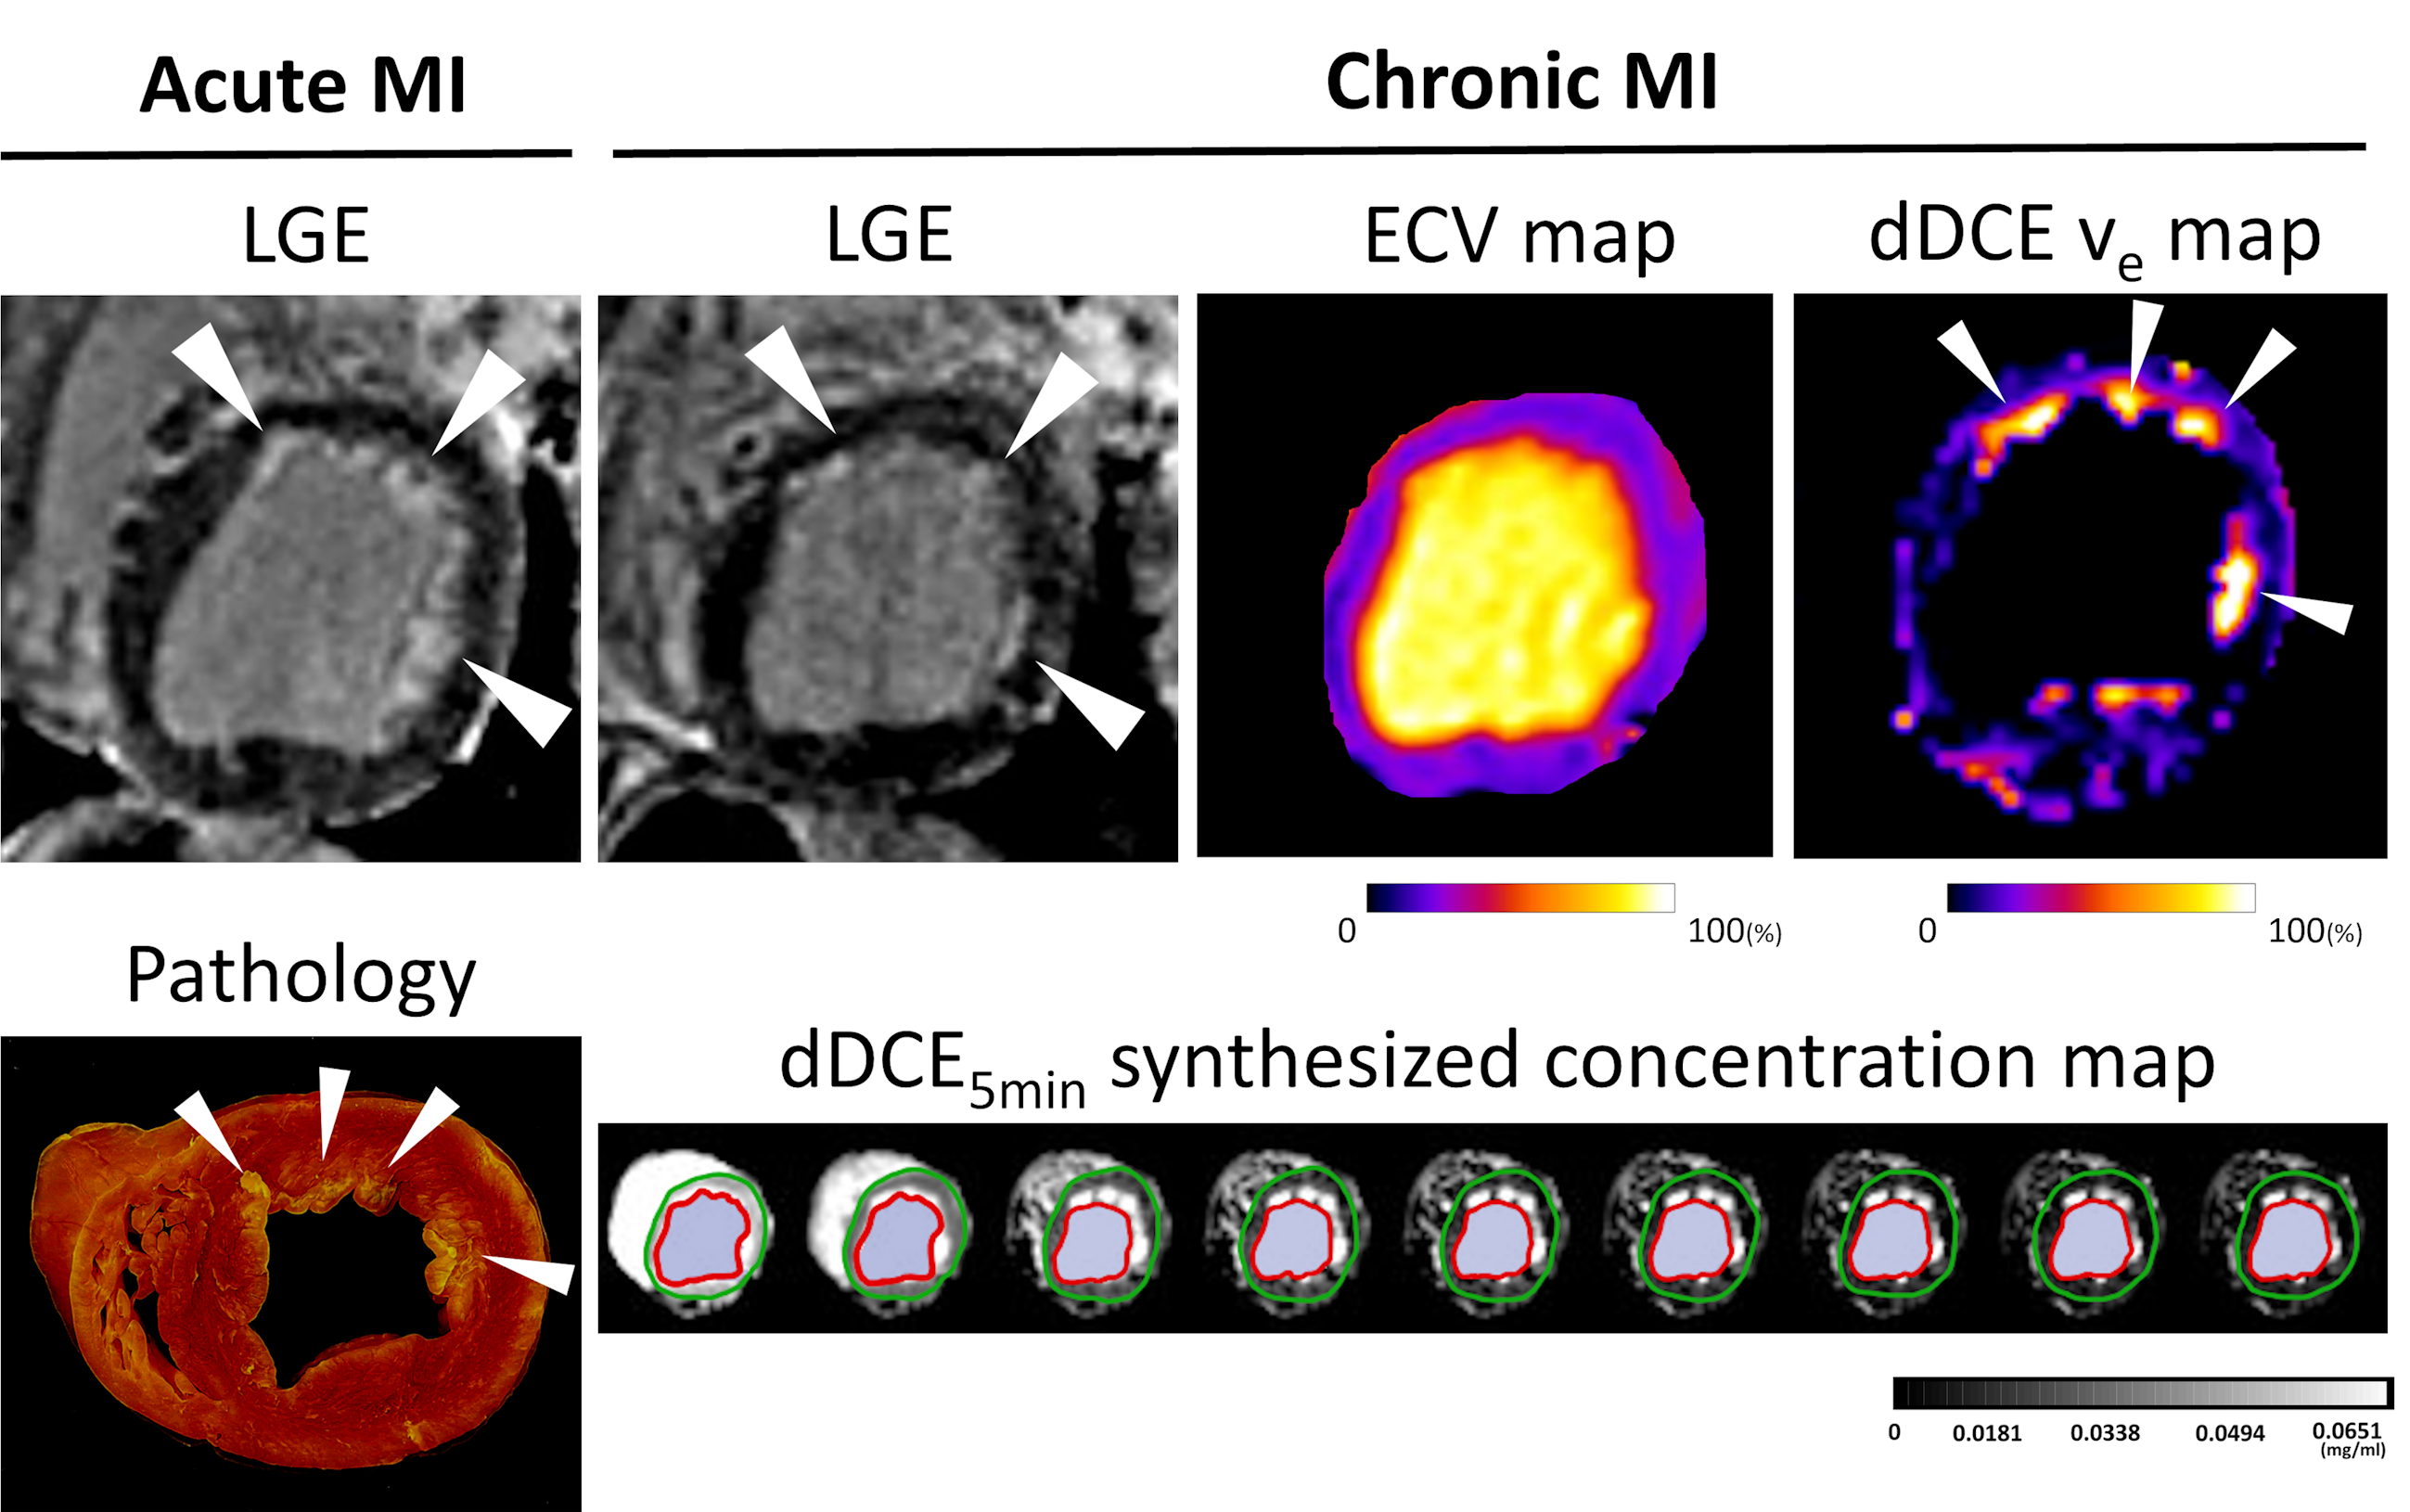
The dDCE30min map demonstrated a good spatial correspondence to the MI zone, displaying signal differences between remote myocardium and MI, that reflect the pathophysiology changes (Figure 2A). MI had significantly higher ve and PS values than the remote region (61.12±13.65% vs.13.43±5.00%, p=0.018; 44.62±21.40 mL·g-1·min-1 vs. 0.42±0.55 mL·g-1·min-1, p=0.018). The dDCE5min map values in each region showed no significant difference compared to dDCE30min (Figure 2B). Representative LGEstandard images and dDCE5min images presented in Figure 3A show high agreement in the presence of MI and microvascular obstruction. Bland-Altman analysis showed good agreement between LGEstandard images and the dDCE5min images for infarct area (bias, -1.74 ± 6.60 %, Figure 3B) and transmuraltiy (bias, 1.86 ± 2.73%, Figure 3C). The linear regression revealed strong correlations between the LGEstandard images and the dDCE5min images for infarct area (R2, 0.95; slope, 0.93, p < 0.01; intercept, 0.11%, p = 0.692; Figure 3D) and transmurality (R2, 0.97; slope, 0.93, p < 0.01; intercept, 5.50%; p = 0.05; Figure 3E). ROC analysis showed that the AUC was 0.97 (95% CI: 0.94 to 1.00) (Figure 3F). In addition, we observe an improved lesion-blood pool contrast in dDCE images. This is important for evaluating subendocardial MI, which was previously difficult to evaluate in LGEstandard images due to its close signal intensity to the blood pool. dDCE CMR can now be identified with strong image contrast in the ve map and synthesized late gadolinium enhancement image with prolonged washout time using dDCE5min maps (Figure 4).Discussion
The ve(extravascular extracellular volume) and PS(permeability-surface area) measured on dDCE maps were significantly higher in the MI than the remote, which demonstrated an increase in extravascular extracellular space (EES) or fibrosis4 and vascular permeability5 in the injured myocardium. The remote ve and PS values were within previously reported value ranges6-8. The lack of significant difference between the dDCE5min and dDCE30min maps implied that the dDCE5min map may provide comparative ve and PS information in 5 minutes after contrast medium administration. The visual and quantitative evaluation of MI showed a high correlation between LGEstandard imaging and LGEdDCE imaging, which was synthesized from the dDCE5min map. The highly similar LGEdDCE images between LGEstandard indicated that the ischemic injury may be confidently evaluated in a shortened post-contrast wait time. In cases where small subendocardial lesions are being evaluated, the close T1 value between the lesion and blood has been a long-standing issue for standard LGE imaging. This may result in an underestimation of MI or a false negative diagnosis. Because dDCE CMR can measure the EES, it provides extracellular contrast not confounded by the blood pool signal. This improves subendocardial MI detection and prevents missing small lesions that are clinically important.Conclusions
The developed dDCE CMR technique shows comparable MI detection ability to standard LGE without the prolonged wait time. It can address the major drawbacks of conventional LGE CMR and provide a rapid and quantitative myocardial viability evaluation with boosted lesions-blood contrast.Acknowledgements
Hsin-Jung Yang and Rohan Dharmakumar contributed equally to this work. This work is supported by 1R01HL136578; 1R01HL165211; 1R01HL148788; 1R01HL156818.References
1. Aquaro GD, De Gori C, Faggioni L, Parisella ML, Cioni D, Lencioni R, Neri E. Diagnostic and prognostic role of late gadolinium enhancement in cardiomyopathies. Eur Heart J Suppl. 2023;25:C130-c136. doi: 10.1093/eurheartjsupp/suad015
2. Alba AC, Gaztañaga J, Foroutan F, Thavendiranathan P, Merlo M, Alonso-Rodriguez D, Vallejo-García V, Vidal-Perez R, Corros-Vicente C, Barreiro-Pérez M, et al. Prognostic Value of Late Gadolinium Enhancement for the Prediction of Cardiovascular Outcomes in Dilated Cardiomyopathy. Circulation: Cardiovascular Imaging. 2020;13. doi: 10.1161/circimaging.119.010105
3. Kuruvilla S, Adenaw N, Katwal AB, Lipinski MJ, Kramer CM, Salerno M. Late Gadolinium Enhancement on Cardiac Magnetic Resonance Predicts Adverse Cardiovascular Outcomes in Nonischemic Cardiomyopathy. Circulation: Cardiovascular Imaging. 2014;7:250-258. doi: 10.1161/circimaging.113.001144
4. Croisille P, Revel D, Saeed M. Contrast agents and cardiac MR imaging of myocardial ischemia: from bench to bedside. European Radiology. 2006;16:1951-1963. doi: 10.1007/s00330-006-0244-z
5. Murakami M, Simons M. Regulation of vascular integrity. Journal of Molecular Medicine. 2009;87:571-582. doi: 10.1007/s00109-009-0463-2
6. Haunsø S, Paaske WP, Sejrsen P, Amtorp O. Capillary permeability in canine myocardium as determined by bolus injection, residue detection. Acta Physiol Scand. 1980;108:389-397. doi: 10.1111/j.1748-1716.1980.tb06549.x
7. Overholser KA, Bhatte MJ, Laughlin MH. Modeling the effect of flow heterogeneity on coronary permeability-surface area. J Appl Physiol (1985). 1991;71:758-769. doi: 10.1152/jappl.1991.71.2.758
8. Pack NA, Dibella EV, Wilson BD, McGann CJ. Quantitative myocardial distribution volume from dynamic contrast-enhanced MRI. Magn Reson Imaging. 2008;26:532-542. doi: 10.1016/j.mri.2007.10.003
Figures