1496
Cardiac Phantom-based Inter-site Calibration of T2, T1, and ECV Measurements1Stephens Family Clinical Research Institute, Carle Clinical Imaging Research Program, Carle Foundation Hospital, Urbana, IL, United States, 2Medical College of Wisconsin, Milwaukee, WI, United States, 3Vanderbilt University, Nashville, TN, United States, 4Children’s Hospital Colorado, Denver, CO, United States, 5Arkansas Children’s Hospital, Little Rock, AR, United States
Synopsis
Keywords: Myocardium, Heart, Transplant, T1-mapping, T2-mapping, ECV, Rejection, Calibration
Motivation: Acute rejection is the leading cause of death in pediatric heart transplant (PHTx) recipients. Endomyocardial biopsy is currently required to monitor for rejection. Quantitative cardiac magnetic resonance (CMR) is a potential non-invasive monitoring tool, with T2, T1, and ECV mapping providing information about fibrosis and edema. However, measurements vary between sites.
Goal(s): To measure inter-site/temporal variability and calibrate multisite PHTx CMR data.
Approach: We investigated manganese-chloride solution cardiac phantom T2 and T1 repeatability and inter-site variation, and impact of calibration on PHTx data.
Results: Calibration reduced inter-site variability in phantom and PHTx measurements.
Impact: Our preliminary results illustrating inter-site variation in CMR-relevant phantom T2 and T1 measurements support the need for inter-site calibration when multi-center trials are conducted using CMR parametric imaging (T2, T1, and calculated ECV).
Introduction
Acute rejection is the leading cause of death in pediatric heart transplant (PHTx) recipients3,4. Endomyocardial biopsy is the standard of care for diagnosing rejection9 and is performed frequently, e.g. weekly for 1-2 months, monthly to 1 year, and yearly thereafter post-transplant12,15. However, biopsy is invasive and limited to localized right ventricular septal samples6. Biopsy risks such as anesthesia/sedation complications and heart/vascular damage or occlusion are elevated in pediatric patients6,15. Non-invasive cardiac magnetic resonance (CMR) imaging could decrease biopsy frequency. Elevated transverse relaxation time (T2) is specific for increased myocardial free water such as in myocardial edema11 occurring with inflammation during acute rejection. T1 mapping pre/post gadolinium contrast administration permits calculation of extra-cellular volume (ECV) using same-day hematocrit, which measures relative extracellular matrix expansion due to diffuse reactive fibrosis or edema13. While multi-site studies are needed to enroll sufficient numbers of patients, they are complicated by variations in mapping measurements due to scanner hardware and software differences2,8,14 and measurement drift over time14. Phantoms with cardiac-relevant T1 and T2 may be useful for measuring and correcting for measurement drift and between-site variation2,8,14. We created an aqueous MnCl2 solution phantom for use in a prospective, multicenter CMR study in PHTx patients and tested its use for inter-site calibration.Methods
Phantom construction: Solutions of MnCl2∙4H2O at six concentrations (Figure 1) and 30 mM NaCl in deionized water were prepared. The MnCl2 concentrations were selected to provide CMR-relevant T2 and T1 values ranging from that of post-gadolinium-contrast-administration blood (T1≈250 ms) to native blood (T1≈1800-2000 ms) at 3T5,10. For each of 15 phantoms, six 50-mL polypropylene centrifuge tubes were filled with the MnCl2 solutions and sealed with thermoplastic. The centrifuge tubes were arranged in a custom 3D-printed polyactide structure, attached to a polycarbonate sheet, with 1-liter plastic bottles filled with 30 mM NaCl aqueous solution attached at the head/foot ends for coil loading7.Single-site baseline imaging: Coronal reference scans for all phantoms were acquired at 1.5T and 3T (MAGNETOM Sola and Vida, Siemens) using an 18-channel body coil “anteriorly” and spine coil elements “posteriorly”. The position on the scanner bed/relative to isocenter and shim volume were precisely matched for all scans. Single-slice T2 and T1 (native and contrast-enhanced targeted sequences) were performed using simulated EKG with R-R=900 ms. The 15 phantoms were scanned over the span of 11 weeks, after which phantoms were sent to other study sites.
Multisite imaging: Phantoms were scanned at 4 other sites using site-specific standard-of-care mapping protocols on 3 scanner models from two vendors (three 1.5T, one 3T). Weekly scans were performed for 3 weeks at two sites for initial assessment of site-specific coefficient of variation (CoV).
Processing and analysis: T2 and T1 map calculation was performed using each scanner’s cardiac mapping software. Image analysis was performed in MATLAB. Region-of-interest (ROI) measurements for each tube were automatically created on each map image from each phantom scan. ROI means and standard deviations were calculated. Baseline inter-phantom and between-scan CoV for all mapping series were calculated for each site.
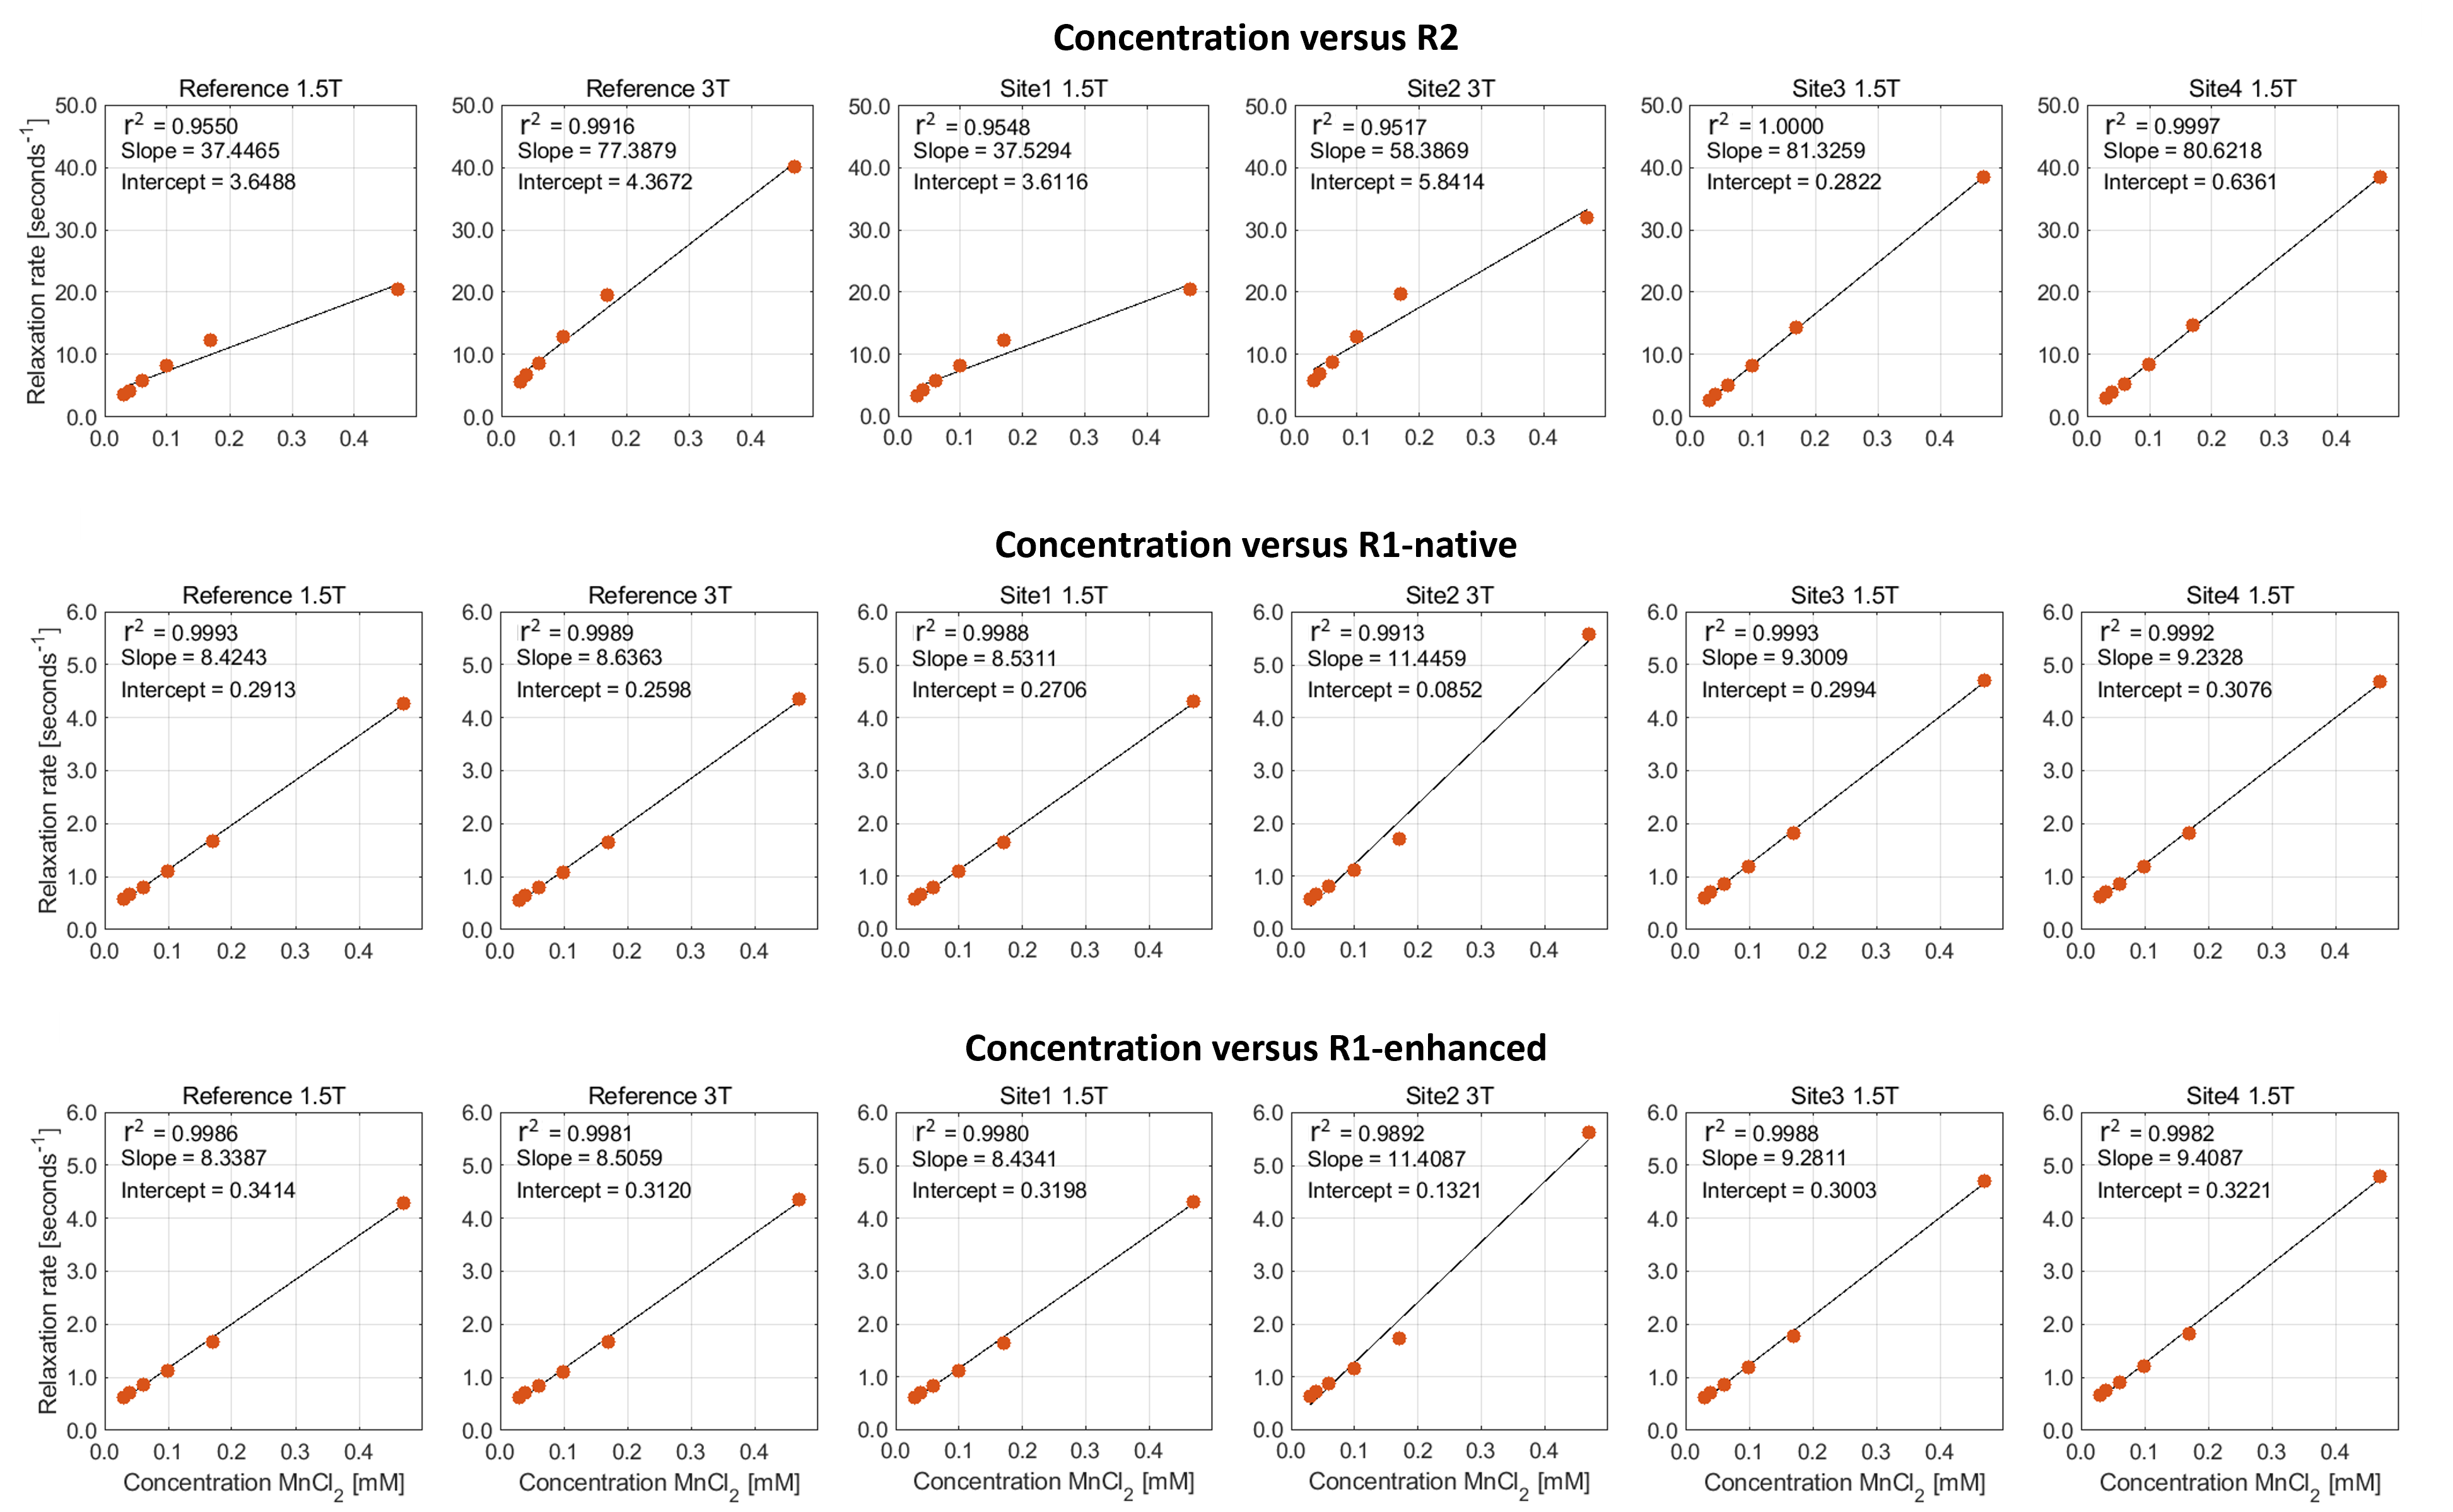
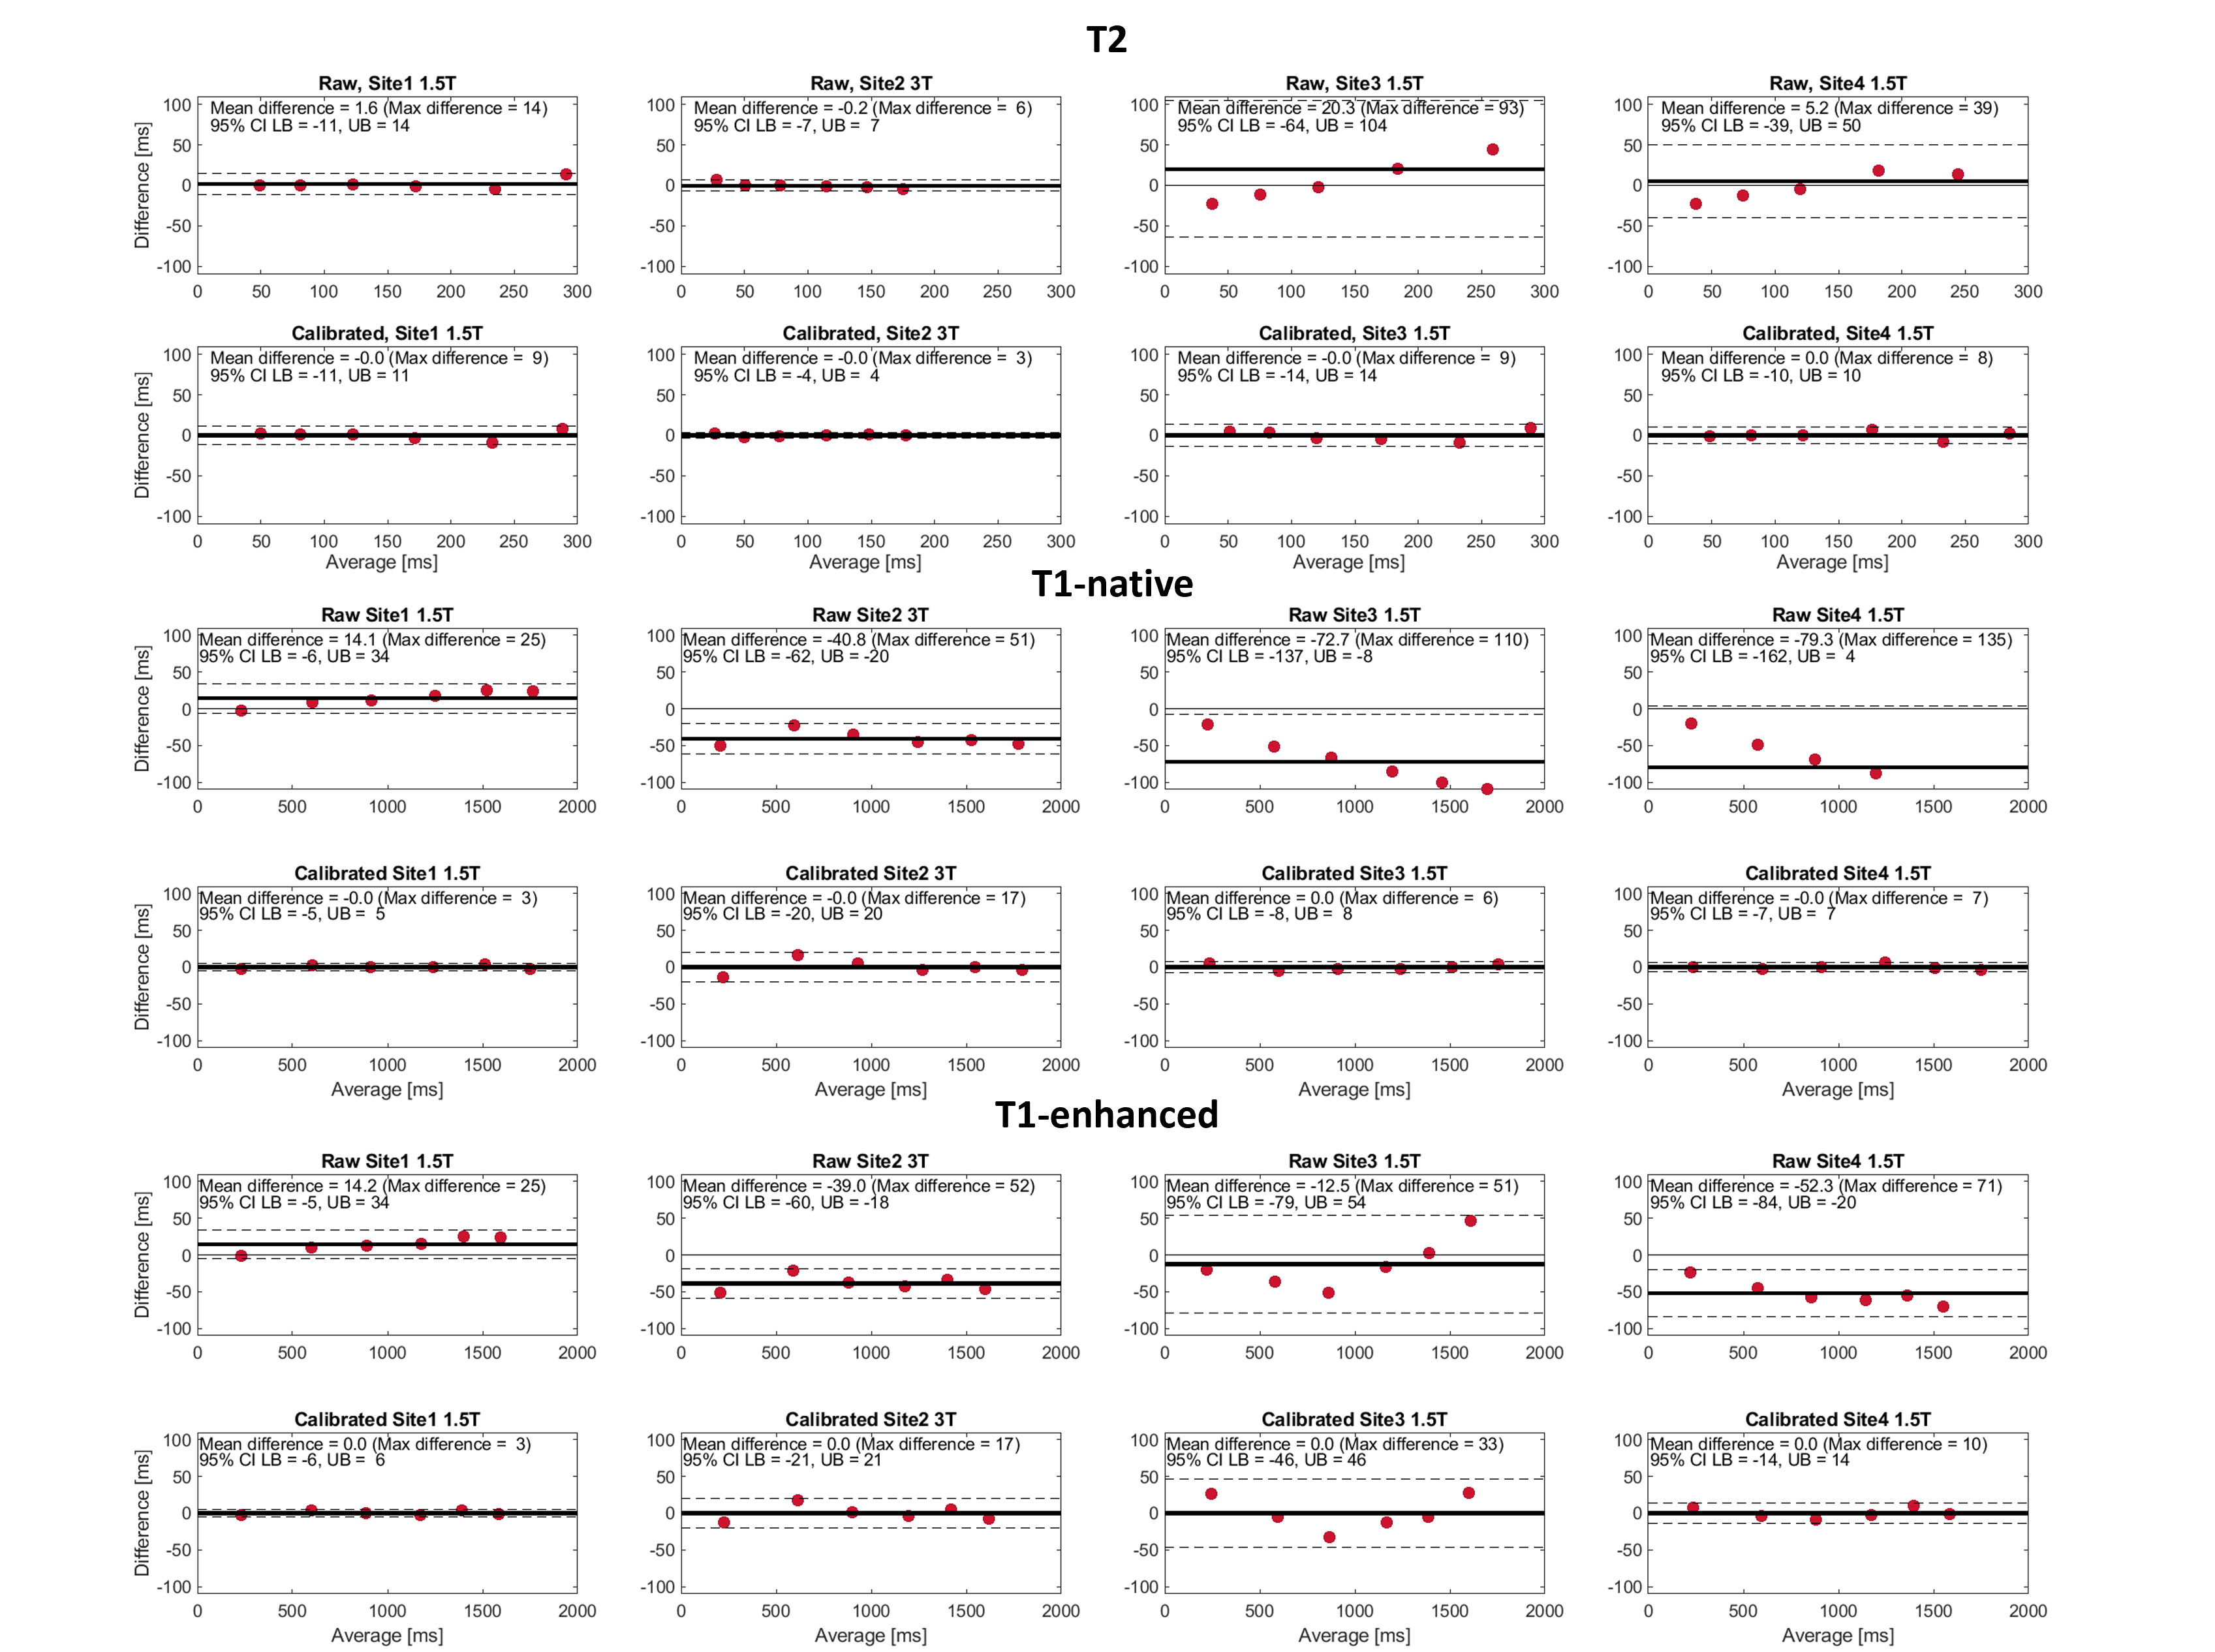
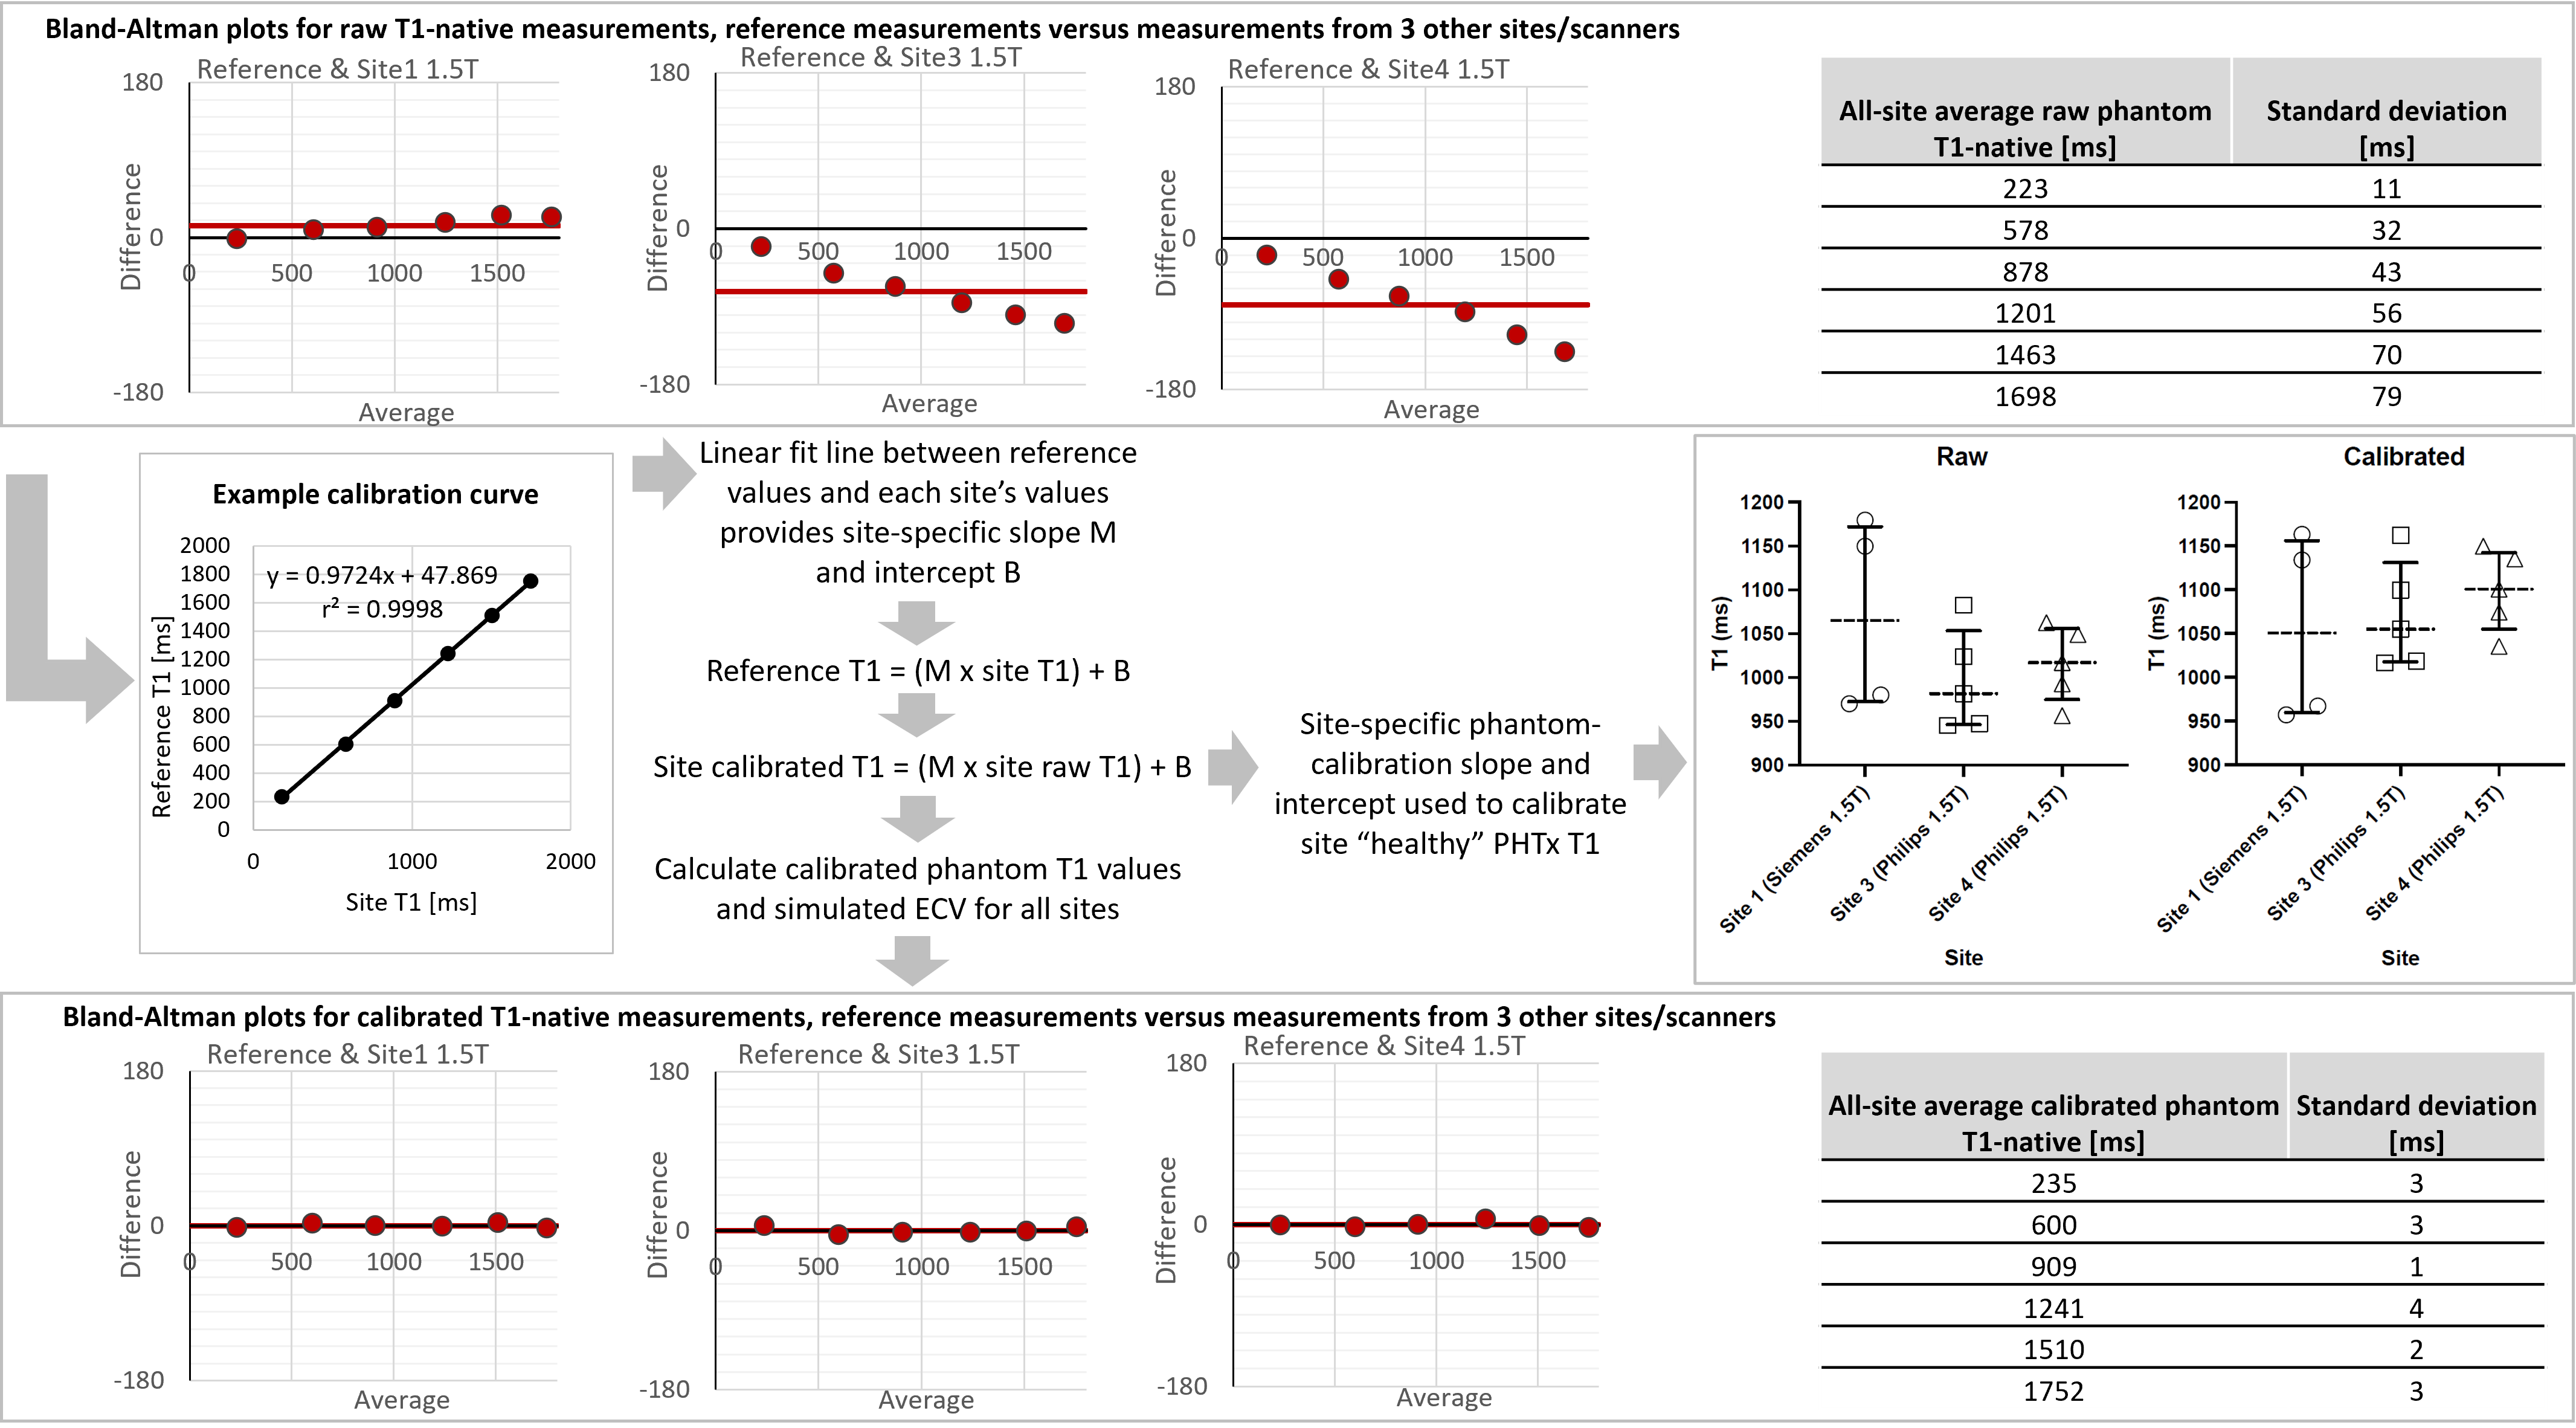
Relaxation rate (R2 and R1) versus concentration linear fits were calculated. Linear regression between reference and site measurements was used to calibrate site phantom T2 and T1 at 1.5T and 3T and simulated extra-cellular volume (ECV) values at 1.5T. ECV was simulated using hematocrit = 0.4 and reference site 1.5T physiologically relevant blood and myocardium T1-native/enhanced values and corresponding T1 values from the sites at matched MnCl2 concentrations. The phantom-based correction factors were used to pilot standardization of PHTx recipient T1-native from 3 sites.
Results
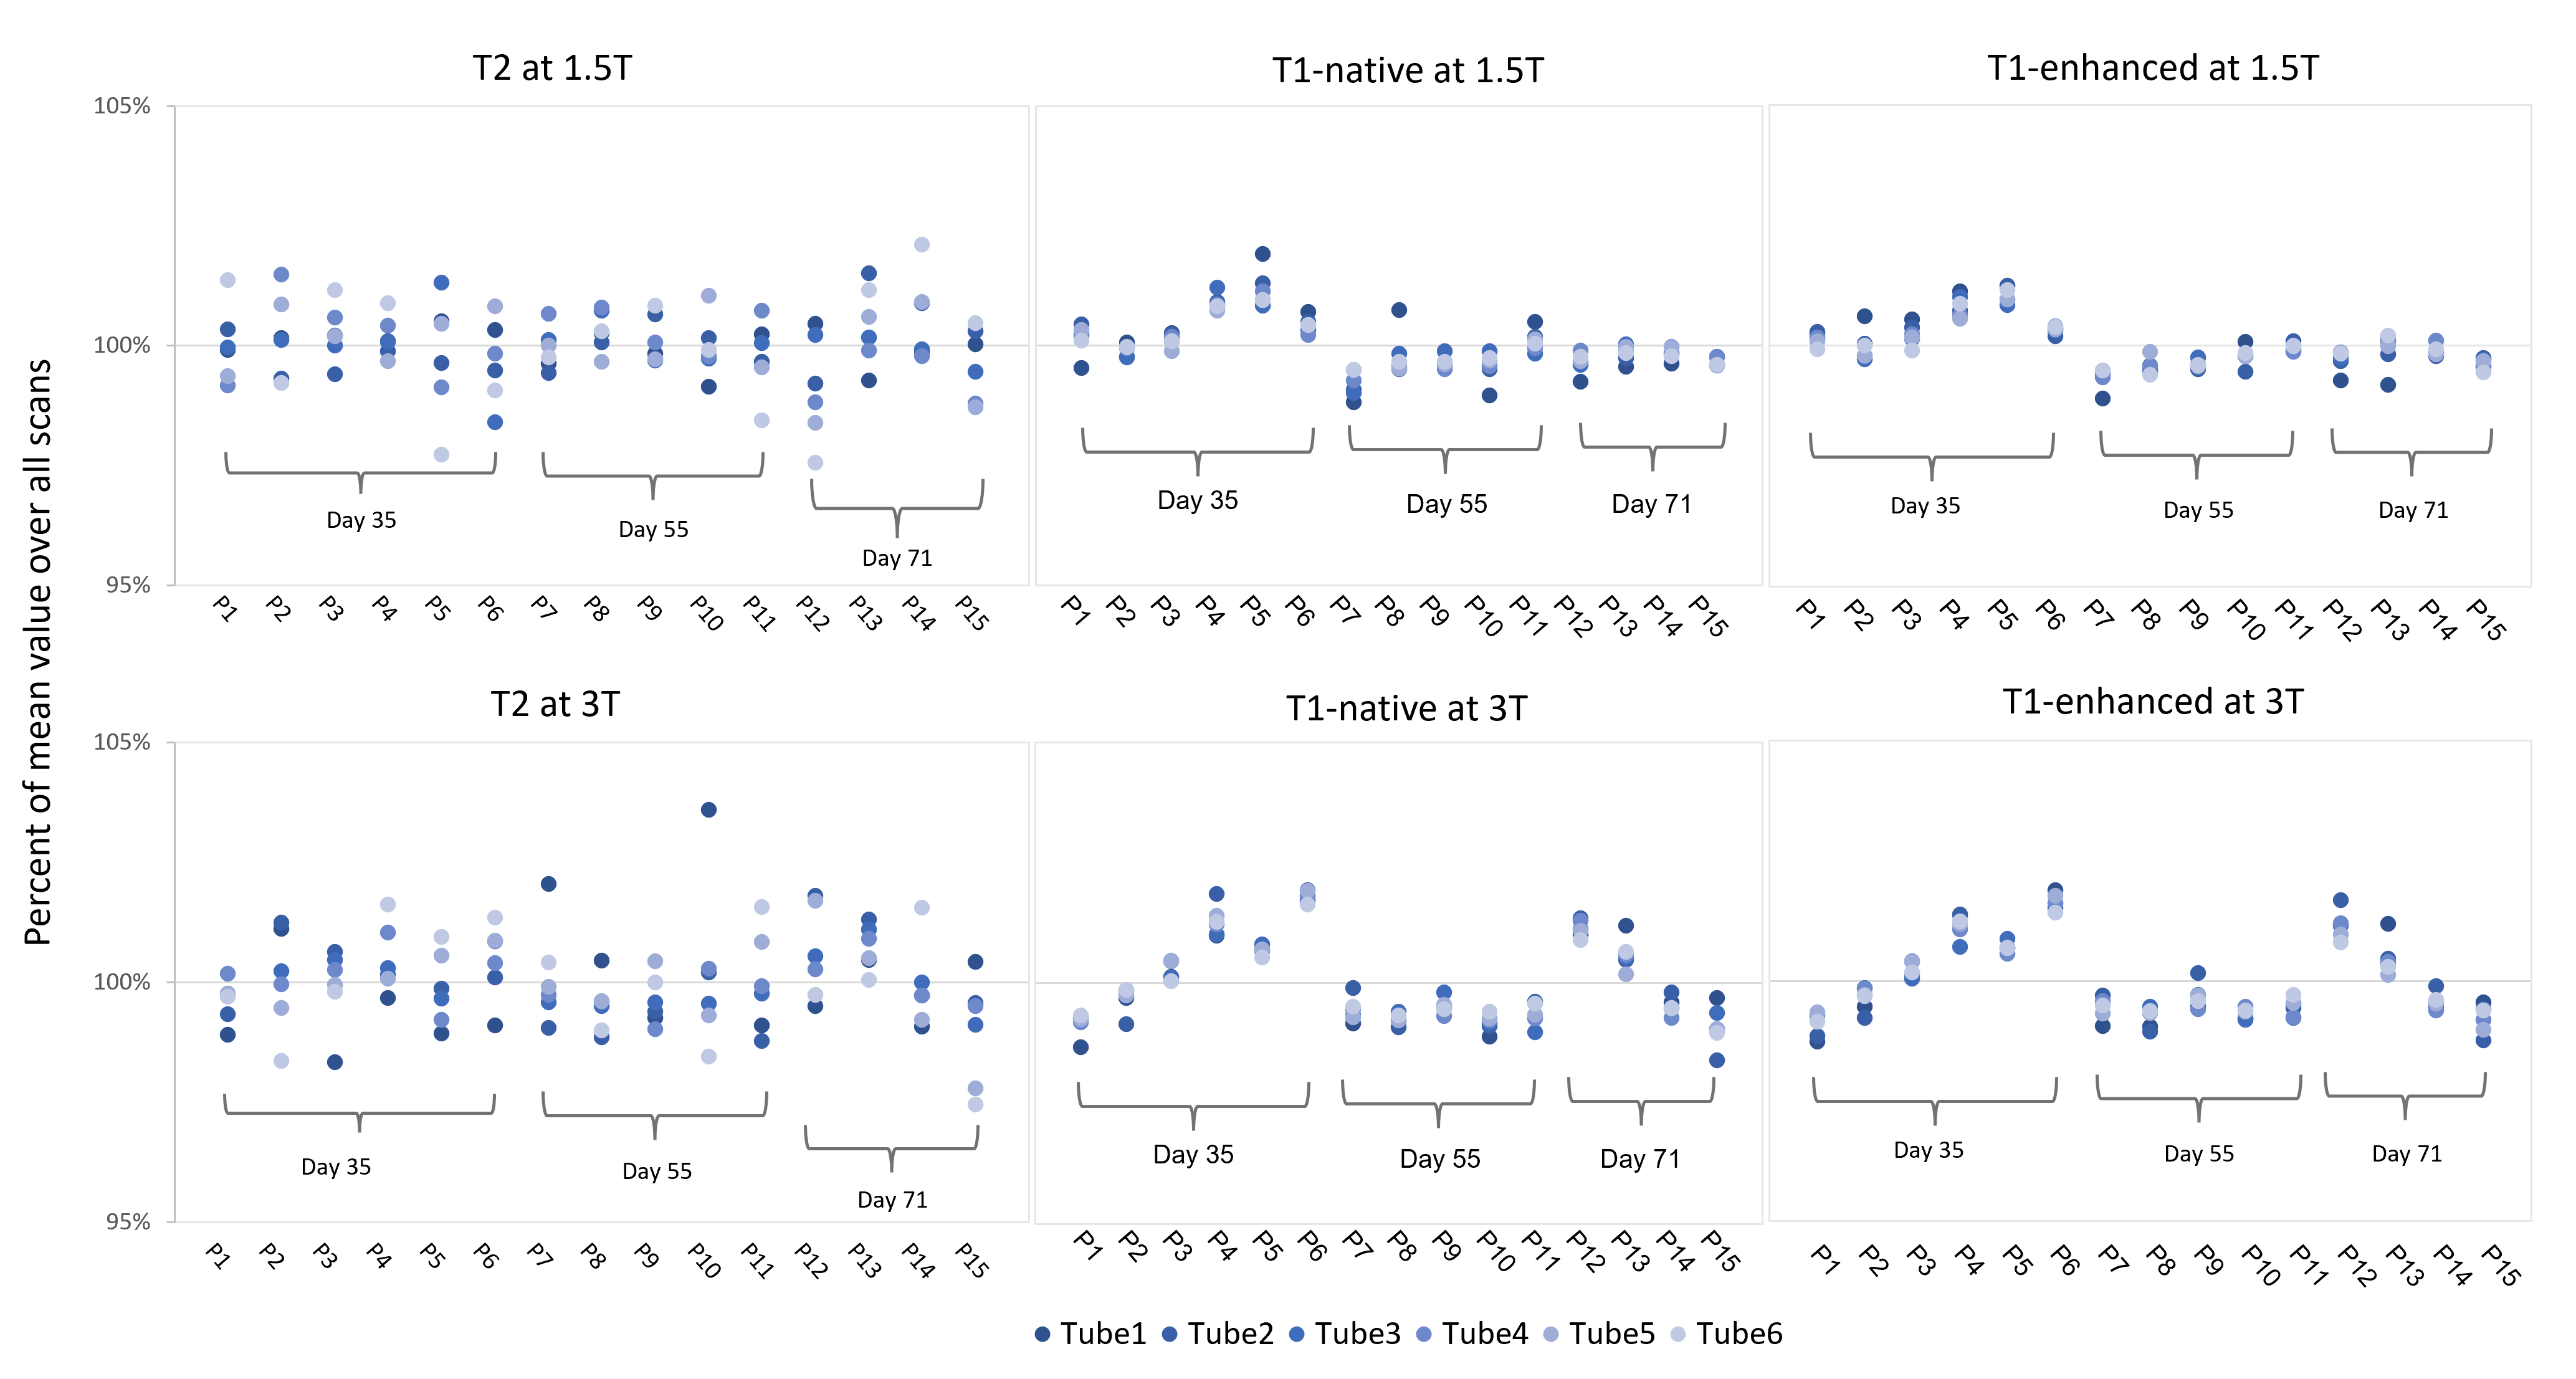
The single-site baseline results for 1.5T and 3T are shown in Figure 1. Figure 2 shows the variation in mapping measurements across the 15 phantoms over 3 measurement dates (CoV<1.4% for all reference measurements and site CoV<3.0%). Figure 3 shows the concentration-relaxation rate relationship and linearity (R1 r2>0.99, R2 r2>0.95). Figure 4 shows pre- and post-calibration results. Calibration successfully reduced phantom inter-site T2 and T1 differences without affecting the simulated ECVs (26.1±0.2% pre-calibration and 26.2±0.1% post-calibration). The correction factors reduced T1-native inter-site variability in healthy PHTx (Figure 5).Discussion
The phantoms showed excellent between-phantom similarity, repeatability and short-term stability, in line with that reported for other phantoms1. Phantom and PHTx quantitative mapping measurement variation was seen between sites as expected. Phantom and PHTx measurement variability was successfully reduced through phantom-based calibration.Conclusions
We demonstrate a method for phantom-based, within-field-strength calibration of multi-site T2, T1, and ECV measures.Acknowledgements
This work was supported by NIH R01-HL164995-01. We thank the PEACE Investigators and all site staff contributing to data collection.References
1. Captur G, Gatehouse P, Kellman P, et al. A T1 and ECV phantom for global T1 mapping quality assurance: The T1 mapping and ECV standardisation in CMR (T1MES) program. J Cardiovasc Magn Reson. 2016;18(S1):W14.
2. Dabir D, Child N, Kalra A, et al. Reference values for healthy human myocardium using a T1 mapping methodology: results from the International T1 Multicenter cardiovascular magnetic resonance study. J Cardiovasc Magn Reson. 2014;16(1):69.
3. Dipchand AI. Current state of pediatric cardiac transplantation. Ann Cardiothorac Surg. 2018;7(1):31-55.
4. Dipchand AI, Laks JA. Pediatric heart transplantation: long-term outcomes. Indian J Thorac Cardiovasc Surg. 2020;36(S2):175-189.
5. Granitz M, Motloch LJ, Granitz C, et al. Comparison of native myocardial T1 and T2 mapping at 1.5T and 3T in healthy volunteers: Reference values and clinical implications. Wien Klin Wochenschr. 2019;131(7-8):143-155.
6. Jamil AK, Afzal A, Nisar T, et al. Trends in post–heart transplant biopsies for graft rejection versus nonrejection. Bayl Univ Med Cent Proc. 2021;34(3):345-348.
7. Keenan KE, Ainslie M, Barker AJ, et al. Quantitative magnetic resonance imaging phantoms: A review and the need for a system phantom: Quantitative MRI Phantoms Review. Magn Reson Med. 2018;79(1):48-61.
8. Kellman P, Hansen MS. T1-mapping in the heart: accuracy and precision. J Cardiovasc Magn Reson. 2014;16(1):2.
9. Kim YH. Pediatric heart transplantation: how to manage problems affecting long-term outcomes? Clin Exp Pediatr. 2021;64(2):49-59.
10. Lee JJ, Liu S, Nacif MS, et al. Myocardial T1 and extracellular volume fraction mapping at 3 tesla. J Cardiovasc Magn Reson. 2011;13(1):75.
11. O’Brien AT, Gil KE, Varghese J, Simonetti OP, Zareba KM. T2 mapping in myocardial disease: a comprehensive review. J Cardiovasc Magn Reson. 2022;24(1):33.
12. Power A, Baez Hernandez N, Dipchand AI. Rejection surveillance in pediatric heart transplant recipients: Critical reflection on the role of frequent and long‐term routine surveillance endomyocardial biopsies and comprehensive review of non‐invasive rejection screening tools. Pediatr Transplant. 2022;26(3):e14214.
13. Taylor AJ, Salerno M, Dharmakumar R, Jerosch-Herold M. T1 Mapping. JACC Cardiovasc Imaging. 2016;9(1):67-81.
14. Vassiliou VS, Heng EL, Gatehouse PD, et al. Magnetic resonance imaging phantoms for quality-control of myocardial T1 and ECV mapping: specific formulation, long-term stability and variation with heart rate and temperature. J Cardiovasc Magn Reson. 2016;18(1):62.
15. Wagner SJ, Turek JW, Maldonado J, Staron M, Edens RE. Less Is More in Post Pediatric Heart Transplant Care. Ann Thorac Surg. 2019;107(1):165-171.
Figures