1492
Entropy of MRI T1 mapping as a novel biomarker to evaluate heart diastolic function and stiffness1Institute of Experimental Medical Research, Oslo, Norway, 2KG Jebsen Center for Cardiac Research, Oslo, Norway
Synopsis
Keywords: Myocardium, Cardiomyopathy, T1 mapping, entropy, fibrosis
Motivation: Cardiac T1 maps are a promising choice for texture analysis due to their pixel values originating from fitting, making them less prone to variations. Entropy of T1 map as a measure of myocardial tissue heterogeneity may reflect the disruption of myocardial fiber structure and/or the infiltration of extracellular matrix.
Goal(s): We aim to investigate the relationship between myocardial tissue properties and diastolic function, as well as myocardium stiffness.
Approach: We applied TA on native T1 maps of a pressure-overload rat model 12 weeks after the operation.
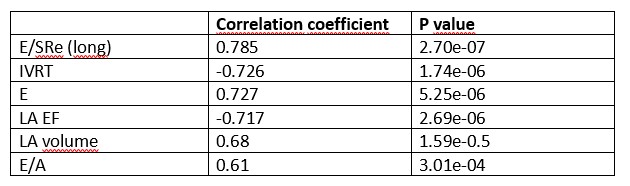
Results: Entropy exhibited a strong correlation with both chamber stiffness and diastolic function biomarkers.
Impact: Our data indicates that impaired diastolic function may be due to disorganized/disrupted myocardium, rather than increased fibrosis solely. Our research sheds new light on understanding the relationship between extracellular matrix and cardiac function.
Background:
Myocardial T1 is sensitive to many pathological changes and increases under fibrosis conditions. This offers us a valuable tool to probe the progression of fibrosis. Conventionally, T1 is reported as an average over a region of interest. This approach discards valuable information about the distribution of tissue properties. Texture analysis (TA) investigates the regional variation of images and offers extra information about tissue properties. TA on MRI magnitude images can prove challenging due to the potential influence on the pixel intensity by various scanning conditions and setups. Cardiac T1 maps are more robust for conducting texture analysis since the pixel values result from fitting when the T1 map quality is satisfactory.Methods:
All experiments are conducted at 21 cm bore size 9.4 T MRI magnet (Agilent Technologies, Palo Alto, CA, USA) interfaced to Avance Neo console (Bruker Biospin, Ettlingen, Germany). Scanning software Paravision 360 v3.3. 5 rats at different age (5,11,19 month old) went through 5 scanning sessions during 1.5 weeks to validate the precision of T1 mapping and entropy from T1 maps. A rat model of three different degrees of atrial constriction, along with sham-operated controls (n=34 total, 8 sham). MRI was conducted 12 weeks after the operation. T1 mapping protocol is respiratory-triggered, cardiac gated, Look-locker sequence with a spoiled, multi-slice, segmented gradient-echo readout. Data was postprocessed in Matlab R2018b by using house-developed program.Results:
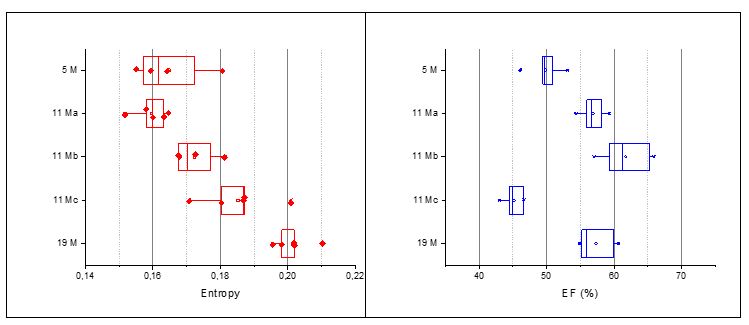
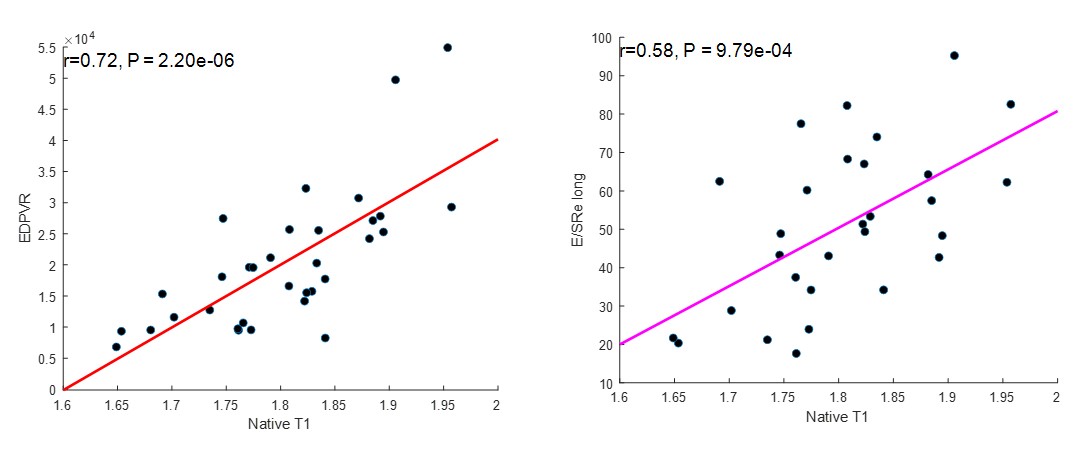
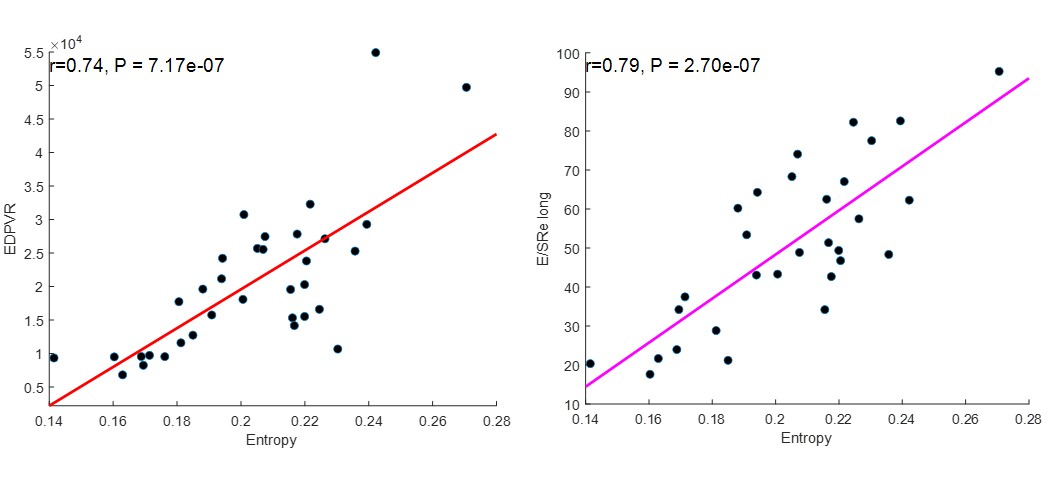
In five healthy rats at different age, the precision of T1 map entropy is comparable to the ejection fraction obtained from cine acquisition (4.48 %±1.59%; 4.56%±1.08%) (Figure 1). In 34 sham-operated and aorta-banded rats, native T1 values correlate well with the end-diastolic pressure-volume relationship (EDPVR) (Figure 2), indicating that T1 values reflect the extent of fibrosis and are correlated with left ventricle chamber stiffness. Figure 3 shows that entropy strongly correlates to EDPVR, and also with E/SRe, which is a marker for LV filling pressure (R=0.74; R=0.79 )(1).Conclusion:
Native T1, reflecting the extent of fibrosis, correlates well with heart stiffness measured by the 'gold standard' invasive method (EDPVR) but only moderately with diastolic function biomarkers. Entropy, which reflects tissue heterogeneity and the extent of extracellular matrix (ECM) infiltration, strongly correlates with diastolic function biomarkers and EDPVR. This suggests that impaired diastolic function may be due to disorganized myocardium rather than quantity of fibrosis solely.Acknowledgements
No acknowledgement found.References
1. Dokainish H, Sengupta R, Pillai M, Bobek J, Lakkis N. Usefulness of New Diastolic Strain and Strain Rate Indexes for the Estimation of Left Ventricular Filling Pressure. The American Journal of Cardiology 2008;101(10):1504-1509.Figures