1490
A Study on the Feasibility and Accuracy of Rapid T1 Mapping Utilizing Deep Learning Techniques in Cardiac Magnetic Resonance Imaging1Tianjin Beichen Hospital, Tianjin, China, 2Tianjin Medical University General Hospital, Tianjin, China, 3United Imaging Healthcare, Shanghai, China, 4United Imaging Healthcare, Houston, TX, United States
Synopsis
Keywords: Myocardium, Quantitative Imaging, T1 Map,Deep Learning,MOLLI
Motivation: To overcome limitations of prolonged acquisition and breath-hold(BH) times in Cardiac Magnetic Resonance Imaging (CMR), specifically MOLLI sequence, enhance patient comfort and compliance.
Goal(s): Aimed to validate MyoMapNet sequence with inline reconstruction against the standard MOLLI protocol, focusing on image quality and T1 measurement accuracy, reducing scan time and BH durations.
Approach: 20 subjects were imaged using two sequences. Image quality was assessed via edge sharpness and signal intensity ratios,T1 accuracy was determined through myocardial segment analysis.
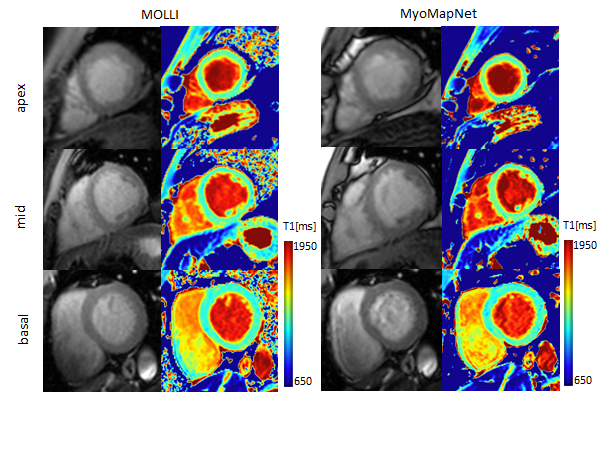
Results: MyoMapNet achieved comparable image quality and T1 accuracy to MOLLI with shorter acquisition times, demonstrating no significant difference in myocardial and blood pool T1 values.
Impact: MyoMapNet offers a rapid and reliable alternative for myocardial T1 mapping, reducing scan time and heart rate dependence, which can improve patient throughput and comfort in clinical CMR workflows. Future studies will expand to post-contrast T1 values and ECVs.
Introduction
CMR is an important non-invasive method for evaluating cardiac structure, function, and tissue characteristics.T1 mapping can quantitatively measure the T1 value of each voxel in myocardium, and calculate the native T1 value, post-contrast T1 value and extracellular volume (ECV) fraction of myocardial tissue, which has a significant advantage in the quantitative evaluation of diffuse cardiomyopathy noninvasively. MOLLI sequence is a routine clinical T1 mapping sequence, which has good reproducibility and accuracy [1]. However, its long acquisition time and BH time limit its clinical application. Guo [2] developed a fast T1 mapping sequence based on deep learning, named MyoMapNet,which is a rapid myocardial T1 mapping approach with fully connected neural networks (FCNNs) to estimate T1 values from four T1-weighted images acquired with a single inversion pulse in five heartbeats. This method can greatly shorten the acquisition time and BH time, reduce heart-rate dependence, and improve the success rate of examination in patients with heart diseases. This study aimed to validate the MyoMapNet sequence with inline reconstruction against the standard MOLLI protocol, focusing on image quality and T1 measurement accuracy, while reducing scan time and BH durations.Method
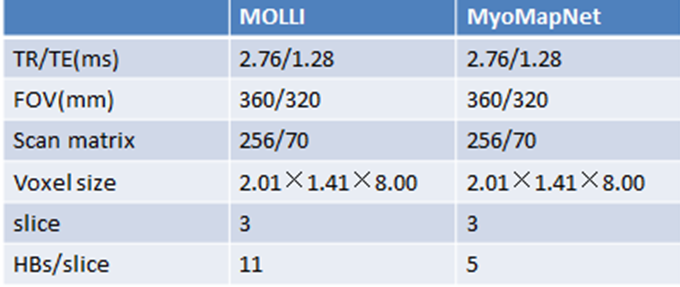
In this study, 20 participants (13 male, 7 females; average age 37 ± 13 years) were recruited with IRB approval. All images were acquired on a 3T scanner (uMR 780, United Imaging Healthcare, Shanghai, China) equipped with a 12-channel body phased-array coil. For each subject, MyoMapNet and MOLLI imaged three left-ventricle slices in the short-axis view under breathing holding. MyoMapNet and MOLLI were performed in a random order. The acquisition parameters of MyoMapNet: TR/TE=2.83/1.33ms; FOV=360×320mm; scan matrix=256×70; voxel size=2.01×1.41×8.00mm; completing 5 heartbeats (HBs) per slice for a total of 3 slices.In comparison, MOLLI parameters with identical TR/TE, FOV, scan matrix, and voxel size as MyoMapNet, but with 11 HBs per slice across 3 slices.
In our study, motion correction algorithms were employed to address any alignment discrepancies across the T1-weighted images[3]. Subsequent to image acquisition, all data were forwarded to a specialized United Imaging Healthcare workstation for further analysis. The edge sharpness and blood pool-myocardial signal intensity ratio were measured to compare the image quality between the two techniques[4]. The mean ± standard deviation (SD) of T1 was calculated for each myocardial segment according to the AHA 16-segment model and blood. The paired students’ t-test was used to examine the difference between the two techniques in image quality and accuracy. This statistical evaluation was carried out using SPSS software(version 26.0).
Result
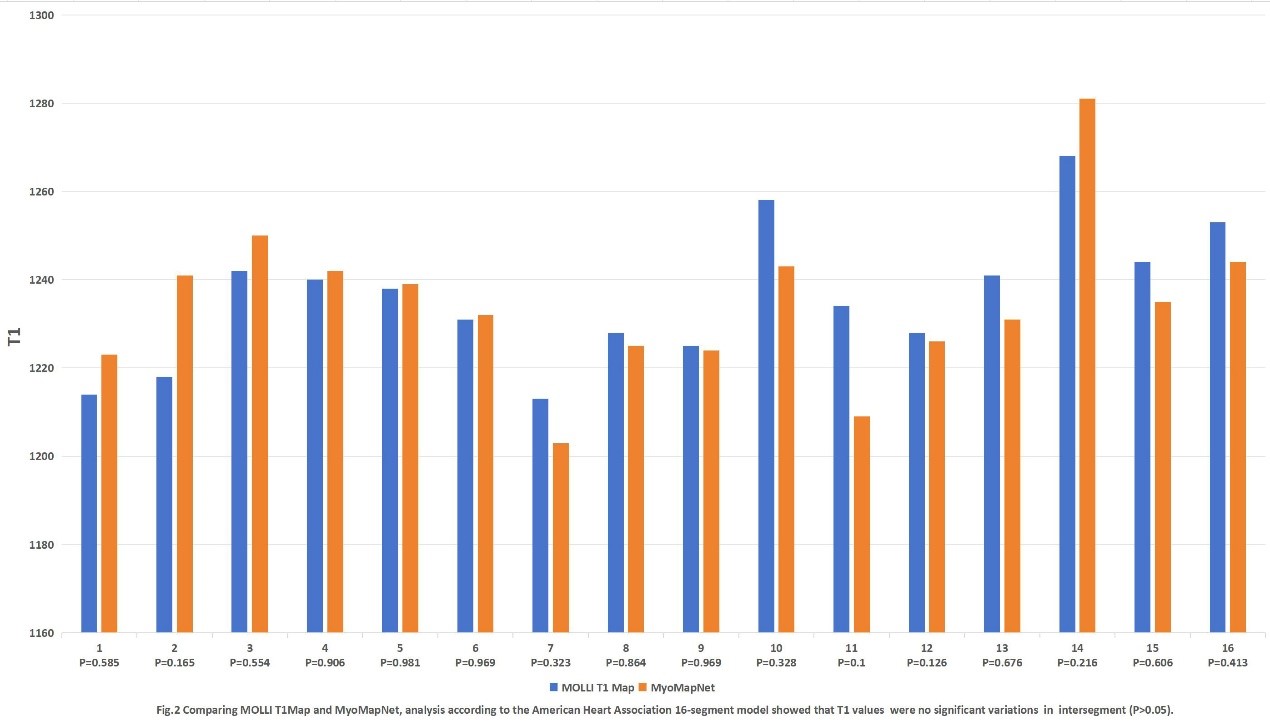
The comparative analysis of image edge sharpness between the MyoMapNet and MOLLI T1 mapping sequences yielded results of 588±83ms and 596±60ms, respectively, with no significant difference observed (P=0.705). Similarly, the signal intensity ratio(SNR) comparing the blood pool to myocardial tissue for MyoMapNet and MOLLI sequences was 1.47±0.09 and 1.48±0.05, which also did not show a significant difference (P=0.64). When comparing T1 measurements of myocardial and blood tissues, both MyoMapNet and MOLLI sequences reported comparable results; for myocardium, the values were 1234±59ms and 1236±64ms (P=0.595), and for blood, 1821±81ms and 1817±91ms (P=0.818), respectively. The detailed myocardial T1 values across the segments are depicted in Figure 2, reinforcing the lack of significant disparities among each segment’s measurements.Discussion
In our study, we evaluated the image quality and T1 measurement accuracy between the MyoMapNet and the traditional MOLLI T1 mapping sequences. Our findings demonstrate that MyoMapNet, requiring only five heartbeats for image acquisition, delivers quality on par with the well-established MOLLI approach. The T1 values calculated from the MyoMapNet sequence matched the accuracy of those obtained from MOLLI, with both methods producing high-quality images. In clinical application, the acquisition time and breath holding time will be greatly shortened, and heart rate dependence will be alleviated, which will accelerate the clinical work flow of myocardial tissue characterization in daily CMR examination. At present, our research only compared the Native T1 values and the image quality between the two sequences, but there is a lack of evaluation of post-contrast T1 values and ECVs. This will be the future work for achieving a comprehensive comparison of the two sequences.Conclusion
MyoMapNet's myocardial T1 mapping offers a significant advantage over MOLLI by halving the required scan and breath-hold durations, and alleviate the heart-rate dependence, which will improve patient compliance and T1 reproducibility. Our findings indicate that MyoMapNet matches MOLLI in terms of image fidelity and measurement precision, even with the accelerated scanning process.Acknowledgements
Thanks to Tianjin Medical University General Hospital, Tianjin Beichen Hospital and United Imaing Healthcare for their equipment and technical support. I would like to thank Teacher Dong Li, Professor Rui Guo , Scientist Jian Xu and Fan Yang for their professional guidance. Their rigorous academic style is worth learning from. Thanks to Qing Liu,Jing Li and Junpu Hu, they have given me a lot of help, and once again I would like to express my sincere thanks.References
1.Messroghli D R, Radjenovic A,Kozerke S,et al,Modified Look-Locker inversion recovery (MOLLI) for high-resolution T1 mapping of the heart[J].Magnetic Resonance in Medicine,2004,52(1):141.
2.GuoR,El-RewaidyH,AssanaS,et al.Accelerated cardiac T 1 mapping in four heartbeats with inline MyoMapNet:a deep learning-based T 1 estimation approach[J].J Cardiovasc Magn Reson,2022,24(1):6. 3.Xue H,Shah S,Greiser A,Guetter C,Littmann A, olly MP,Arai AE,Zuehls ‑ dorf S,Guehring J,Kellman P.Motion correction for myocardial T1 mapping using image registration with synthetic image estimation. Magn Reson Med.2012;67(6):1644-55. 4.V.Muthurangu,P.Lurz,J.D.Critchely,J.E.Deanfield,A.M.Taylor,M.S.Hansen,Realtime assessment of right and left ventricular volumes and function in patients with congenital heart disease by using high spatiotemporal resolution radial k-t SENSE,Radiology 248 (2008) 782-791.
Figures