1489
Characristics of left ventricular T1 mapping and left atrial strain for distinguishing myocardial amyloidosis and hypertrophic cardiomyopathy1The First Affiliated Hospital of Harbin Medical University, Harbin, China, 2Philips Healthcare, Beijing, China
Synopsis
Keywords: Myocardium, Cardiomyopathy, T1mapping;feature tracking;strain
Motivation: Left ventricular hypertrophy(LVH)is a common manifestation of many cardiac diseases, including myocardial amyloidosis (CA), hypertrophic cardiomyopathy (HCM), among others. Clinical diagnosis of the etiology of LVH has some difficulties
Goal(s): Differences in myocardial T1 values and left atrial strain between CA and HCM patients remain unclear
Approach: In this study, T1mapping and feature tracking based on left atrial were applied to identify CA and HCM
Results: Results illustrated that T1 values and left atrial strain were significantly different between CA and HCM. T1 mapping combined with left atrial reservoir function (Εs) could effectively distinguish CA from HCM.
Impact: T1mapping and feature tracking techniques, as emerging imaging techniques in cardiac magnetic resonance(CMR) in recent years, have been widely used in the study of various myocardial diseases because they do not require the injection of contrast agents.
Introduction
Myocardial amyloidosis (CA) is a relatively rare form of cardiomyopathy in which the heart experiences diastolic filling limitations due to an accumulation of abnormally folded protein deposits termed amyloid fibrils in cardiomyocytes and extracellular mesenchyme.Hypertrophic cardiomyopathy (HCM) and CA are cardiomyopathies with distinct pathogeneses [1-3], but exhibit similar imaging features, such as left ventricular hypertrophy (LVH) [4]. CMR gadolinium delayed enhancement (LGE) has valuable clinical utility in differential diagnosis [5], but requires contrast enhancement and can solely assess focal myocardial lesions or early disease stages [6-7]. T1 mapping can quantitatively evaluate diffuse myocardial fibrosis, which does not need the use of contrast agents. The CMR feature tracking(CMR-FT) can generate multidimensional myocardial contraction information by carrying out strain analysis in the radial, circumferential, and longitudinal dimensions.Therefore, this study aimes to use non-contrast T1 mapping and left atrial feature tracking techniques to distinguish myocardial CA from HCM.Methods
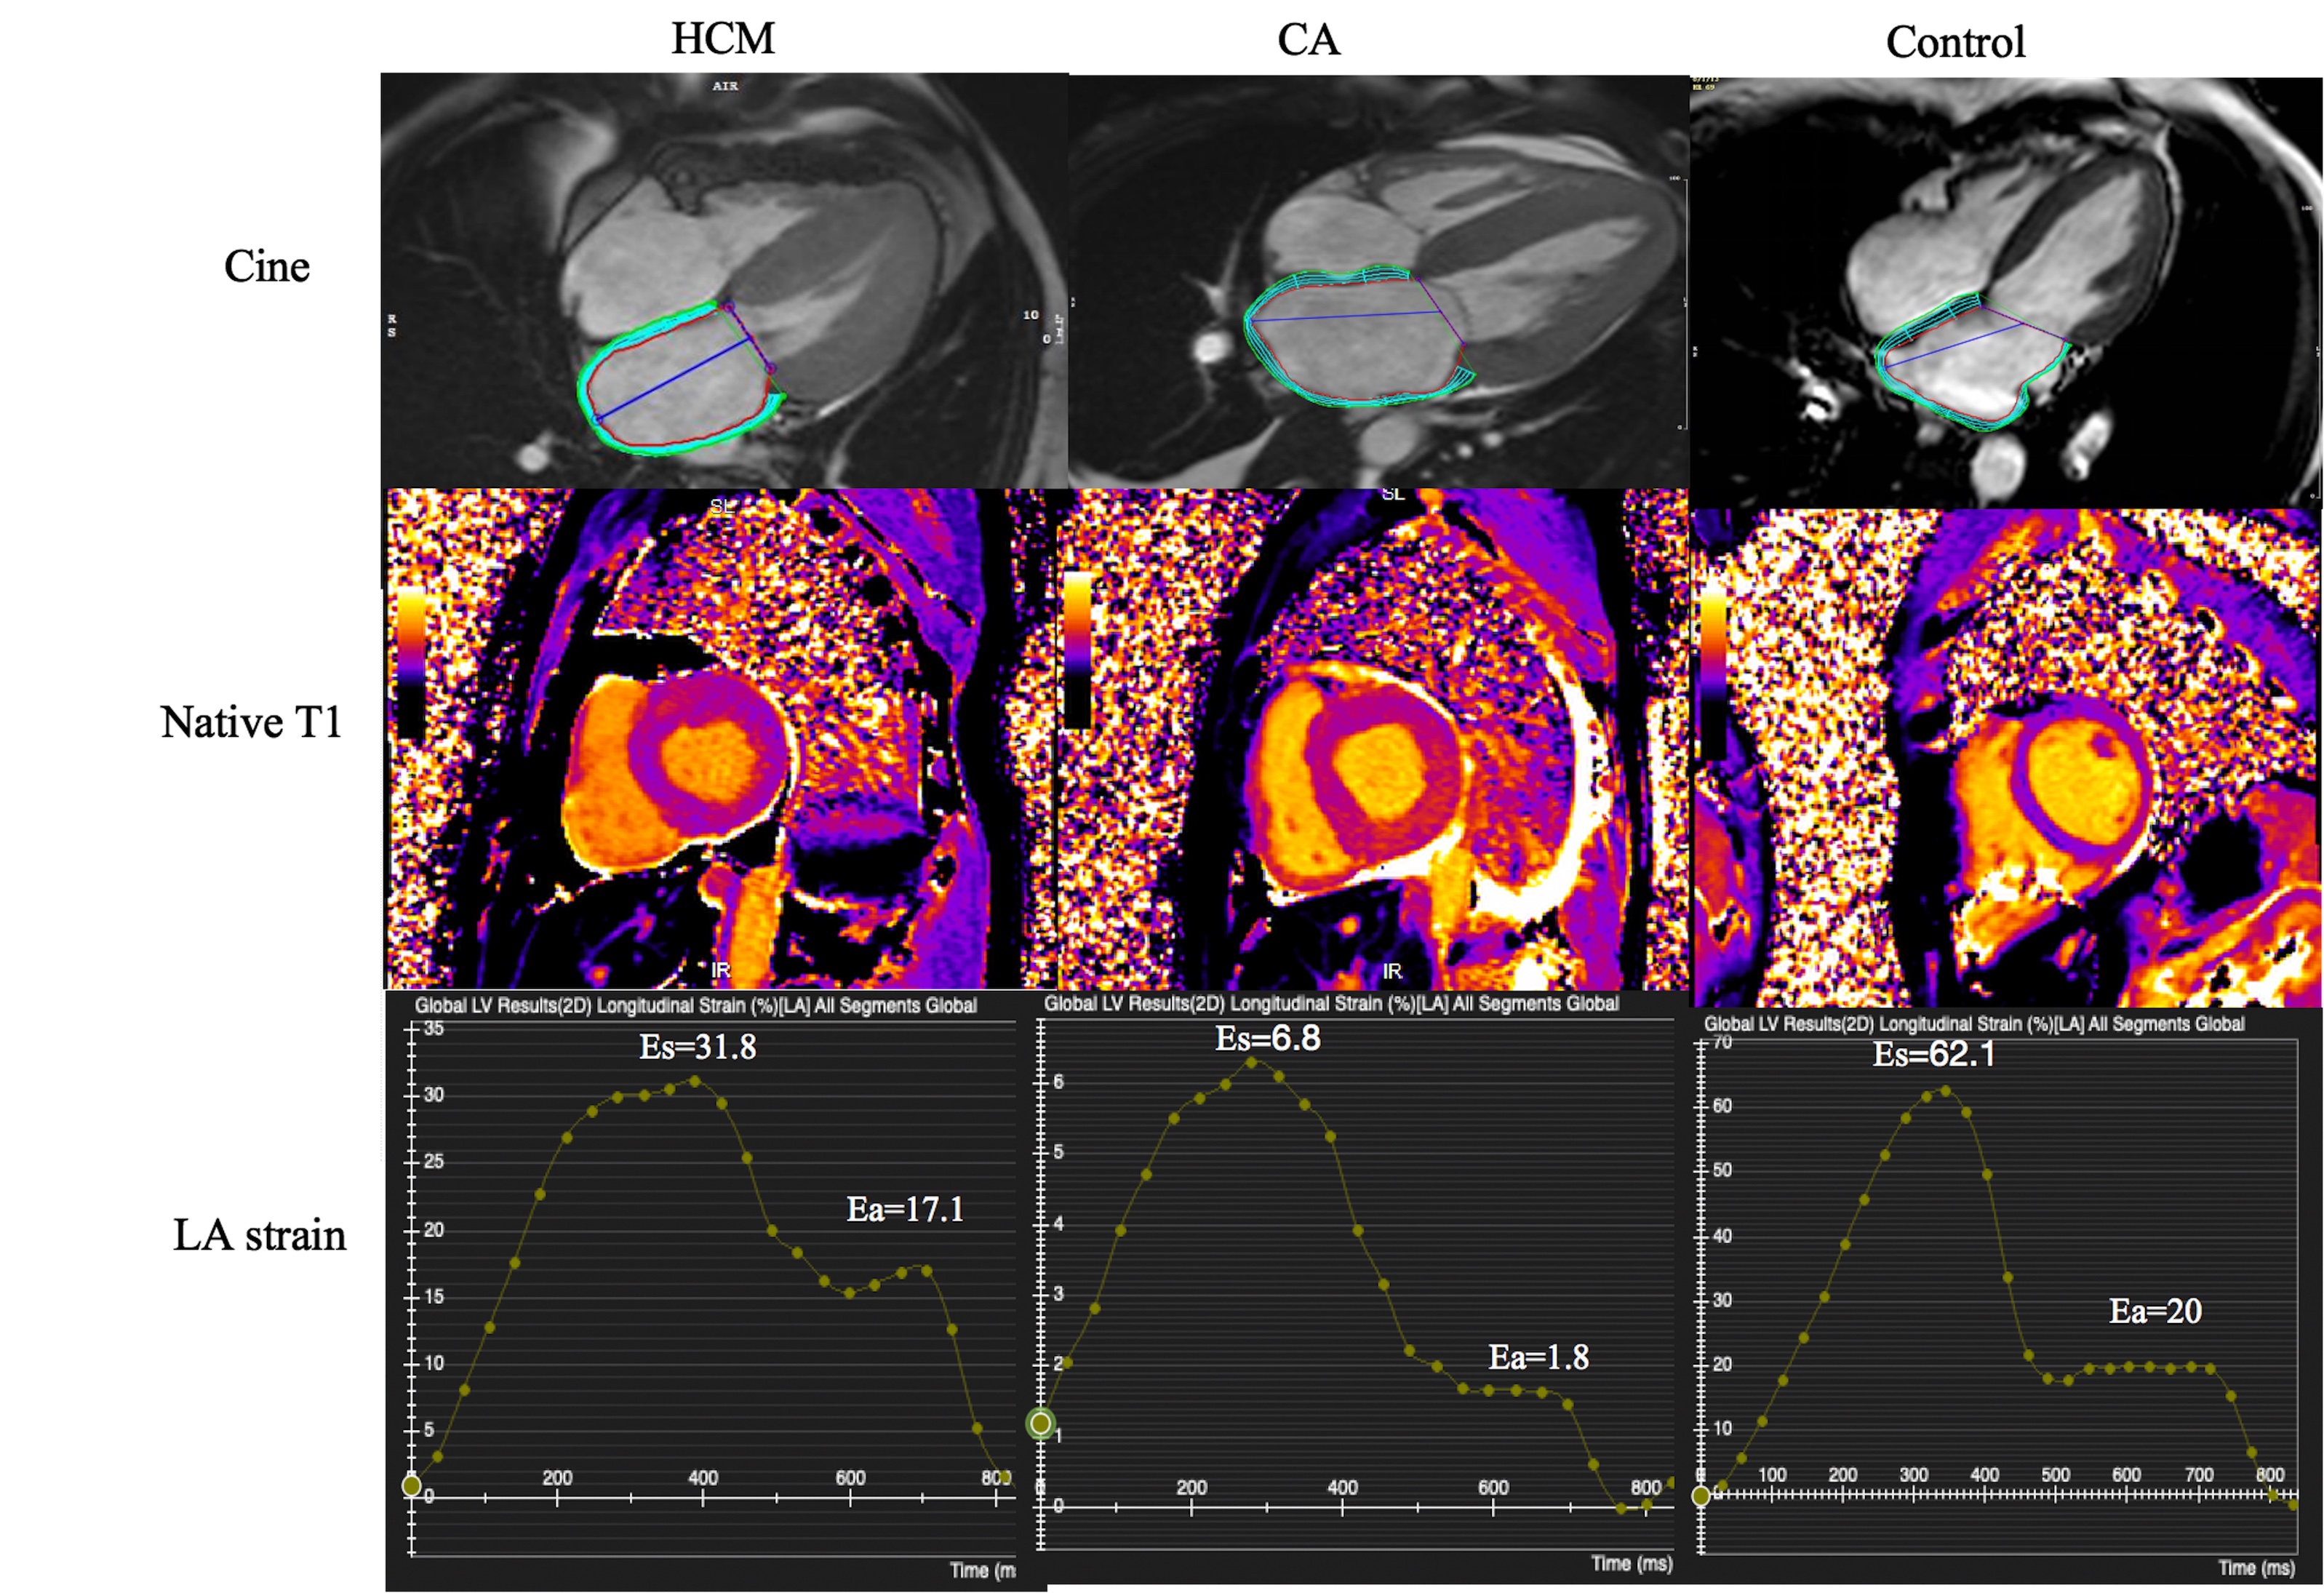
One hundred and twenty-five patients with left ventricular hypertrophy administered CMR from January 2021 to January 2023 were retrospectively analyzed . CMR examinations were carried out on 1.5T and 3.0T MRI scanners (Magnetom Amira, Siemens, Erlangen, Germany; and Ingenia Elition, Philips Healthcare, The Netherlands). The CVI42 software (Circle Cardiovascular Imaging; Canada) was utilized to calculted overall myocardial T1 values. To standardize the T1 values for various vendors and field strengths, the following calculation formula was used[8]: T1z-score = (patient T1value - mean T1value of healthy control)/ (SD of healthy control).The endocardium of the left atrial was manually labelled based on the maximum volume of the ventricle at end-systole, excluding pulmonary veins and the left auricle, and a time-strain curve for the left atrial was generated (Figure 1). The diagnostic efficacy of each index was determined by receiver operator characteristic (ROC) curve . Multivariate logistic regression was performed to assess the ability of T1z-score and left atrial strain parameters in combination to differentially diagnose CA and HCM. SPSS 26.0 (Chicago, Illinois, USA) and MedCalc (version 20, MedCalc Software, Ostend, Belgium) were employed for data analysis.Results
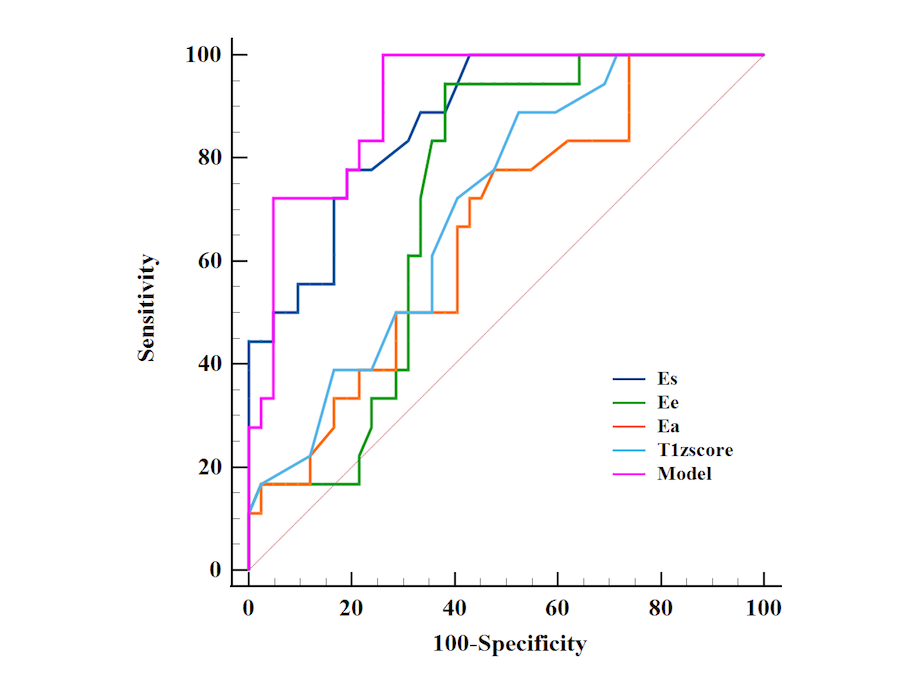
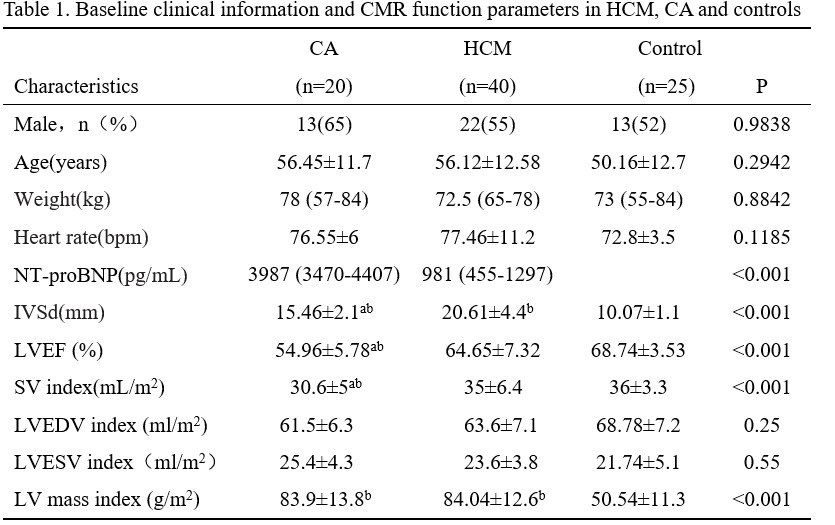
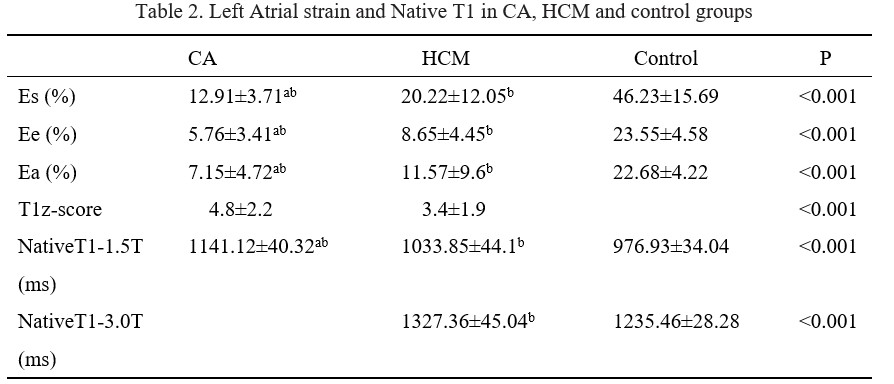
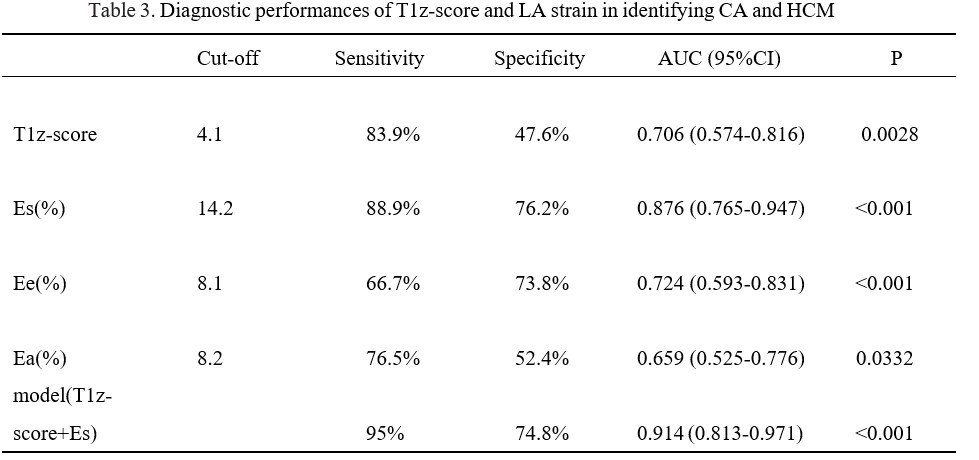
60 patients were finally enrolled including 20 patients (13 males) in the CA group, 40 (22 males) in the HCM group and 25 in the control group (13 males). Age, gender, body weight, and heart rate were similar in the CA, HCM, and control groups (all P>0.05). NT-proBNP was significantly higher in the CA group compared with the HCM group indicating a statistically significant difference (P<0.05). Maximum end-diastolic septal thickness was significantly reduced in the CA group compared with the HCM group as well as LVEF and left ventricular SV index (P<0.001). However, LVEDVi, LVESVi and LVMi were similar in the CA and HCM groups (P>0.05) as shown in Table 1. T1z-scores were significantly higher in the CA group compared with the HCM group (P<0.001). Left atrial strain was significantly lower in the CA group compared with the HCM and the differences between groups were statistically significant (all P<0.001) Table 2. The area under the curve (AUC) of T1z-score, Es, Ee and Ea were 0.706,0.884, 0.661 and 0.663 respectively (P<0.001). Multivariate logistic regression analysis (Table 3) showed that the ability of combined T1z-score and Es to identify CA and HCM was improved, yielding a higher AUC of 0.914( Figure 2).Discussion
T1 mapping can quantitatively reflect myocardial fibrosis by assessing myocardial longitudinal relaxation time without using contrast agents [9]. In the present study, the T1 values were higher in the CA group compared with the HCM and healthy control groups, suggesting a higher degree of fibrosis in the CA group, which may be attributed to the extensive deposition of amyloid in the myocardial interstitium. CMR-FT is a new technique, which has been mainly applied to assess left ventricular strain [10], the left atrial is seldom examined between CA and HCM. The left atrial has different functions in the systolic, early diastolic, and late diastolic phases of the cardiac cycle, including reservoir, conduit, and booster pump functions, respectively. Amyloid deposition on the atrial wall may directly affect the intrinsic contractile function of the atrial .The current study showed that Εs, Εe, and Εa were reduced in the CA and HCM groups compared with the control group, and these reduction were more pronounced in the CA group.This difference in left atrial function between CA and HCM patients provides a novel perspective to improve the differential diagnosis of both disorders.Conclusions
The non-contrast-enhanced T1 mapping and CMR-FT techniques hold the clinical value in the identification of CA and HCM. The combination of Es and T1 values could effectively identify CA and HCM.Acknowledgements
NoneReferences
[1] Raphael CE, Mitchell F, Kanaganayagam GS, et al. Cardiovascular magnetic resonance predictors of heart failure in hypertrophic cardiomyopathy: the role of myocardial replacement fibrosis and the microcirculation. J Cardiovasc Magn Reson.2021;23(1):26.
[2] Sennott J, Ananthasubramaniam K. Multimodality imaging approach to cardiac amyloidosis: part 2. Heart Fail Rev.2022;27(5):1515-1530.
[3] Tadic M, Cuspidi C, Plein S, et al. Comprehensive assessment of hypertensive heart disease: cardiac magnetic resonance in focus. Heart Fail Rev. 2021; 26(6): 1383-1390.
[4] Burrage MK, Ferreira VM. Cardiovascular Magnetic Resonance for the Differentiation of Left Ventricular Hypertrophy. Curr Heart Fail Rep.2020; 17(5): 192-204.
[5] Pan JA, Kerwin MJ, Salerno M (2020) Native T1 mapping, extracellular volume mapping, and late gadolinium enhancement in cardiac amyloidosis: a meta-analysis. JACC Cardiovasc Imaging.2020;13(6):1299–1310.
[6] Zhao SH. To meet the challenge of new cardiac magnetic resonance imaging technology. Chin J Med imaging Techno.2017;33(8): 1125-1128.
[7] Wu X, Tang L, Deng Q, et al. The feasibility study of MRI texture analysis in predicting delayed enhancement status in cardiac amyloidosis. Chin J Magn Reson Imaging.2021;12(12): 6-11.
[8] Paaladinesh Thavendiranathan , Lili Zhang , Amna Zafar ,et al.Myocardial T1 and T2 Mapping by Magnetic Resonance in Patients With Immune Checkpoint Inhibitor-Associated Myocarditis .J Am Coll Cardiol . 2021;77(12):1503-1516.
[9] Vigneault DM, Yang E, Jensen PJ, et al. Left Ventricular Strain Is Abnormal in Preclinical and Overt Hypertrophic Cardiomyopathy: Cardiac MR Feature Tracking. Radiology.2019; 290(3): 640-648.
[10] Buggey J, Hoit BD ,et al. Left atrial strain: measurement and clinical application. Curr Opin Cardiol .2018;33(5):479-485.
Figures