1486
A deep learning-based approach for automatic myocardial T1 map analysis1Shool of Medical Technology, Beijing Institute of Technology, Beijing, China, 2China Electronics Harvest Technology Co.,Ltd, Beijing, China, 3Department of Infectious Diseases, The Affiliated Hospital of Yan’an University, Yan’an, Shanxi, China, Beijing, China, 4Center for Biomedical Imaging Research, Department of Biomedical Engineering, School of Medicine, Tsinghua University, Beijing, China, Beijing, China
Synopsis
Keywords: Myocardium, Myocardium, deep learning
Motivation: In cardiovascular magnetic resonance, T1 analysis is generally completed in a manual manner, which is a labor-intensive and time-consuming procedure and could be automated by deep-learning algorithms.
Goal(s): This study aims to develop a deep learning-based technique for directly analyzing T1 for a T1 map.
Approach: We built a cascaded neural network to predict T1 of the left-ventricle myocardium, septum, blood, and AHA segments and generate LV mask to improve performance.
Results: The automatic T1 analysis performed by the proposed approach had good agreement with manual analysis. The mean difference was ~10 ms.
Impact: The proposed approach could automatically estimate the left ventricle, septum, and blood T1. Along with automatic motion correction and T1 calculation algorithms, the proposed approach could further simplify and improve the automatization of the workflow of myocardial T1 mapping examination.
INTRODUCTION
In cardiovascular magnetic resonance, myocardial T1 mapping has been considered a powerful tool for characterizing tissue properties and is widely used in clinical practice [1]. With healthy reference, alteration in T1 is mainly used to examine the global and regional change in the left-ventricle (LV) myocardium. In general, the native T1 of the entire left-ventricle myocardium is calculated for the detection of the whole-heart diffuse change. The regional abnormality is examined using the T1 of each AHA segment. Therefore, automatically and accurately obtaining these values from a map will play a key step in T1 analysis.Currently, manual segmentation is still the most robust step for segmenting the myocardium for T1 analysis. However, this is a labor-intensive and time-consuming procedure. Two automatic techniques have been proposed for myocardial T1 and T2 analysis [2,3]. However, these methods require the original weighted images for detecting the heart, which are not always available in clinical practice. Therefore, there is still a need to develop automatic analysis techniques for myocardial T1 mapping.
In this study, we proposed a deep learning-based network approach to directly obtaining global and regional T1 from a T1 map.
METHODS
DeepAANet: In Figure 1, DeepAANet includes two subnetworks: PredictorNet and GeneratorNet. PredictorNet is used to predict the mean and standard deviation of T1 for the entire left-ventricle (LV) myocardium (global), septum (global), blood pool, and AHA segments of the LV myocardium (regional). GeneratorNet is used to generate the LV mask. Two subnetworks are cascaded. As shown in Figure 1, Inputs for PredictorNet is a T1 map. LV mask from GeneratorNet is infused into PredictorNet to improve performance. The predicted LV T1 is used to calculate a pseudo mask of LV myocardium using the equation $$$Mask_{Pseudo}=2*exp(-\frac{T_{1,pred}}{T_{1}map}*ln2)$$$. GeneratorNet is constructed using up-convolution of U-net and its input includes predicted T1 from PredictorNet, the $$$Mask_{Pseudo}$$$ and T1 map (Figure 1). In this study, we used GoogLeNet for PredictorNet.Datasets:
The dataset used in this study consists of 1050 short axial heart slices from 210 patients with known or suspected cardiovascular disease as described in [4]. Motion correction was performed for each slice before the T1 map building. In each T1 map, contours for epicardium, endocardium, septum, and blood were manually delineated. The segmented LV myocardium was divided into 24 segments according to the AHA standards. Then, the mean and standard deviation (SD) for LV myocardium, septum, blood, and AHA segment were calculated. All T1 maps were divided into a training set (70%), a validation set (15%), and a testing set (15%).
Training, Validation, and Testing: DeepAANet was implemented on a DELL 7920 Server with one Quadro RTX 5000 GPU using Pytorch. The network was trained for 500 epochs with a batch size of 10. The mean absolute error and Binary CrossEntropy Loss were used as the loss functions to update DeepAANet with a learning rate of 0.0001.
Image and Statistical Analysis: The dice coefficient was used as an indicator of the accuracy of $$$Mask_{Pseudo}$$$ by GeneratorNet. The mean and SD of the difference in T1 between the DeepAANet and manual segmentation were calculated for each image to evaluate the accuracy of the DeepAANet.
RESULTS
DeepAANet could accurately generate the mask of the left ventricular myocardium (Figure 2), with a mean dice coefficient of around 0.85 for the training, 0.83 for the validation, and 0.81 for the testing. DeepAANet successfully predicted the T1 values for each T1 map in validation and testing (Figure 3, Figure 4, and Table 1). For the global T1 estimation, the mean difference in the left ventricular T1 was 1.55±70.41 (training), 6.38±79.64 ms (validation), and 7.66±74.71 ms (testing), and the mean difference in septum was 0.32±83.20 (training), 9.17±101.87 ms (validation) and 1.04±93.79 ms (testing). For the regional T1 estimation, the mean difference was 3.12±43.32 ms (training), 13.19±51.43 ms (validation), and 12.42±42.17 ms(testing). The mean difference in blood T1 was around 10 ms.DISCUSSION and CONCLUSION
In this study, we proposed a deep learning-based approach to automatically analyze the T1 map. We trained the proposed method using free-breathing T1 maps. Generally, compared to breathing holding, free-breathing T1 maps have suboptimal image quality, which may be the reason the large difference was found in the validation and testing. Further optimization is warranted. Results of this study indicated that LV, septal, and blood T1 could be directly estimated without manual segmentation. Along with automatic motion correction and T1 calculation algorithms [5,6], the workflow of the myocardial T1 mapping exam could be further simplified and automated by the proposed approach.Acknowledgements
This work is supported by the National Natural Science Foundation of China for Young Scholars (No. 82202138), the Fundamental Research Funds for the Young Investigator (No. XSQD-202213003), and the Fundamental Research Funds for the Central Universities (No. LY2022-22).References
Figures
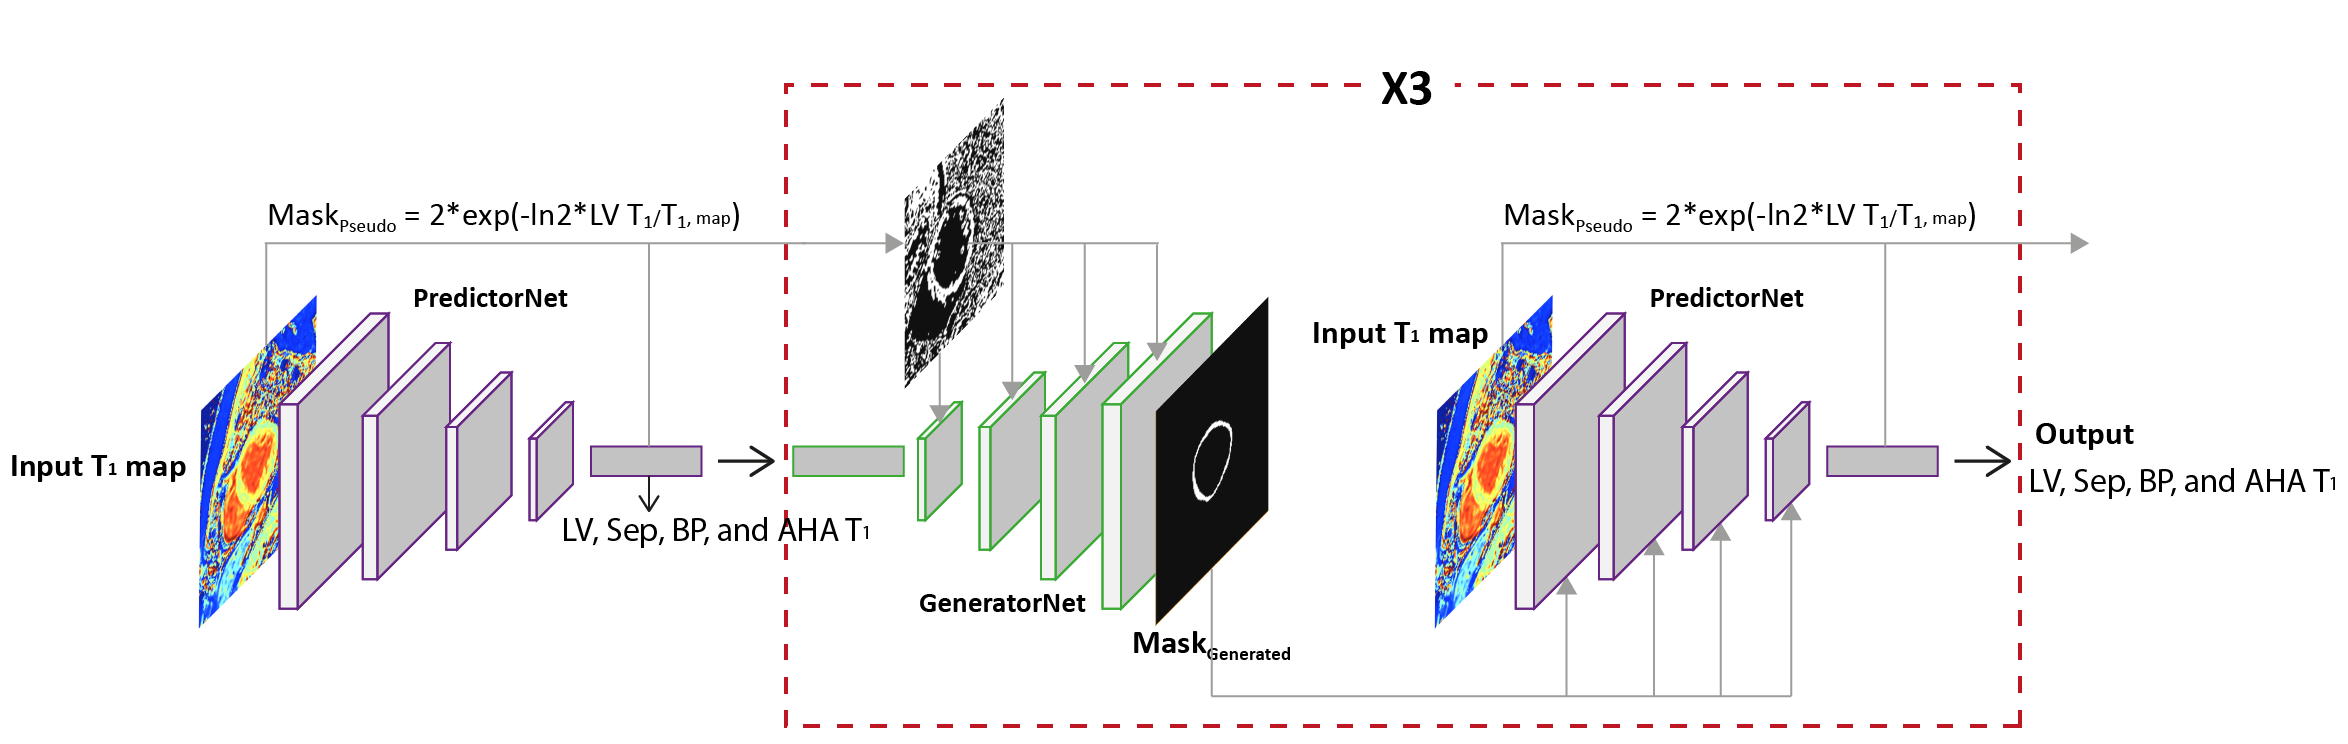
Figure 1. DeepAANet architecture. DeepAANet consists of two subnetworks: PredictorNet and GeneratorNet. DeepAANet input is a T1 map and output is T1 of the entire left-ventricle (LV) myocardium, septum (Sep), blood pool (BP), and AHA segments of the LV myocardium. PredictorNet is used to directly predict LV, Sep, BP, and AHA T1 from the input T1 map. GeneratorNet is used to generate a mask of LV myocardium with predicted T1, inputted T1 map, and pseudo LV mask. Two subnetworks are cascaded.
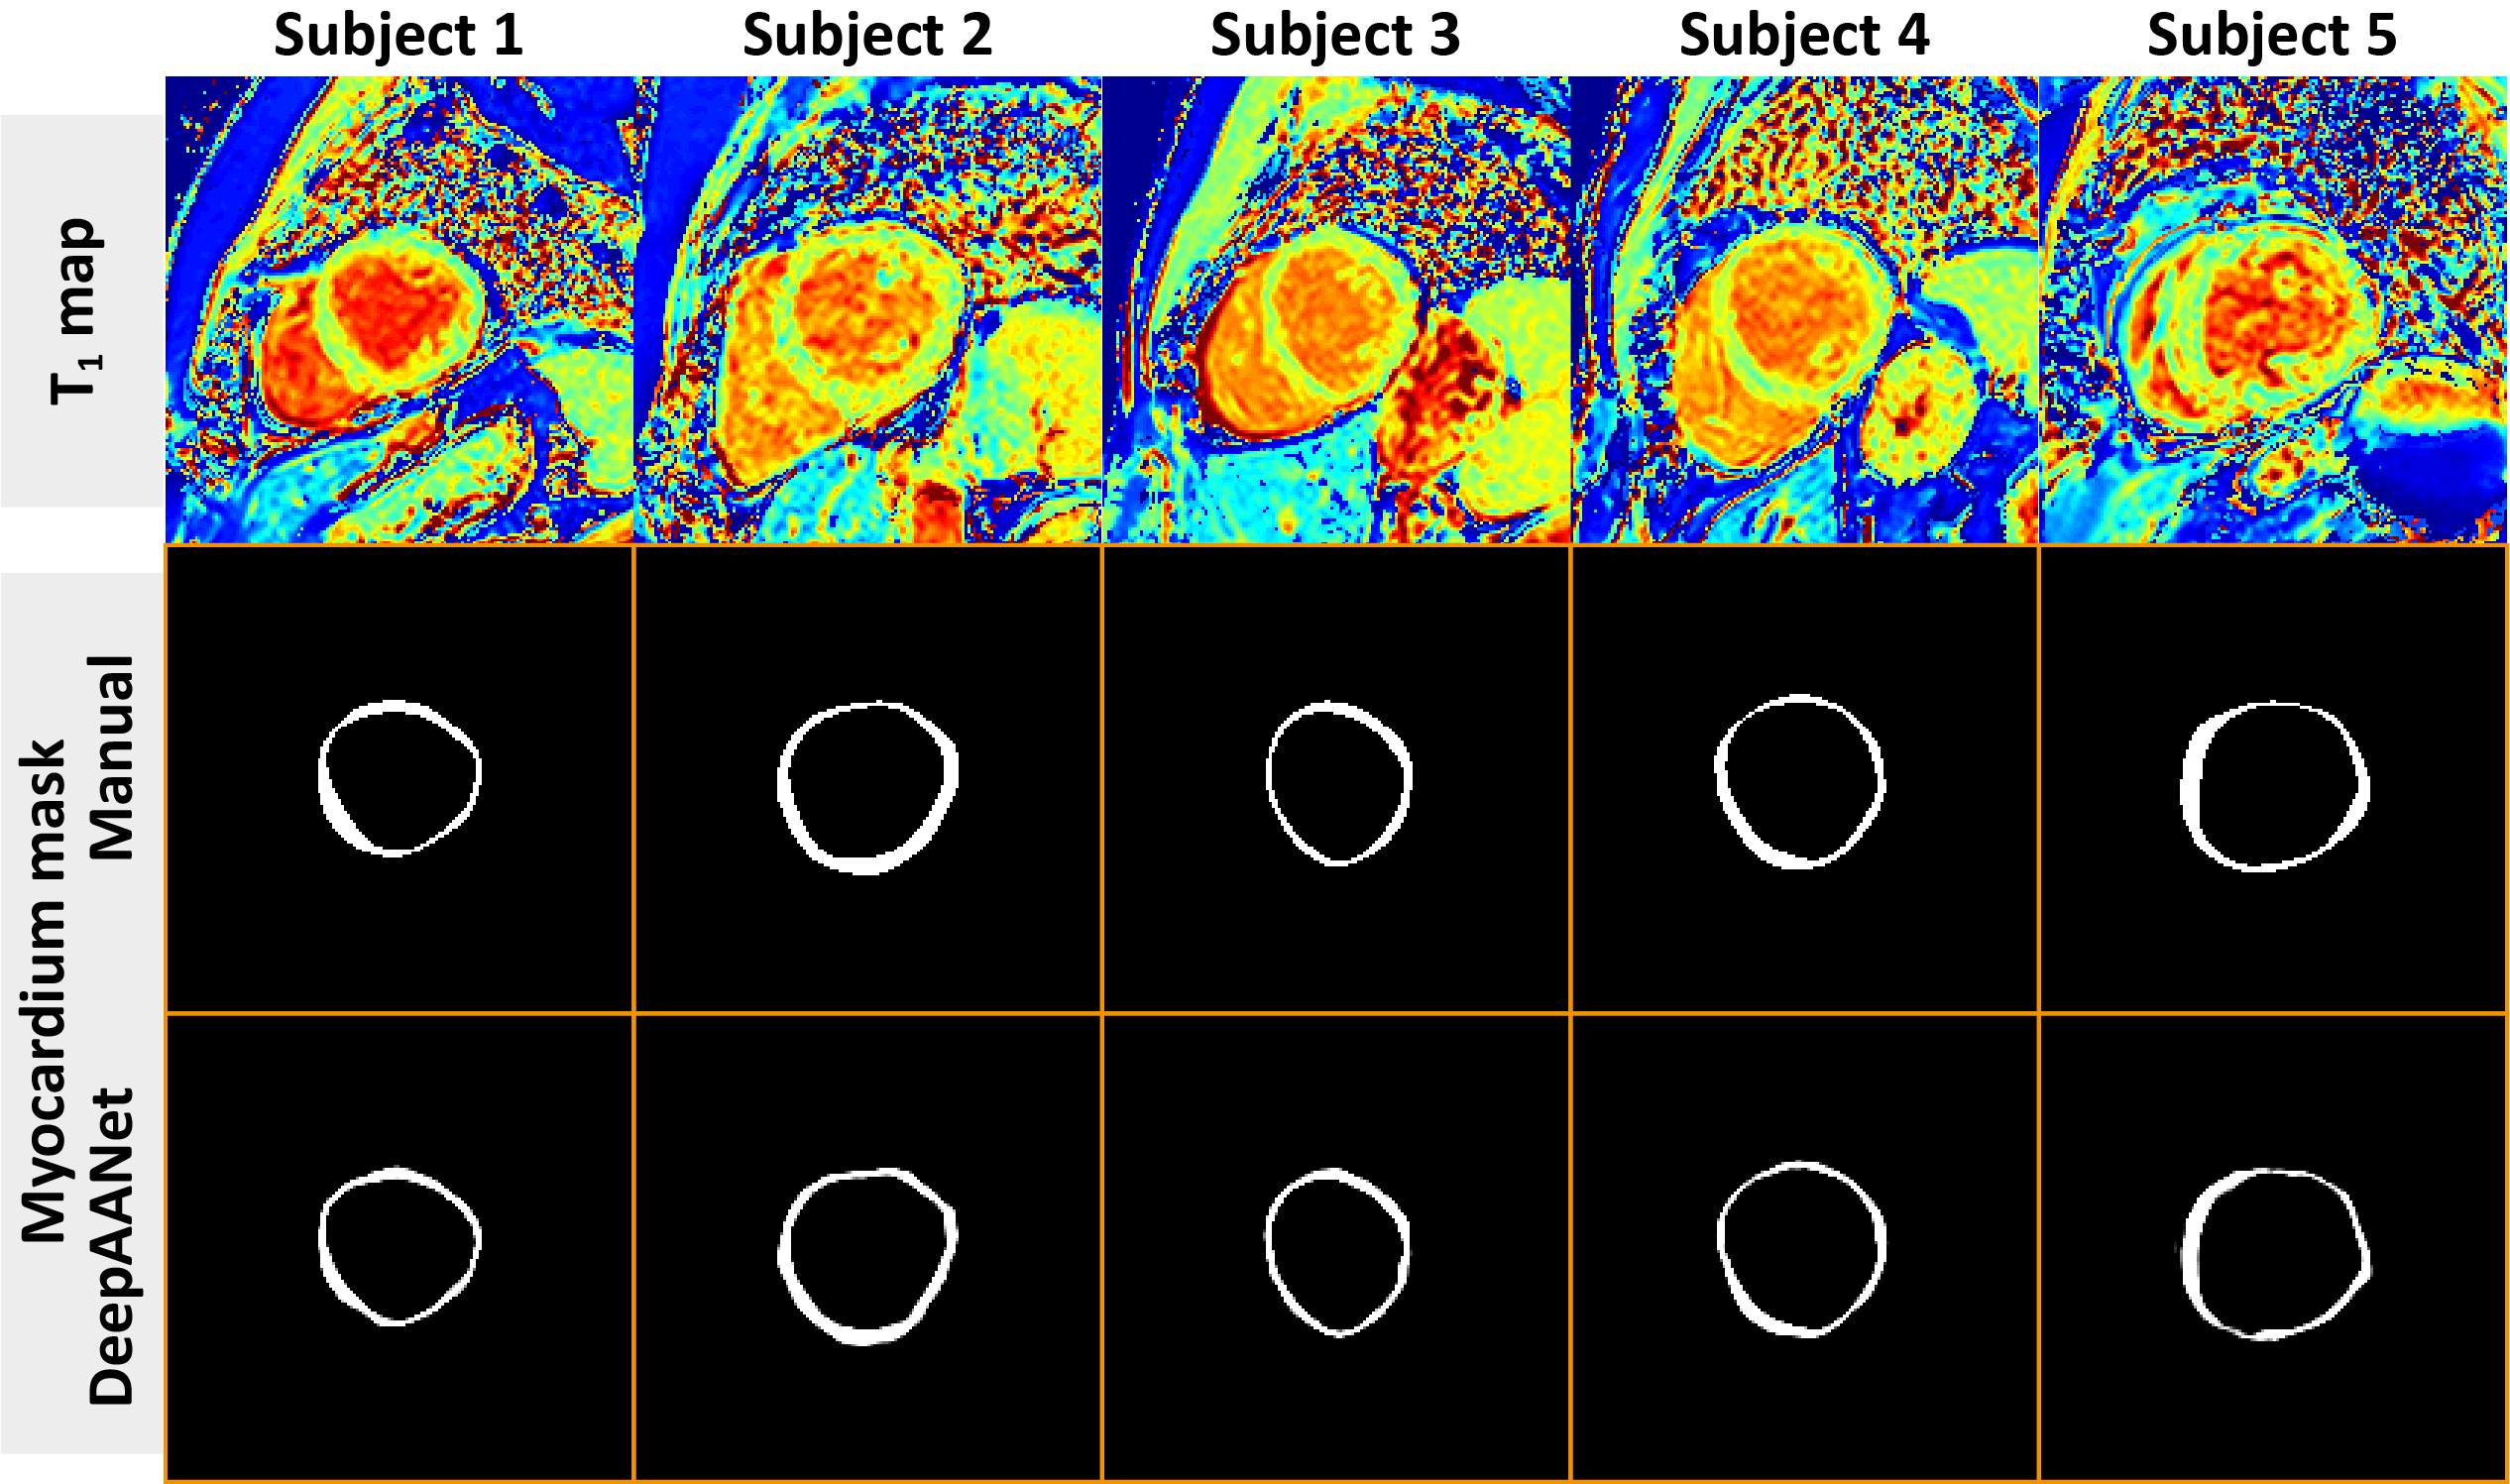
Figure 2. T1 map, manually segmented masks, and masks generated by the DeepAANet of 5 subjects. As can be seen, the DeepAANet can accurately generate the mask of the left ventricle.
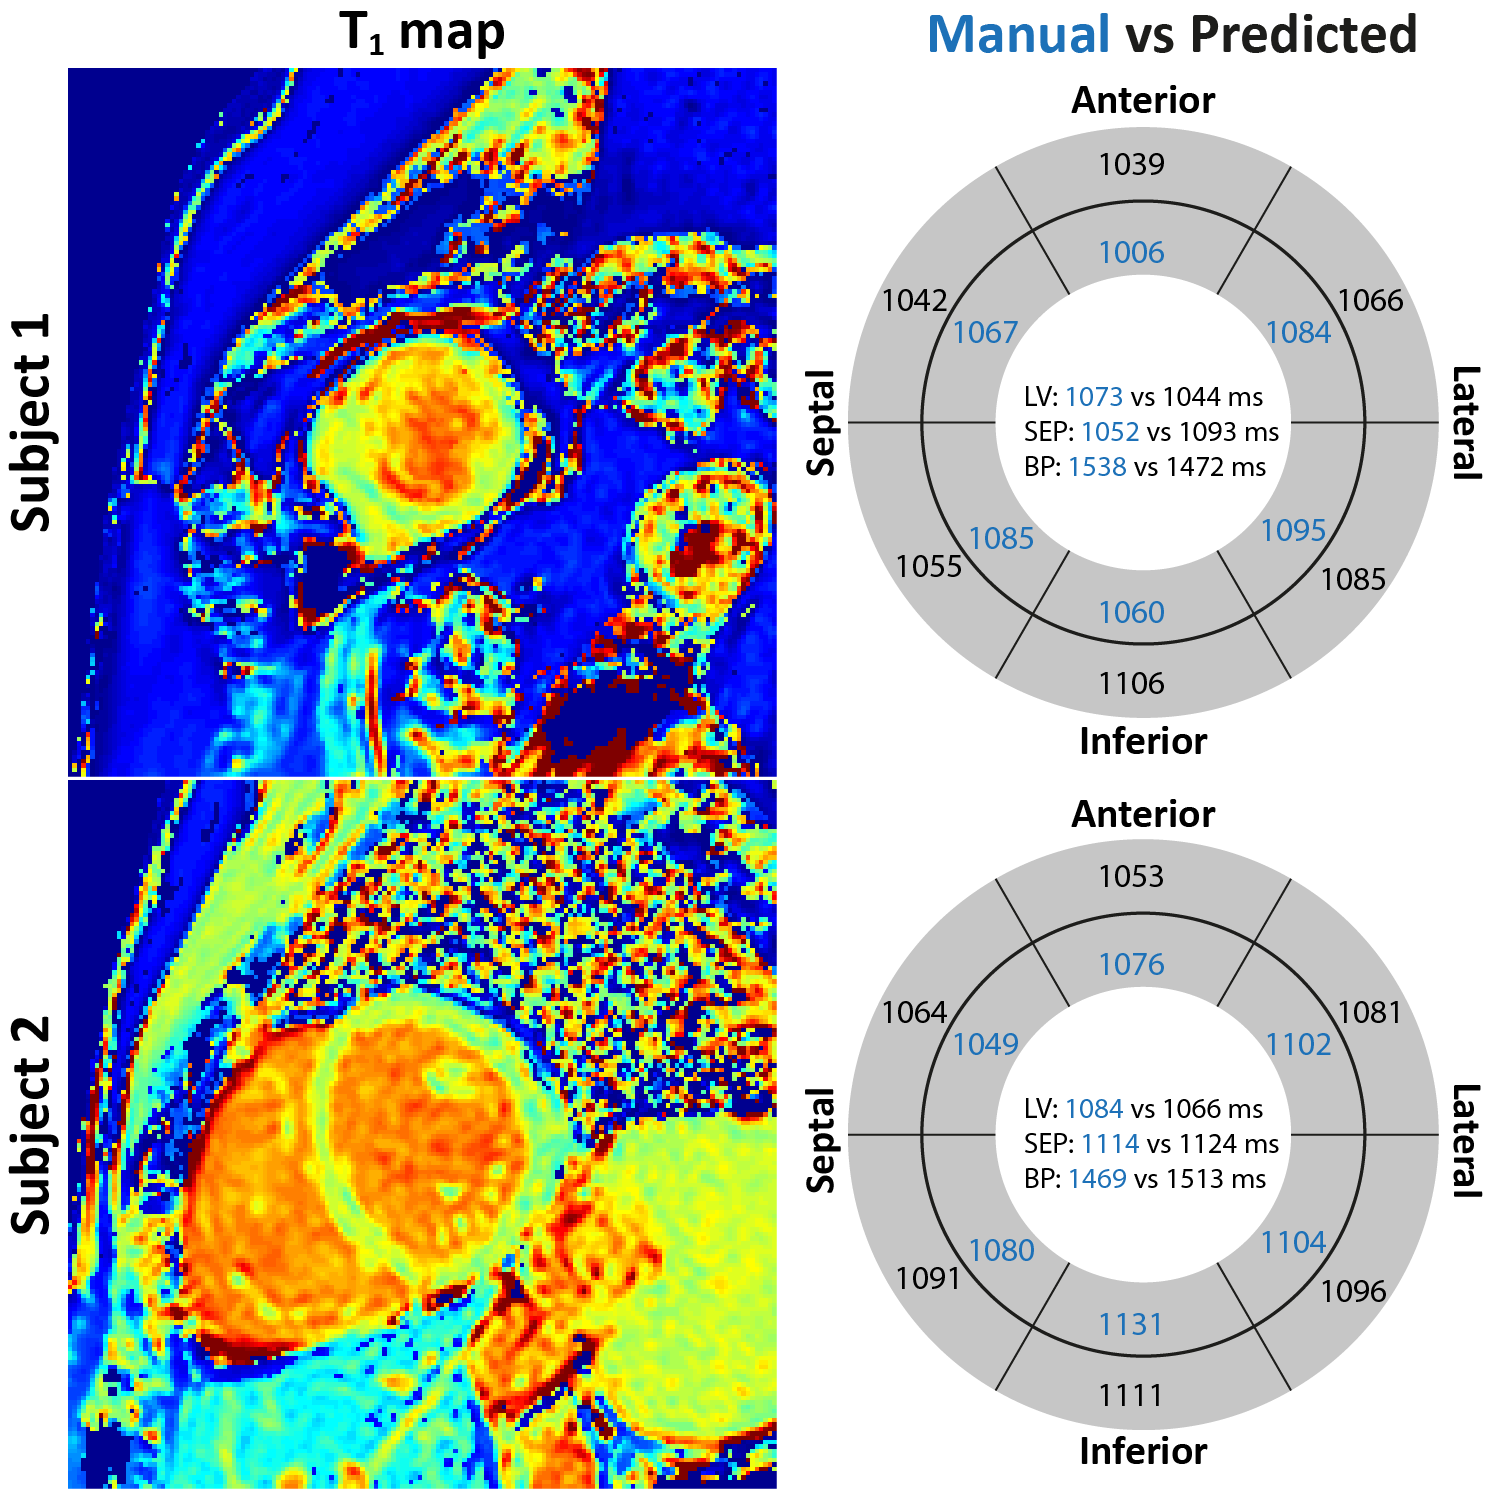
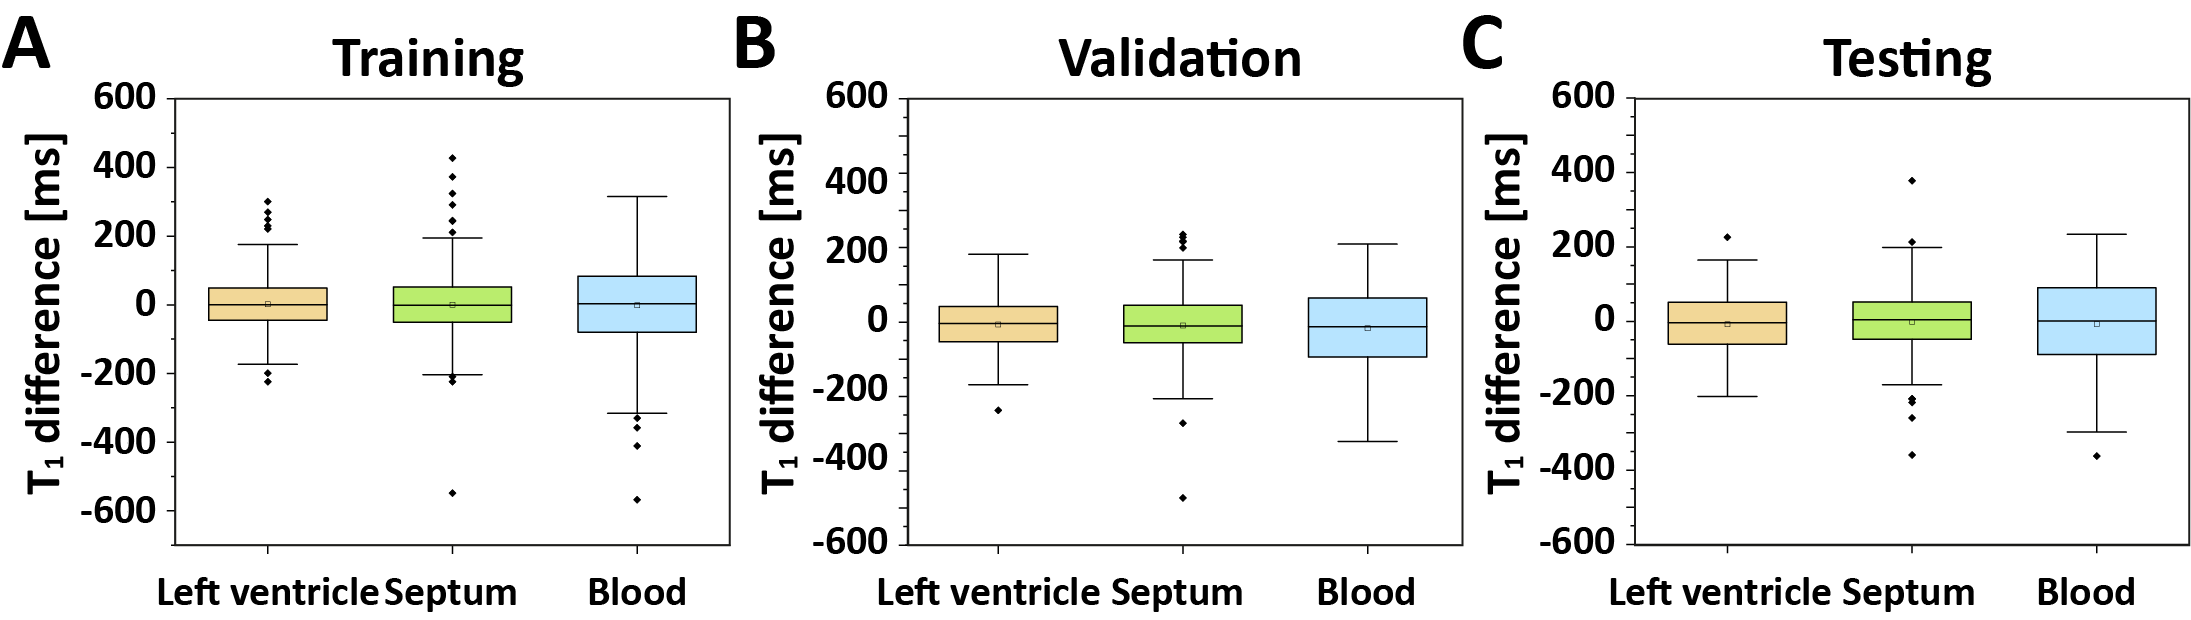
Figure 4. The result of DeepAANet. Box-plots show the mean and standard deviation (SD) of the T1 difference between DeepAAnet and manual analysis in LV myocardium, septum, and blood for all subjects.

Table 1. The mean and SD of the predicted error of the T1 in LV myocardium, septum, blood, and AHA segment for all subjects.