1485
Added value of T1 mapping derived phenotypes and polygenic risk score (PRS) for the prediction of common cardiac diseases1Human Phenome Institute, Fudan university, Shanghai, China, 2Digital Medical Research Center, School of Basic Medical Sciences, Fudan University, Shanghai, China, 3Simens Healthineers Ltd, Shanghai, China
Synopsis
Keywords: Myocardium, Myocardium, cardiac diseases
Motivation: Limited attention has been given to the evaluation of the predictive capacity of T1 mapping in the context of cardiac diseases in the present.
Goal(s): To improve clinical diagnostic precision by integrating T1 value of different AHA segments into the prediction model and find the important AHA segments for cardiac diseases prediction.
Approach: Our study employed nnU-Net to segment T1 mapping images, then to quantify T1 values of AHA segments to establish a hybrid prediction model for some common cardiac diseases.
Results: The results demonstrate that the incorporation of the hybrid prediction model with T1 mapping leads to enhanced performance.
Impact: The added value of T1 mapping enhanced the performance of the common cardiac disease prediction model. It empowered clinicians to identify potential cardiac issues earlier and making clinicians pay more attention to certain AHA segments of the cardiac diseases.
Introduction
T1 mapping, a magnetic resonance imaging technique for quantifying T1 relaxation times within cardiac tissue, offers invaluable insights in the realm of cardiovascular disease prediction and diagnosis. But in the present, limited attention has been directed towards assessing the predictive potential of T1 mapping for cardiac diseases, and the existing studies in this domain have been characterized by relatively modest sample sizes1. In our work, we precisely quantified T1 value of different AHA segments and added T1 mapping to the model, thus augmenting the accuracy of cardiac disease prediction. The integration of T1 mapping data into a comprehensive multi-gene risk assessment endows the hybrid prediction model with an expanded knowledge base, leveraging both structural and genetic insights.Methods
Dataset
In this study, ECG, Cine, and T1 mapping images through Cardiovascular Magnetic Resonance (CMR) imaging were extracted from 50,171 participants2, subjecting each data type to rigorous quality control procedures, including the removal of participants who were not included in the calculation of gene principal components and chromosome abnormalities. The final analysis included 35,971 ECG participants, as well as 26,972 for Cine3 and 34,098 for T1 mapping (Fig 2).T1 mapping analysis
The schematic representation of the data analysis pipeline is illustrated in Fig 1. We firstly involved the utilization of nnU-Net4 to extract multiple segments of cardiac T1 mapping images, specifically ranging from AHA7 to AHA12. The model was trained on a private cardiac image dataset on 500 healthy subjects and applied to the UKB dataset without fine-tuning. These segments were sourced from the raw T1 map series found among the various files provided by the UK Biobank, categorized under 'experimental shMOLLI sequence images' (field id: 20214)5. Subsequently, we quantified these segments as distinct phenotypes, utilizing statistical metrics such as mean, median, and standard deviation (sd). Quantitative data was obtained by establishing regions of interest (ROIs) within the myocardium and implementing pixel-wise mapping to compute T1 values.Association between T1 mapping and cardiac diseases
To assess the association between T1 mapping and some common cardiac diseases, we performed logistic regression analysis, using T1 mapping in AHA segments as a risk factor for cardiac diseases as the outcome. GWAS was conducted on these cardiac phenotypes using linear mixed-effect models, adjusted by age (at imaging), age-squared, sex, age-sex interaction, age-squared-sex interaction and the top 20 genetic PCs6. FUMA was used to annotate variants from the GWAS, prioritize significant genes and discover enriched pathways. Polygenic Risk Score (PRS) was utilized on each of the GWAS summary statistics of the selected cardiac diseases7.Cardiac diseases prediction model
Subsequently, a hybrid prediction model was constructed, revealing superior predictive performance in specific cardiac conditions with the incorporation of T1 mapping data. To assess the performance of diverse models, we conducted predictive correlation analyses. This dataset, which including 34,098 unrelated individuals of White British descent, was divided into training (70%) and testing (30%) subsets. We leveraged ridge regression as the predictive modeling approach. The effect sizes of T1 mapping were estimated using R package. (glmnet, version 4.1-8)Results
T1 Mapping association with common cardiac diseases
There is a significant relationship between T1 mapping and some common cardiac diseases (Fig 3). We identified a unique set of genes associated with T1 mapping that was not observed in Cine or ECG data and some pathways about heart inflammation and fibrosis (Fig 4).Variability of myocardial segments on disease prediction
Notably, there exists substantial variability in the predictive efficacy across different cardiac segments, with AHA7 and AHA8 demonstrating notably higher beta values within the model when contrasted with other anatomical regions shown in Fig 5a and 5b.Cardiac diseases prediction
In the context of specific diseases, the integration of T1 mapping data significantly improved the predictive capabilities of PRS. The prediction performance of T1 mapping phenotypes in relation to eight distinct cardiac diseases is presented comprehensively in Fig 5c. To illustrate, the inclusion of T1 mapping data elevates the predictive correlation of hypertension's PRS to a notable 0.457 (0.433, 0.481). Similarly, the incorporation of T1 mapping into the assessment of myocardial infarction results in an enhanced predictive correlation of 0.301 (0.273, 0.328).Acknowledgements
This study was supported in part by the National Natural Science Foundation of China (No. 62001120, 62331021), The Royal Society (IEC\NSFC\211235) and the Shanghai Sailing Program (No. 20YF1402400, 22YF1409300).The correspondence should be sent to Prof. Chengyan Wang (Email: wangcy@fudan.edu.cn)References
1. Sunthankar, S. D. et al. Comprehensive cardiac magnetic resonance T1, T2, and extracellular volume mapping to define Duchenne cardiomyopathy. J. Cardiovasc. Magn. Reson. 25, 44 (2023).
2. Zhao, B. et al. Heart-brain connections: Phenotypic and genetic insights from magnetic resonance images. Science 380, abn6598 (2023).
3. Bai, W. et al. A population-based phenome-wide association study of cardiac and aortic structure and function. Nat. Med. 26, 1654–1662 (2020).
4. Isensee, F., Jaeger, P. F., Kohl, S. A. A., Petersen, J. & Maier-Hein, K. H. nnU-Net: a self-configuring method for deep learning-based biomedical image segmentation. Nat. Methods 18, 203–211 (2021).
5. Nauffal, V. et al. Genetics of myocardial interstitial fibrosis in the human heart and association with disease. Nat. Genet. 55, 777–786 (2023).
6. Stephens, Z. D. et al. Big Data: Astronomical or Genomical? PLOS Biol. 13, e1002195 (2015).
7. Collister, J. A., Liu, X. & Clifton, L. Calculating Polygenic Risk Scores (PRS) in UK Biobank: A Practical Guide for Epidemiologists. Front. Genet. 13, 818574 (2022).
Figures
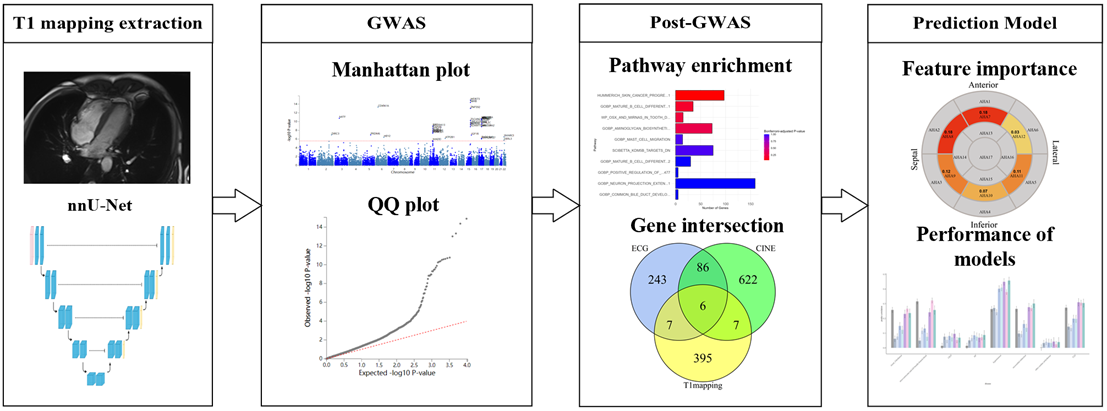
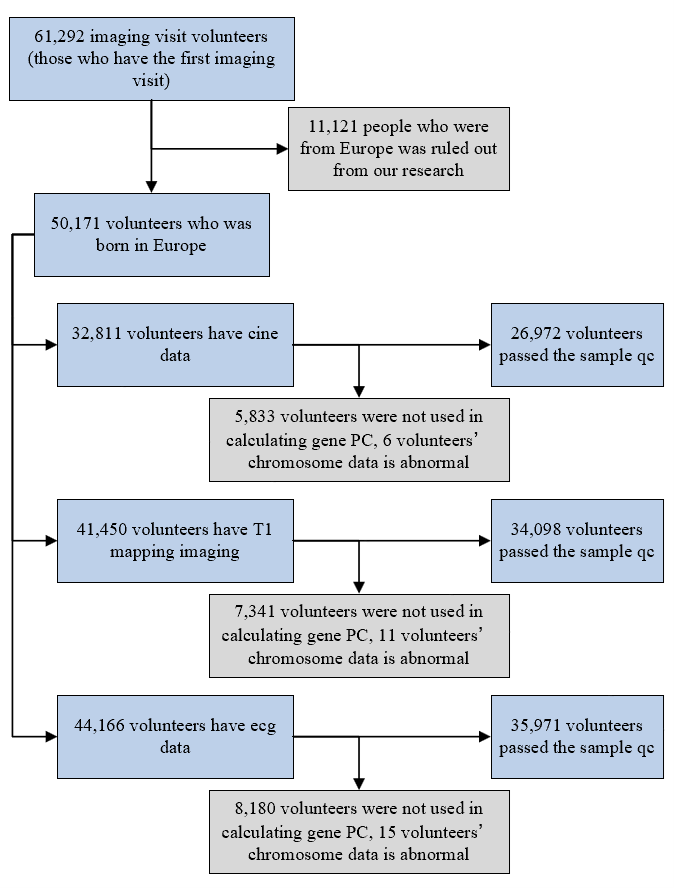
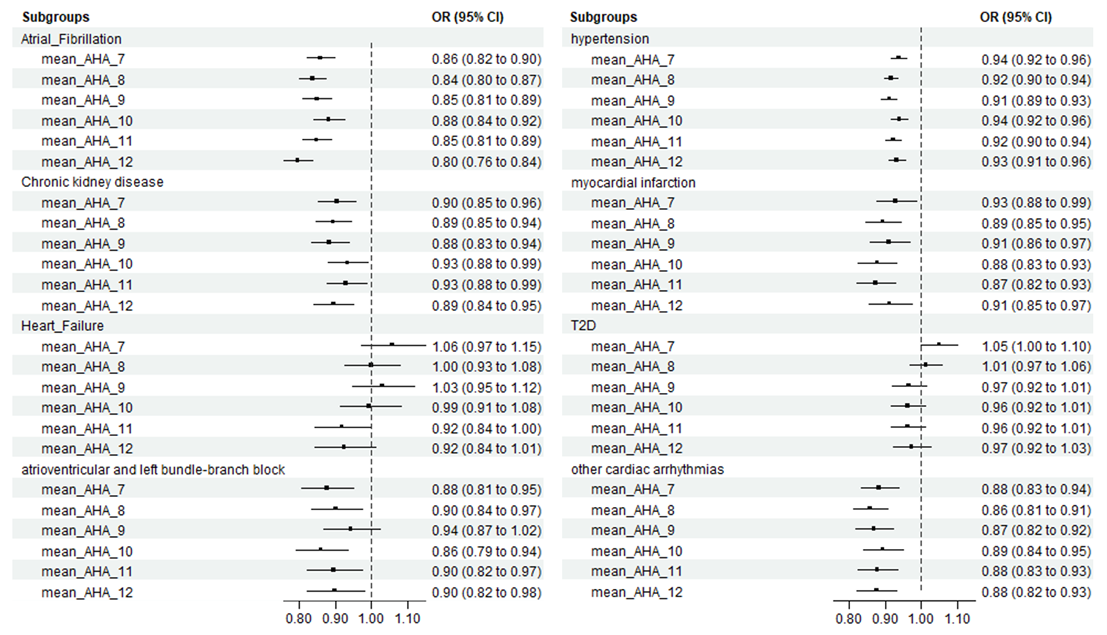
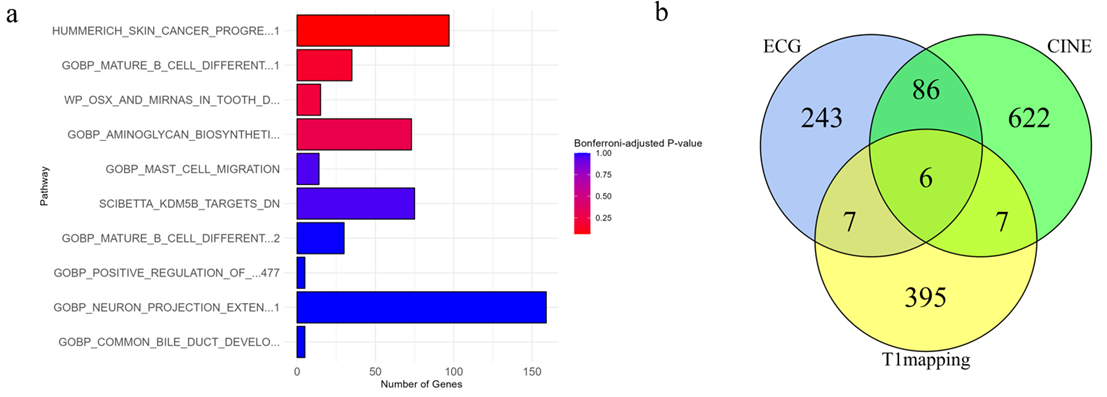
Fig 4 Post genome-wide association study. (a) The pathway enrichment of myocardial interstitial fibrosis. (b) Venn plot indicates the significant genes intersection of ecg, cine and T1 mapping.
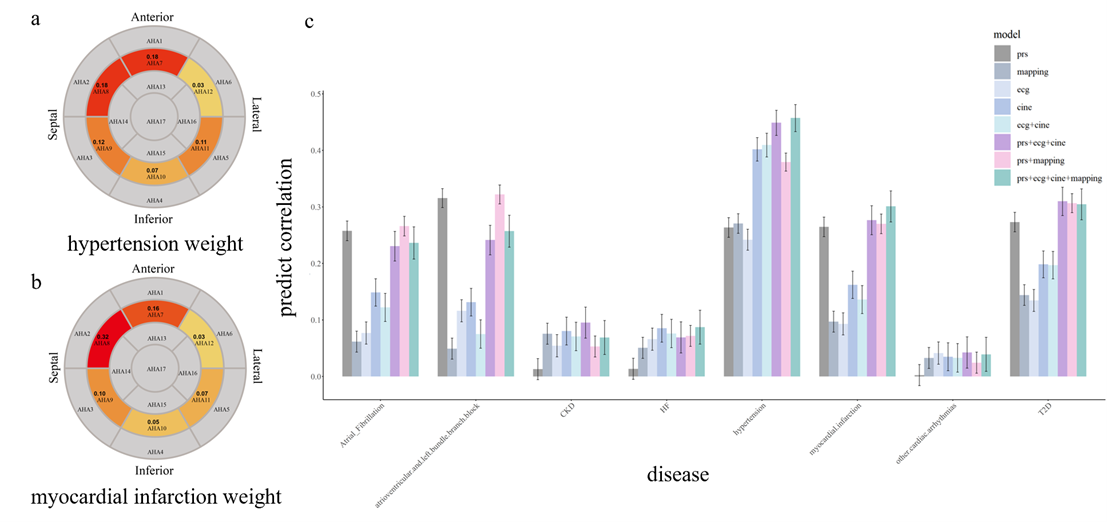
Fig 5 The performances of prediction models on common cardiac diseases. (a and b) The weight the mean value of T1 of the AHA7 - AHA12 segments. (c) The comparison of the performance among the different prediction models.