1480
The Preliminary Application of Quantitative Susceptibility Mapping in the T Staging of Rectal Cancer1The Affiliated Hospital of Xuzhou Medical University, Xuzhou, China, 2Philips Healthcare, Shanghai, China
Synopsis
Keywords: fMRI Analysis, Cancer
Motivation: The T staging of rectal cancer mainly relies on high-resolution T2-weighted MRI sequences. However, there are cases of both over-staging and under-staging.
Goal(s): To investigate the preliminary application value of quantitative susceptibility mapping in the T staging of rectal cancer.
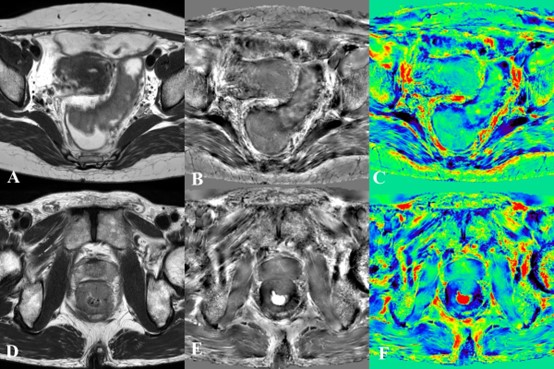
Approach: In addition to the conventional scanning sequences, horizontal axial T2-weighted imaging (T2WI) and QSM sequences were acquired. The tumor segmentation was done with reference to T2WI images at the QSM-weighted image. The magnetic susceptibility histogram data of tumor tissues were calculated with FireVoxel build 394D software.
Results: The differences of magnetic susceptibility histogram parameters in different T-stage rectal cancer were statistically significant.
Impact: Quantitative susceptibility histogram shows promise in aiding the T staging of rectal cancer.
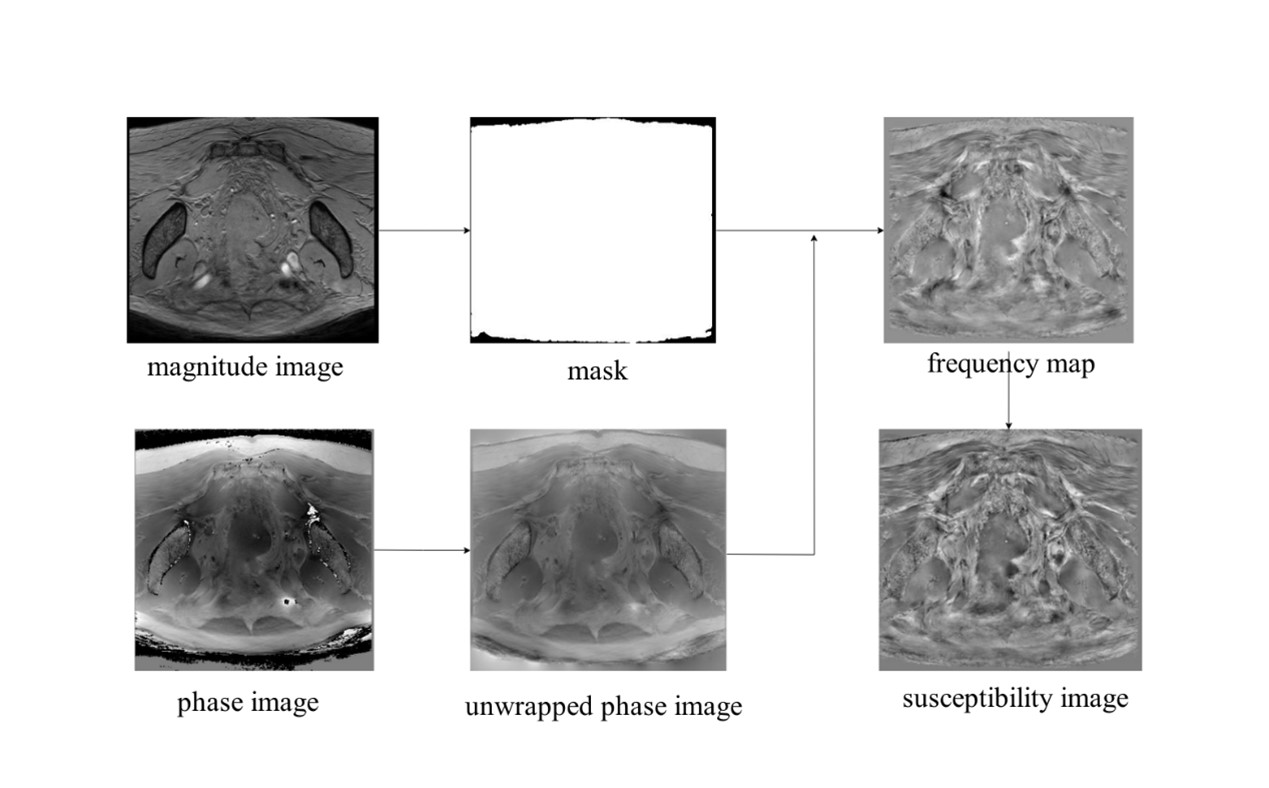
Methods Data of patients who underwent rectal MRI examinations in our hospital from October 2022 to October 2023 were retrospectively analyzed. All patients were examined with a 3.0T MR Scanner (Ingenia Elition, Philips, The Netherlands). In addition to the conventional scanning sequences of rectal cancer, horizontal axial T2-weighted imaging (T2WI) and QSM sequences were acquired. The QSM-weighted images were processed using STI_Suite V3.0 software in MATLAB version 2018b (MathWorks, Natick, MA) for phase unwrapping and background field removal. The QSM processing and analysis flow was shown in Figure 1. Image segmentation was carried out using FireVoxel build 394D software (https://firevoxel.org/). A senior radiologist with over 20 years of experience in rectal MRI diagnosis marked the layer of the maximum tumor invasion on QSM-weighted images for subsequent image analysis. Two additional radiologists, one with a decade of experience and the other with five years of experience in rectal MRI diagnosis, segmented the tumor tissue at a distance of 1mm from the inner edge of the tumor on the marked layer. The tumor segmentation was done with reference to T2WI images at the same layer while avoiding the influence of intraluminal gas and liquid. The magnetic susceptibility histogram data of tumor tissues were calculated with FireVoxel build 394D software by its statistical function. Tumor staging was evaluated by a senior pathologist major in rectal cancer, according to the 8th edition of the American Joint Committee on Oncology pathological staging of colorectal cancer. Statistical analysis was performed with SPSS 26.0 software, including inter-observer consistency evaluation using the intraclass correlation coefficient (ICC). The histogram data of magnetic susceptibility between two groups were compared using independent sample t test. P < 0.05 was considered statistically significant. Receiver operating characteristic (ROC) curve was generated to evaluate the diagnostic efficacy of tissue susceptibility for pT staging.
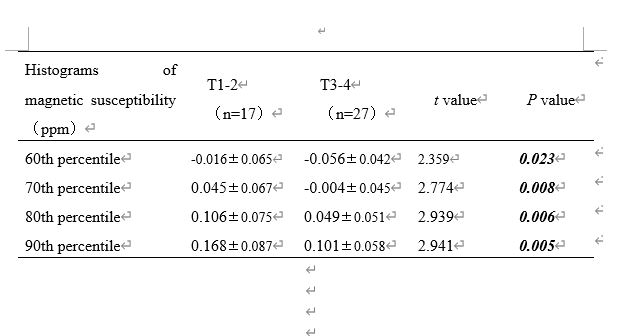
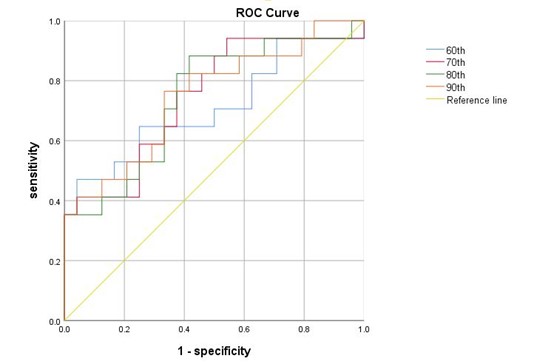
Results The study included 44 patients, with an average age of patients was 64.14±10.73 years old. Among them,17 cases (39%) were classified as pT1-2 stage, and 24 cases (61%) as pT3-4 stage. The median tissue magnetic susceptibility was -0.096 (0.078) ppm. The paramagnetic effects of 60th, 70th, 80th and 90th percentiles of T3-4 stage rectal cancer were significantly higher compared to corresponding T1-T2 stage rectal cancer. Specifically, the differences in paramagnetic effects were as follows: 60th percentile (-0.056±0.042 ppm vs. 0.016±0.065 ppm), 70th percentile (-0.004±0.045 ppm vs. 0.045±0.067 ppm), 80th percentile (0.049±0.051 ppm vs. 0.106±0.075 ppm), and 90th percentile (0.101±0.058ppm vs.0.168±0.087 ppm). These differences were statistically significant (P < 0.05). Magnetic susceptibility histogram parameters in different T-stage rectal cancer were shown in Figure 3. Furthermore, an inverse relationship was observed between the percentile and the paramagnetic effect of the lesion, as the paramagnetic effect decreased, and the diamagnetic effect increased with increasing percentiles. The area under curve (AUC) values for the 60th, 70th, 80th and 90th percentiles of susceptibility in differentiating T1-2 from T3-4 rectal cancer were 0.708, 0.738, 0.745 and 0.755, respectively. The sensitivity was 0.471, 0.941, 0.882, 0.765, respectively, and the specificity was 0.958, 0.458, 0.583, 0.667, respectively. Quantitative susceptibility predicting rectal cancer T-stage ROC curve was shown in Figure 4.
Discussion This study has the following limitations: 1. The sample size is relatively small, and further analysis will require an expansion of the sample size. 2. As a preliminary study, we only measured the tissue magnetization at the maximum tumor level, which may not fully reflect the pathological characteristics of the tumor. Subsequent analysis of the entire tumor is needed.
Conclusion Quantitative susceptibility histogram based on QSM technique shows promise in aiding the T staging of rectal cancer.
Acknowledgements
No acknowledgement found.References
REITH T P, PRAH M A, CHOI E J, et al. Basal Ganglia Iron Content Increases with Glioma Severity Using Quantitative Susceptibility Mapping: A Potential Biomarker of Tumor Severity [J]. Tomography, 2022, 8(2): 789-97.
AIMO A, HUANG L, TYLER A, et al. Quantitative susceptibility mapping (QSM) of the cardiovascular system: challenges and perspectives [J]. J Cardiovasc Magn Reson, 2022, 24(1): 48.
ZHAO L, LIANG M, YANG Y, et al. Histogram models based on intravoxel incoherent motion diffusion-weighted imaging to predict nodal staging of rectal cancer [J]. Eur J Radiol, 2021, 142: 109869.
Figures